2839
Discrimination of tumor texture based on MRI radiomic features: is there a volume threshold? A phantom study.
Linda Bianchini1, João Santinha2,3, Francesca Botta4, Daniela Origgi4, Marta Cremonesi4, and Alessandro Lascialfari1
1University of Pavia, Pavia, Italy, 2Champalimaud Center for the Unknown, Lisbon, Portugal, 3Instituto Superior Técnico, Lisbon, Portugal, 4European Institute of Oncology IRCCS, Milan, Italy
1University of Pavia, Pavia, Italy, 2Champalimaud Center for the Unknown, Lisbon, Portugal, 3Instituto Superior Técnico, Lisbon, Portugal, 4European Institute of Oncology IRCCS, Milan, Italy
Synopsis
This study tested the hypothesis that some MRI-based radiomic features could lose their texture descriptive power below a volume threshold, compromising the robustness of prediction models. The ability of features to discriminate different textures as a function of the tumor volume was investigated on T2-weighted images of a customized pelvic phantom. The images were acquired on three scanners and considered three different textures, from a finer to a coarser one. The texture discriminative ability was shown to depend on tumor volume, with most features losing this property with a VOI smaller than 1 cm3 at 1.5 T.
INTRODUCTION
Radiomics is based on the hypothesis that quantitative imaging of tumors anatomy can infer information on tumors functional and progression mechanisms, by investigating the spatial variations in the tumoral tissues and its surroundings.1 Textural features, as descriptors of such spatial variations, cover a key role in radiomic-based prediction models. Some studies analyzed the behavior of texture quantifiers as a function of the tumor volume on 18F-FDG PET images, concluding that small tumors should not be included in studies of intratumoral heterogeneity of tracer uptake since they are not large enough to adequately sample the heterogeneous signal distribution.2, 3 The hypothesis of the present study was that, also in MRI, some radiomic features may lose their discriminative power in terms of texture below a certain volume threshold. Our aim was to investigate the ability of MRI-based radiomic features to discriminate different textures, specifically realized in a phantom to mimic a range of pelvic tumor textures, as a function of the volume of the region considered for the feature extraction.METHODS
A radiomic phantom4 was imaged in a test-retest study with a T2-weighted sequence included in the clinical protocol for pelvic diagnosis. Three scanners were considered: a 1.5 T GE (A), a 1.5 T Philips (B) and a 3 T Philips (C). The phantom included regions with different textures (1, 2 and 3). Inside each of these regions, 6 cylindrical volumes of interest (VOI) were drawn with volumes ranging from 29.8 to 0.8 cm3 (Fig. 1). The radiomic features were extracted from each VOI with PyRadiomics (3.0.1)5, considering the first- and higher-order features. The extraction was performed on original and filtered images (Laplacian of Gaussian, Wavelet, Square, Square Root, Logarithm, Exponential filters). The Intraclass Correlation Coefficient (ICC) was calculated between the features extracted from the test and retest images, to evaluate repeatability. Only the features showing ICC > 0.9 were selected. The features firstorder_Energy, firstorder_TotalEnergy, glrlm_GreyLevelNonUniformity, glrlm_RunLengthNonUniformity, glszm_GreyLevelNonUniformity, gldm_DependenceNonUniformity, gldm_GreyLevelNonUniformity, and ngtdm_Coarseness were manually corrected for their intrinsic volume dependence, as indicated in the literature.6, 7 An uncertainty was defined and associated to each feature. For each volume V and for each texture i (i=1, 2, 3), let ft(i,V) and fr(i,V) be the values of the feature in the test and retest acquisition, respectively. The uncertainty was calculated as $$$ \sigma (i, V) = 1.96 \left| f_t (i, V) - f_r (i, V) \right|$$$. Each feature was represented as $$$f_t (i, V) \pm \sigma (i, V)$$$, which was used as interval to compare the textures pairwise. If the intervals did not overlap, the feature was assumed to be able to discriminate the considered textures. If the intervals overlapped, the feature was considered as not capable of distinguishing the textures.RESULTS AND DISCUSSION
Fig. 2 shows the number of times a feature is able to discriminate texture 1 and 2 when extracted from the 10 image types (original + filtered ones) on scanner A. Due to the selection of features with ICC>0.9, not all the features were extracted from all the available image types, so the maximum count a feature could reach is indicated next to the feature name on y axis. The discriminative power of the majority of the features shows a dependence on the VOI size and in particular less ability to distinguish the textures is observed at the smallest VOI (0.8 cm3). This behavior is even more evident when considering textures 1 and 3 (Fig. 3). A similar trend can be observed on scanner B (Fig. 4). A clear trend was not identifiable when comparing textures 2 and 3, suggesting that in presence of more similar patterns even larger volumes might be critical, depending on the specific texture of the tissues under investigation. When assessing the results on scanner C, a decrease in the performance of the features in terms of their ability to distinguish two textures was observed for all the VOI sizes (Fig. 5). This seems to suggest that, when considering small tumors, the texture descriptors may have a higher probability of failure in discriminating two textures at higher field strength (3 T vs 1.5 T). The best discrimination ability is associated with the largest VOI (29.8 cm3).CONCLUSIONS
The capacity of radiomic features to discriminate two different textures showed a dependence on the VOI size in the considered scenario. At 1.5 T, when considering a VOI of 0.8 cm3, most of the features were not able to distinguish two textures. This result suggest that the texture descriptors may not be reliable under 1 cm3 threshold on T2-weighted images. At larger volumes, the texture discriminative power is volume and texture dependent. Above 25 cm3 the discriminative ability appears to be confirmed for most features on both original and filtered images. A similar analysis is suggested in each radiomic study, especially when including very small tumors, to ensure the associated radiomic model to be robust. Further investigations, considering other textures, volumes, anatomical regions, and MR sequences, are warranted to confirm and generalize these results. This preliminary work sets the basis for a procedure that can be tuned by other scientists for their specific needs. A deeper examination is needed in particular for 3 T scanners.Acknowledgements
No acknowledgement found.References
- Gillies RJ, Anderson AR, Gatenby RA, Morse DL. The biology underlying molecular imaging in oncology: from genome to anatome and back again. Clin Radiol 2010;65:517–21. doi:10.1016/j.crad.2010.04.005.
- Brooks FJ, Grigsby PW. The effect of small tumor volumes on studies of intratumoral heterogeneity of tracer uptake. J Nucl Med 2014;55:37–42. doi:10.2967/jnumed.112.116715.
- Brooks FJ, Grigsby PW. Low-order non-spatial effects dominate second-order spatial effects in the texture quantifier analysis of 18F-FDG-PET images. PLoS One 2015;10:1–17. doi:10.1371/journal.pone.0116574.
- Bianchini, Linda, et al. "PETER PHAN: An MRI phantom for the optimisation of radiomic studies of the female pelvis." Physica Medica 71 (2020): 71-81.
- Van Griethuysen, Joost JM, et al. “Computational radiomics system to decode the radiographic phenotype.” Cancer research 77.21 (2017): e104-e107.
- Shafiq-ul-Hassan, Muhammad, et al. "Voxel size and gray level normalization of CT radiomic features in lung cancer." Scientific reports 8.1 (2018): 1-9.
- Fave, Xenia, et al. "Impact of image preprocessing on the volume dependence and prognostic potential of radiomics features in non-small cell lung cancer." Translational Cancer Research 5.4 (2016): 349-363.
Figures
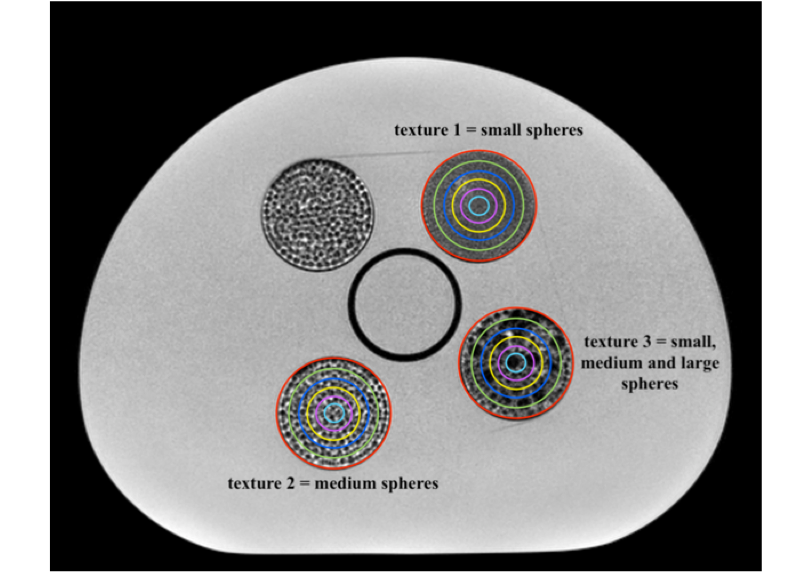
Figure 1. Identified VOIs and textures. Three phantom inserts were chosen as representative of three textures, from a finer texture (1) to a coarser one (3), through a medium texture (2). The volumes of the selected VOIs were: 29.8 cm3 (red), 20.7 cm3 (green), 13.3 cm3 (blue), 7.4 cm3 (yellow), 3.3 cm3 (pink), and 0.8 cm3 (cyan).
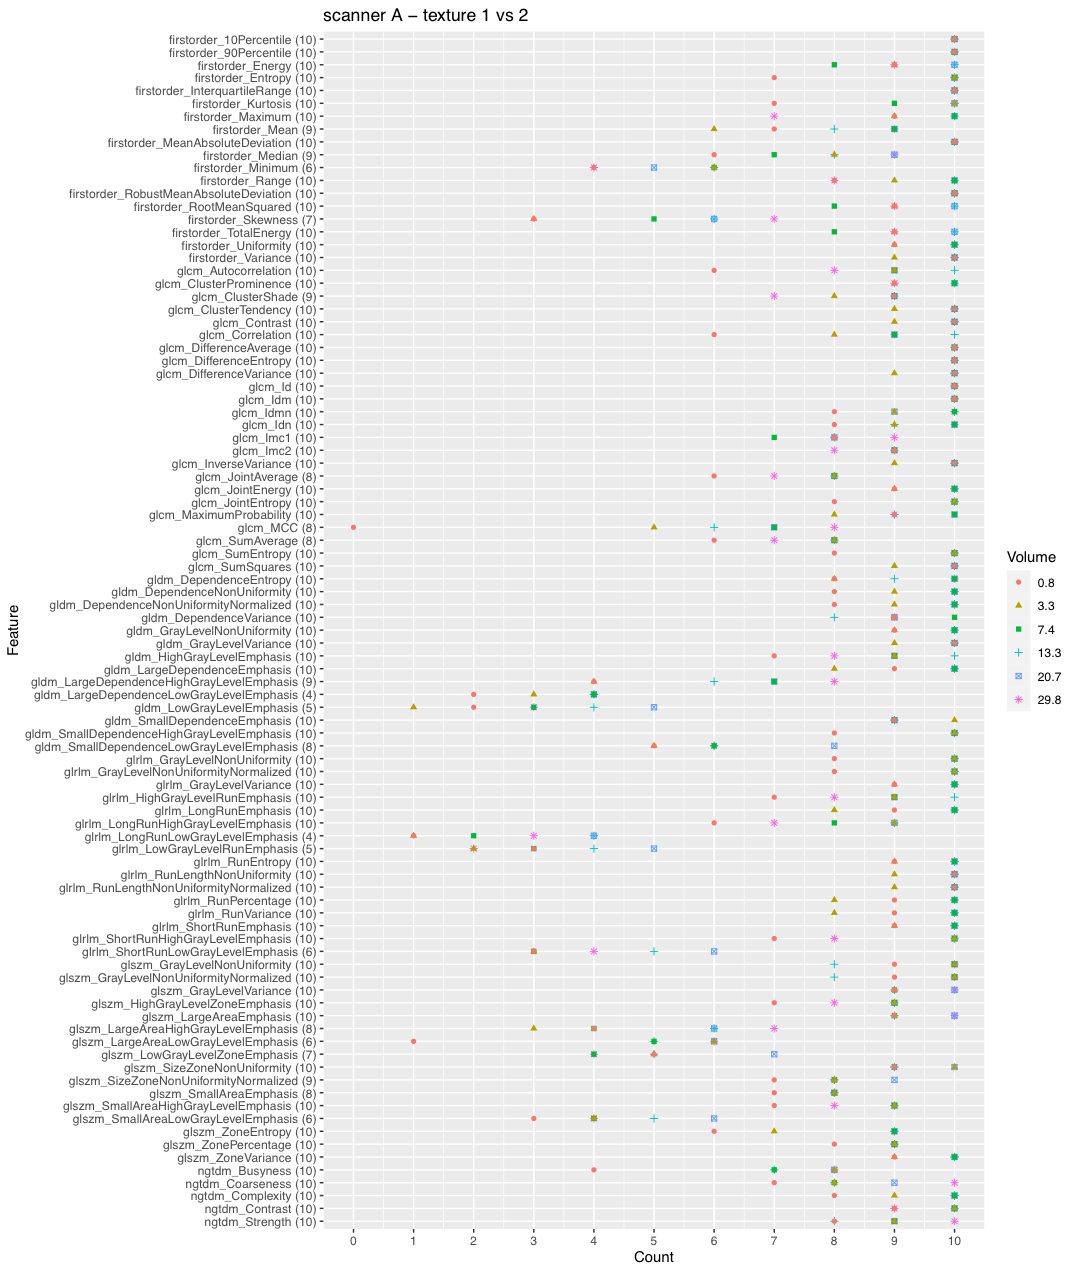
Figure 2. Discrimination of textures 1 and 2 on scanner A. The plot shows the number of times a feature is able to discriminate texture 1 and 2 if extracted from original and filtered images acquired on scanner A, as a function on the VOI size. Due to the selection of features with ICC>0.9, not all the features were extracted from all the available image types (10 in total: original + 9 filtered images), so the maximum count a feature could reach is indicated next to the feature name on y axis.
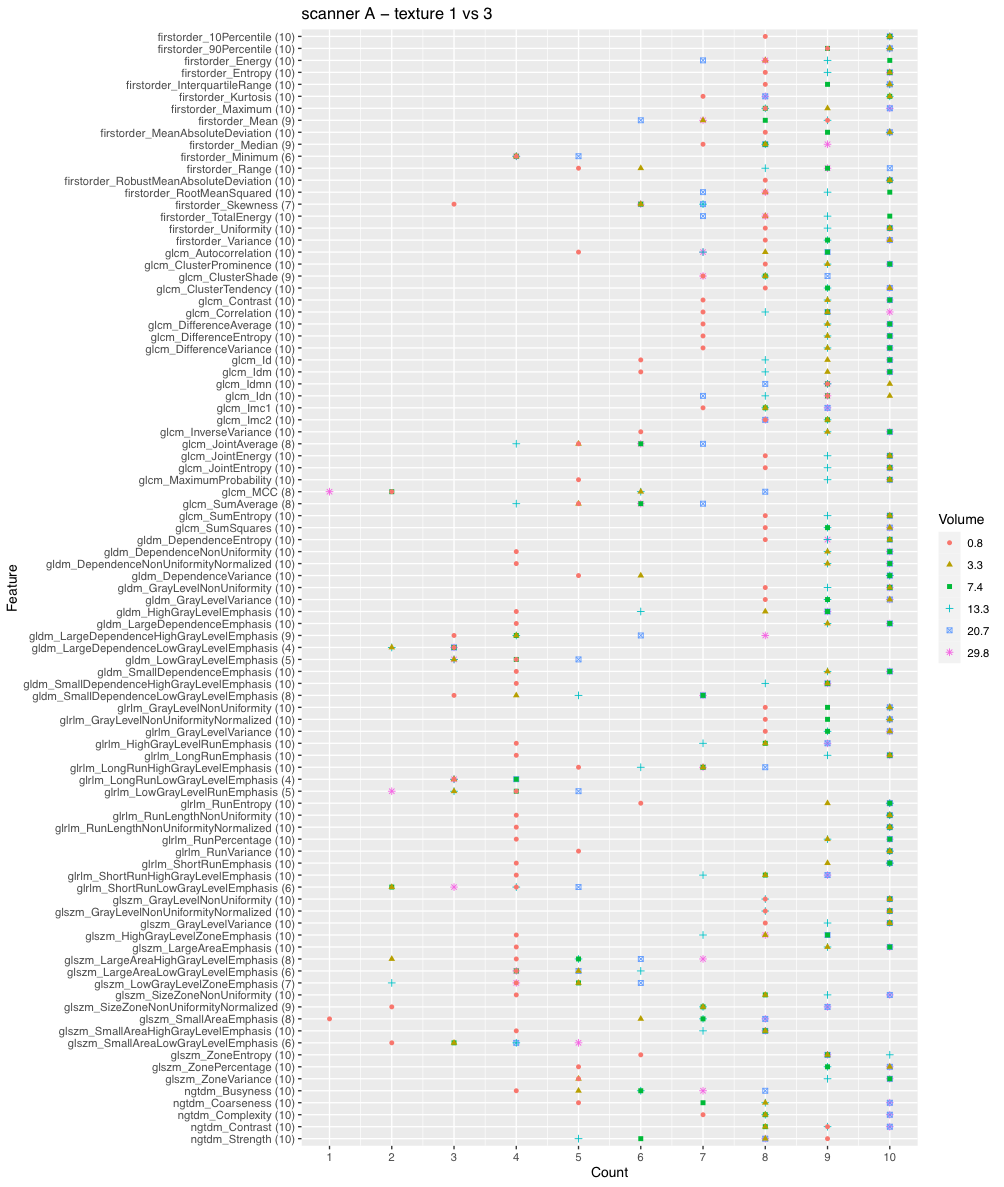
Figure 3. Discrimination of textures 1 and 3 on scanner A. The plot shows the number of times a feature is able to discriminate texture 1 and 3 if extracted from original and filtered images acquired on scanner A, as a function on the VOI size. Due to the selection of features with ICC>0.9, not all the features were extracted from all the available image types (10 in total: original + 9 filtered images), so the maximum count a feature could reach is indicated next to the feature name on y axis.
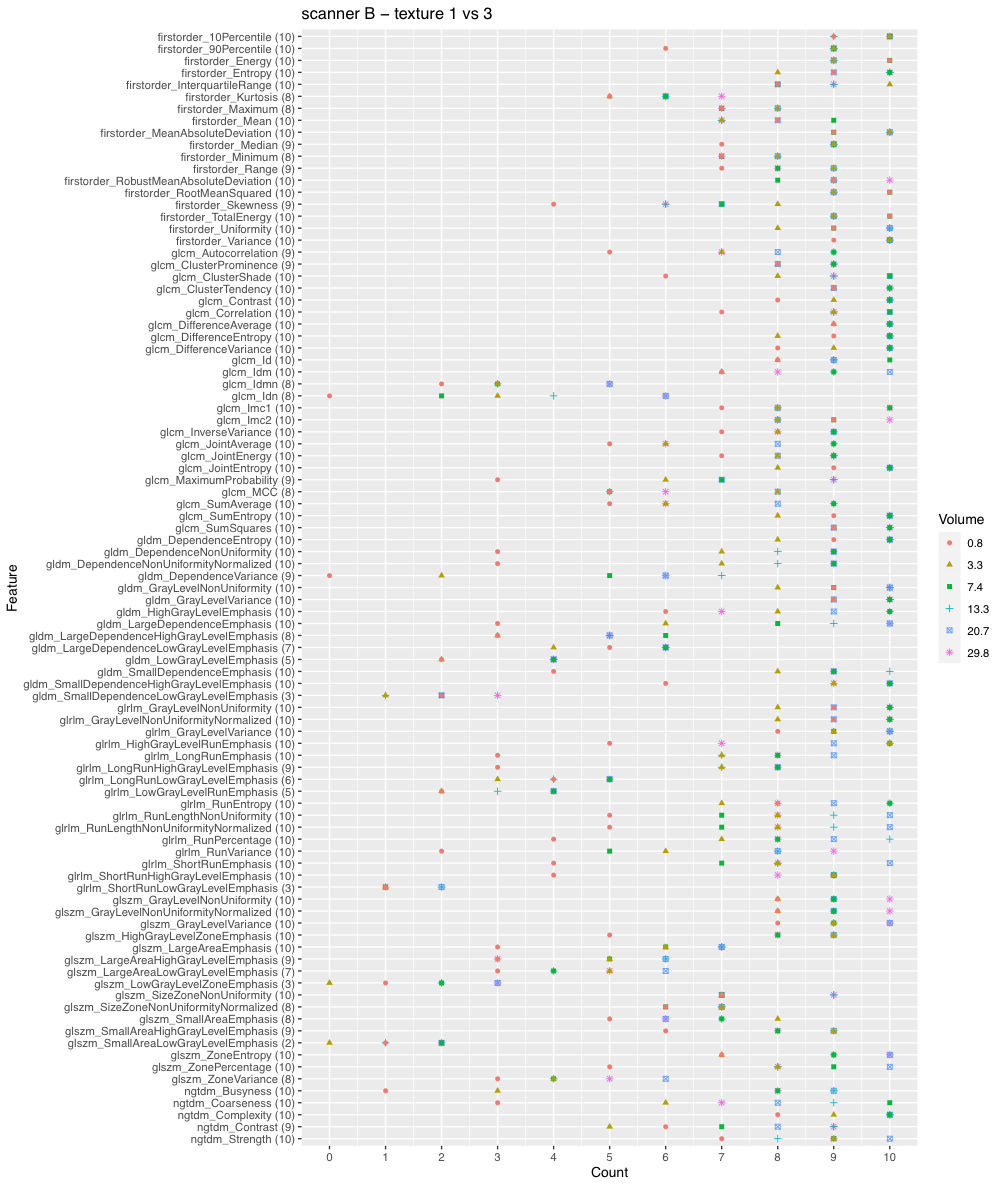
Figure 4. Discrimination of textures 1 and 3 on scanner B. The plot shows the number of times a feature is able to discriminate texture 1 and 3 if extracted from original and filtered images acquired on scanner B, as a function on the VOI size. Due to the selection of features with ICC>0.9, not all the features were extracted from all the available image types (10 in total: original + 9 filtered images), so the maximum count a feature could reach is indicated next to the feature name on y axis.
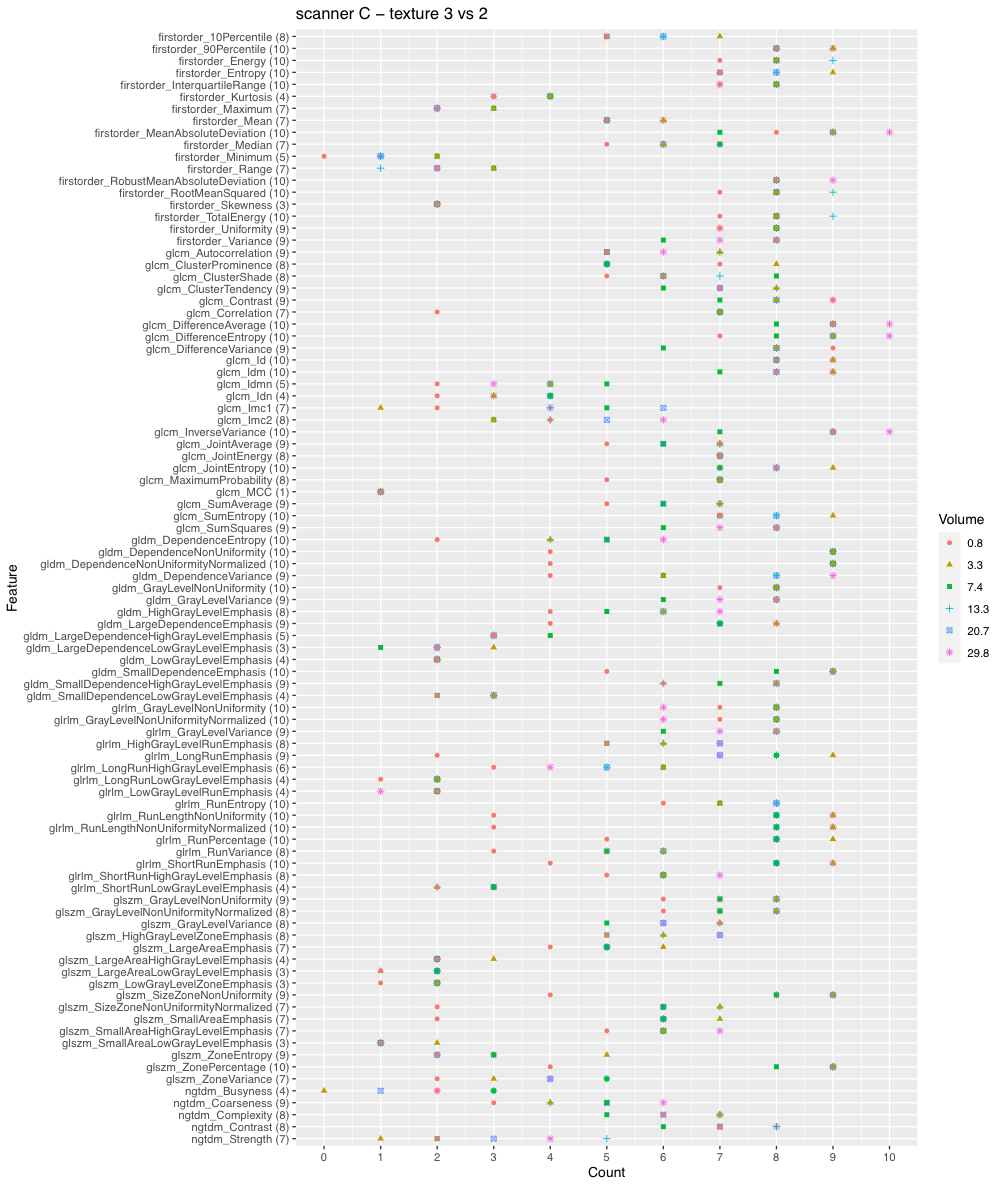
Figure 5. Discrimination of textures 3 and 2 on scanner C. The plot shows the number of times a feature is able to discriminate texture 3 and 2 if extracted from original and filtered images acquired on scanner C, as a function on the VOI size. Due to the selection of features with ICC>0.9, not all the features were extracted from all the available image types (10 in total: original + 9 filtered images), so the maximum count a feature could reach is indicated next to the feature name on y axis.