2836
Assessment of Higher-Order SVD Rank Reduction Denoising on Dynamic Hyperpolarized [13C]pyruvate Metabolic Imaging Data on Patients with Glioma1Department of Radiology and Biomedical Imaging, University of California, San Francisco, San Francisco, CA, United States, 2Department of Neurological Surgery, University of California, San Francisco, San Francisco, CA, United States, 3Department of Neurology, University of California, San Francisco, San Francisco, CA, United States, 4Department of Bioengineering and Therapeutic Science, University of California, San Francisco, San Francisco, CA, United States
Synopsis
Real-time monitoring of enzymatic conversion of [1-13C]pyruvate to [1-13C]lactate and [1-13C]bicarbonate in the brain can be performed using dynamic hyperpolarized 13C metabolic imaging. However, signal-to-noise ratios of bicarbonate are significantly lower than lactate and pyruvate, making it difficult to assess metabolic flux, particularly in lesions. Denoising techniques employing rank reduction via the multidimensional extension of singular value decomposition have recently been introduced for conventional MR images, diffusion-weighted images and HP-13C metabolic imaging. Here, we investigate the use of two higher-order singular value decomposition denoising techniques on dynamic hyperpolarized 13C metabolic images acquired from patients with glioma.
Introduction
Dynamic hyperpolarized (HP) 13C metabolic MRI allows for real-time measurements of brain metabolism and has recently been used to evaluate patients with glioma[1]. Following intravenous injection of HP [1-13C] pyruvate, pyruvate and its metabolic products, lactate and bicarbonate, can be dynamically imaged, enabling the quantification of apparent conversion rates for pyruvate to lactate (kPL) and bicarbonate (kPB). Previously, increased kPL and decreased kPB were observed in the viable tumor compared to normal-appearing white matter (NAWM) in patients with glioma[2]. These values may thus be used to help define tumor burden. However, due to the rapid HP magnetization decay, quantification of HP data is still challenged by a limited signal-to-noise ratio (SNR). SNR of bicarbonate is up to 4-fold lower than that of lactate and is typically lower in tumors due to metabolic reprogramming. Higher-order singular value decomposition (HOSVD) denoising methods provide an avenue for improved SNR after data acquisition. Such methods rely on the inherent sparsity in multidimensional data and can produce up to a 10-fold increase in SNR[3,4,5,6]. Tensor decomposition (TD)[3,4] methods treat the data as a single tensor for denoising. Alternatively, the GLHOSVD method[5] first groups similar data patches together and applies HOSVD denoising on these patches. The goal of this study was to evaluate the performances of TD and GLHOSVD denoising on dynamic HP-13C EPI data for assessing metabolism within the lesions of patients with glioma.Methods
MR Data Acquisition: All MR studies were performed using a 13C/1H (birdcage 13C transmit, 24 elements for 13C reception and 8 elements for 1H reception, Rapid Biomedical, Germany) head array. The anatomic and functional imaging scans are part of a standard-of-care clinical protocol[1]. The HP [1-13C]pyruvate was prepared and injected following pharmacist's approval[1]. The dynamic HP-13C scan began 5s after the end of injection using a frequency-specific multislice EPI sequence[7] (TR/TE=62.5ms/21.7ms, 8 slices, 20 timepoints, 3s temporal resolution, 3 frequencies, 1.5 cm isotropic spatial resolution) from 10 patients with glioma at various disease stages.Post-processing: Raw dynamic EPI data were coil combined and phase corrected[7,8]. ROIs for T2 lesion (T2L), non-enhancing and contrast-enhancing lesion (NEL, CEL), and NAWM were segmented on 3D FLAIR and T1-weighted images. ROIs were down-sampled to the spectral resolution of the 13C images by classifying voxels as NAWM, T2L, and CEL if a respective minimum overlap of 60%, 50%, and 30% with high-resolution ROIs was observed.
Noise simulations for patient data: Noise-added signals were simulated by adding Gaussian noises to acquired phased dynamic lactate data to match bicarbonate SNR.
Denoising: For TD denoising, the input tensor was size 16x16x8x20 (3 spatial and 1 temporal dimension). The rank was set to 12x14x8 in the spatial and 4 in the temporal dimension. For GLHOSVD denoising, parameters used to threshold singular values in the global and local stages where kglobal=0.4 and klocal=0.6.
Analysis: Apparent rate constants were calculated using kinetic modeling[11,12]. Voxels with kPL (similarly, kPB) errors larger than 50% of its estimated value were discarded. These kPL error masks were used to filter lactate signals while kPB error masks were used to filter bicarbonate signals.
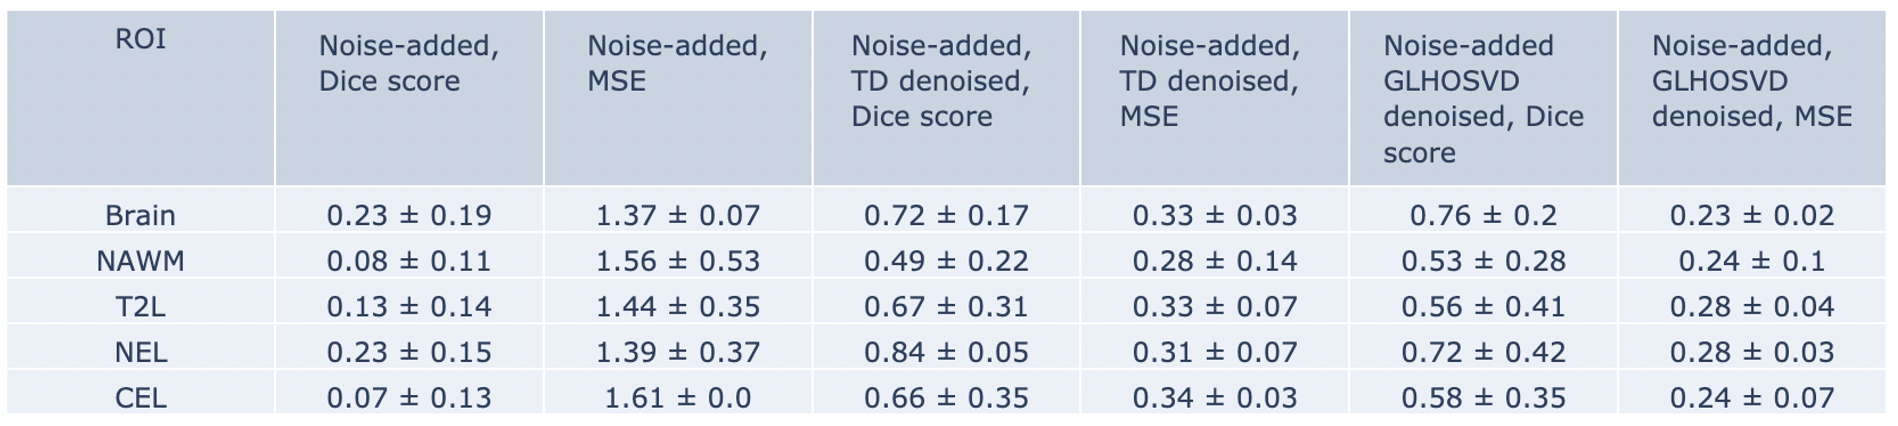
- Denoising Lactate Data with Simulated Noise: Simulated Gaussian noise was artificially introduced to the acquired lactate images. The data was then denoised and compared to the original acquired images. Dice scores comparing acquired data error masks and denoised error masks were calculated. The Dice similarity score between sets X and Y is $$\text{dice}(X,Y) = \frac{2 |X \cap Y|}{|X| + |Y|}.$$ Voxel-wise root mean-squared-errors (MSE) for denoised signals were calculated compared to the acquired signal.
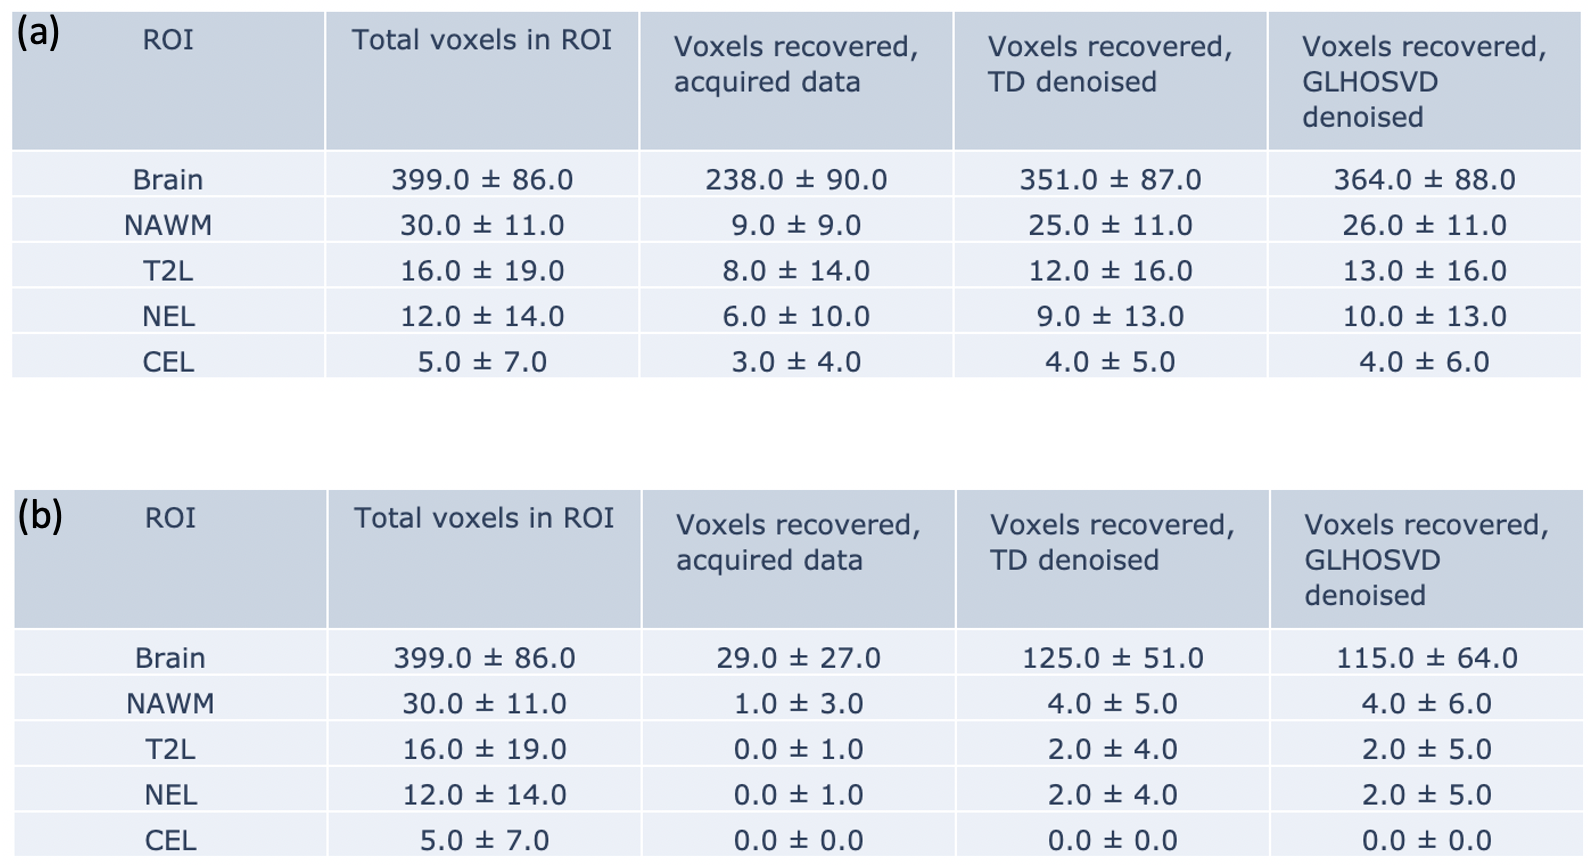
- Evaluation of Denoising on Patient Data: Denoising was applied to pyruvate, lactate, and bicarbonate data and the number of recovered voxels were calculated within ROIs.
Results
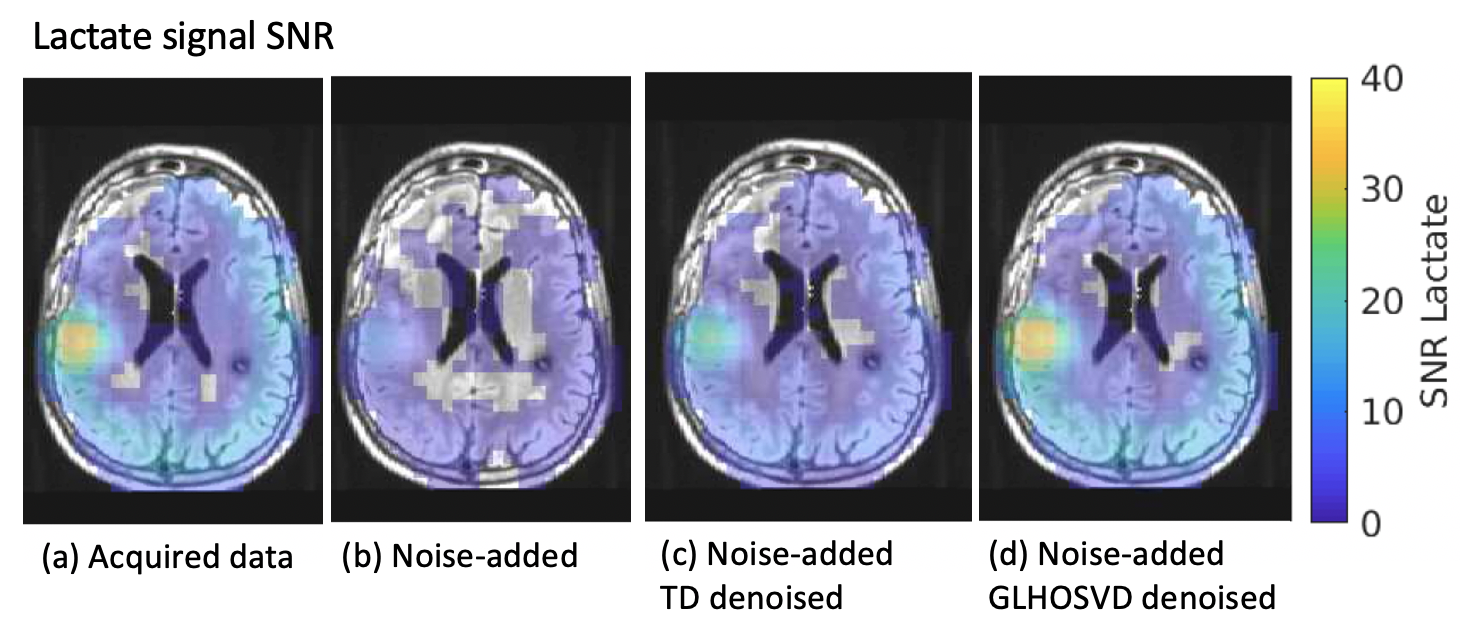
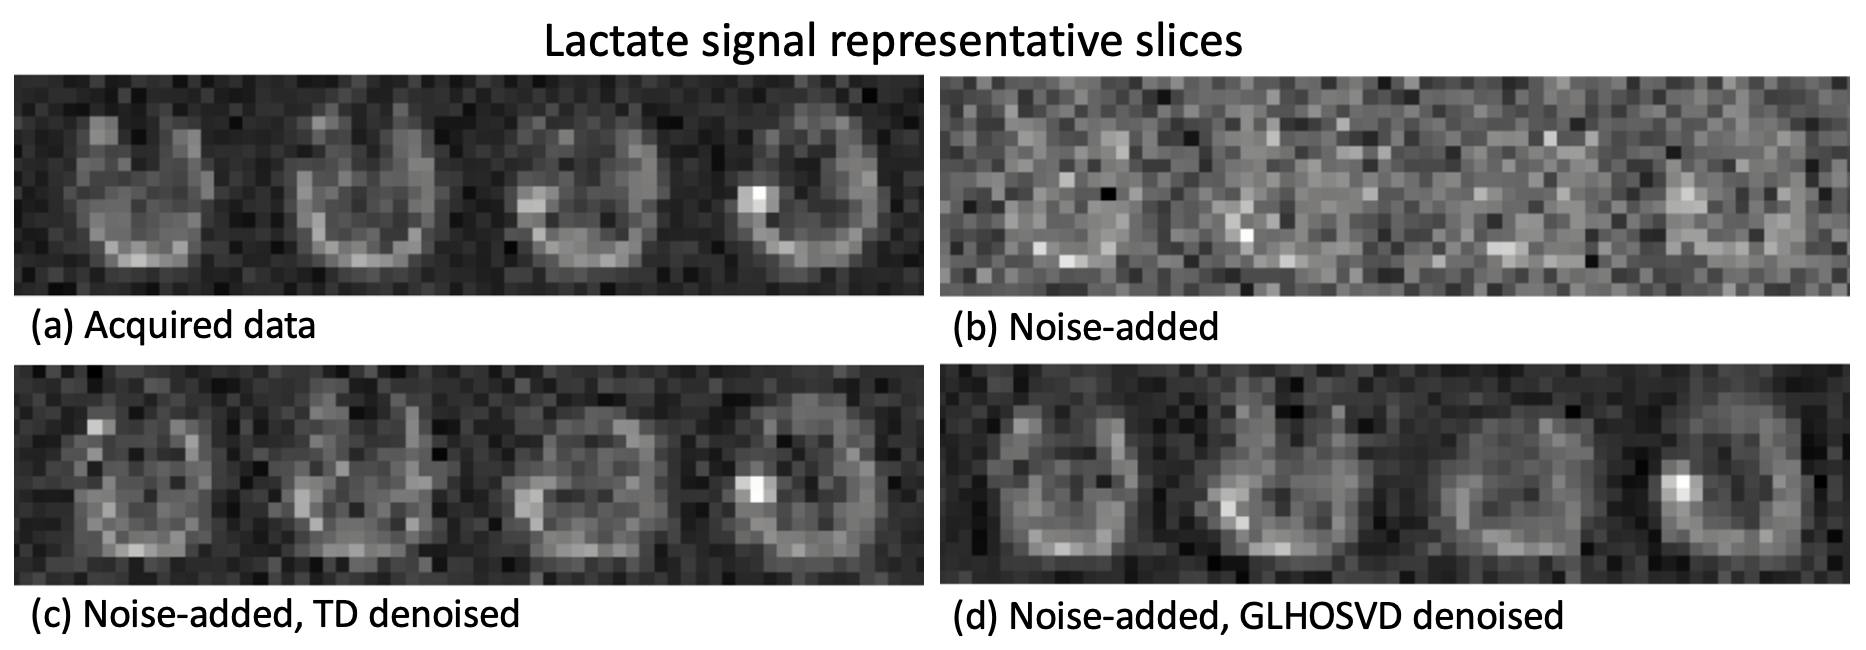
Averaged across 10 scans, the lactate apparent SNR (acquired data) was 13.53±5.88 (mean±std) and that for bicarbonate was 6.52±2.08. After adding Gaussian noises, the lactate SNR was reduced to 5.34±1.13. Following denoising, the apparent SNR was restored to 13.75±9.18 for TD and 14.3± 6.06 for GLHOSVD. An example SNR map for the lactate area-under-the curve signals is shown in Figure 1. While GLHOSVD denoising achieved higher SNR, visualized smoothing artifacts are present (Figure 2). At the expense of SNR, GLHOSVD klocal parameter may be lowered to reduce smoothing artifacts. The Dice score and MSE for denoised lactate images are summarized in Figure 3. GLHOSVD denoising is better able to recover the original acquired data and achieves lower MSE compared to TD denoising.In acquired patient data (no artificially-introduced noise), the number of voxels recovered within each ROI are shown in Figure 4 after denoising and applying error masks. Denoising increases the number of recovered bicarbonate voxels and enables quantification of kPB, where low bicarbonate signal was consistent with progressing tumor.
Discussion and Conclusions
Both denoising methods demonstrated great performance for improving the quantification of HP lactate and bicarbonate signals. The noise-added lactate data showed that GLHOSVD denoising was able to better recover the original acquired signal and produced higher SNRs compared to TD. In future studies, we aim to apply GLHOSVD denoising to HP-13C datasets from patients with glioma to improve quantification of differences in kPB and kPL values between NAWM and tumor prior to and following therapy.Acknowledgements
This project was supported by NIH T32 CA151022, P01 CA118816, R01 CA127612, P41EB013598, P50 CA097257, together with NICO and the Glioblastoma Precision Medicine Program.References
[1] Park, Ilwoo, et al. "Development of methods and feasibility of using hyperpolarized carbon‐13 imaging data for evaluating brain metabolism in patient studies." Magnetic resonance in medicine 80.3 (2018): 864-873.
[2] Autry, Adam, et al. “Initial experience: detection of aberrant HP-13C metabolism in patients with glioblastoma prior to resection.” ISMRM, 2020.
[3] Brender, Jeffrey R., et al. “PET by MRI: Glucose Imaging by 13C-MRS without Dynamic Nuclear Polarization by Noise Suppression through Tensor Decomposition Rank Reduction.” BioRxiv (2018): 265793.
[4] Chen, Hsin‐Yu, et al. "Tensor image enhancement and optimal multichannel receiver combination analyses for human hyperpolarized 13C MRSI." Magnetic Resonance in Medicine (2020).
[5] Zhang, Xinyuan, et al. “Denoise diffusion-weighted images using higher-order singular value decomposition.” Neuroimage 156 (2017): 128-145.
[6] Kim, Yaewon, et al. “Denoising of Hyperpolarized 13C MR Images Using Patch-based Tensor Singular Value Decomposition”, UCSF Department of Radiology Imaging Research Symposium, 2020.
[7] Gordon JW, Vigneron DB, and Larson PEZ. Development of a Symmetric Echo Planar Imaging Framework for Clinical Translation of Rapid Dynamic Hyperpolarized C Imaging. Magnetic Resonance in Medicine 2017, 77: 826–832.
[8] Autry, Adam, et al. Characterization of serial hyperpolarized 13C metabolic imaging in patients with glioma. 2020; NeuroImage: Clinical, 27, 102323.
[9] Zhu, Zihan, et al. "Coil combination methods for multi-channel hyperpolarized 13C imaging data from human studies." Journal of Magnetic Resonance 301 (2019): 73-79.
[10] Crane, Jason C., et al. "Hyperpolarized 13C MRI data acquisition and analysis in prostate and brain at University of California, San Francisco." NMR in Biomedicine (2020): e4280.
[11] Larson, Peder EZ, et al. "Investigation of analysis methods for hyperpolarized 13C‐pyruvate metabolic MRI in prostate cancer patients." NMR in Biomedicine 31.11 (2018): e3997.
[12] Mammoli, Daniele, et al. "Kinetic modeling of hyperpolarized carbon-13 pyruvate metabolism in the human brain." IEEE transactions on medical imaging 39.2 (2019): 320-327.
Figures