2835
ComBat Empirical Bayes Model Supersedes Naive Methods for Statistical Harmonization of Multi-Site 1H MR Spectroscopy
Lasya P Sreepada1,2, Sam H Jiang1, Huijun Vicky Liao1, Katherine M Breedlove1, Eduardo Coello1, and Alexander P Lin1
1Radiology, Center for Clinical Spectroscopy, Brigham and Women's Hospital and Harvard Medical School, Boston, MA, United States, 2Radiology, Center for Biomedical Image Computing and Analytics, Perelman School of Medicine, University of Pennsylvania, Philadelphia, PA, United States
1Radiology, Center for Clinical Spectroscopy, Brigham and Women's Hospital and Harvard Medical School, Boston, MA, United States, 2Radiology, Center for Biomedical Image Computing and Analytics, Perelman School of Medicine, University of Pennsylvania, Philadelphia, PA, United States
Synopsis
As medical imaging enters the information era, there is a rapidly increasing need for big data analytics. Robust pooling and harmonization of multi-site data across diverse cohorts is critical. We compare the performances of current basic methods with ComBat, an Empirical Bayes method that removes batch effects, in harmonizing 1H Brain MR Spectroscopy (MRS) of healthy controls from 4 sites. Basic harmonization did not bring metabolite means closer together and increased variance, while ComBat successfully removed significant site effects as determined by ANOVA and Levene's tests. These results may improve reproducibility and generalizability of MRS studies, especially in clinical space.
Introduction
MR Spectroscopy (MRS) is a non-invasive molecular imaging technique permitting advanced chemical analysis of tissue in vivo. In the past decade, MRS has seen rapid increase in application to the medical field and has demonstrated utility in diagnosing and characterizing clinical conditions. As radiology enters the information era and presents a growing need for big data analytics, robust pooling and harmonization of data across multiple sites and cohorts is critical.There are currently no gold-standard methods for MRS data harmonization in multicenter studies [1]. Metabolite ratios to total Creatine (tCr) [2], or linear scaling based on control scans acquired in humans or phantom solutions at each site [3] are frequently used to standardize data. These methods do not account for differences in creatine across cohorts or nonlinear effects such as aging, disease exposure, motion, and scanner parameters. We compare existing basic methods with an advanced statistical harmonization technique, ComBat, rooted in Empirical Bayesian theory[4] that accounts for such factors. This method was previously validated on large structural imaging datasets using machine learning [5]. We hypothesized that existing methods are ineffective whereas the advanced method will remove significant site effects.
Methods
Participants: Healthy athletic, male control subjects were recruited and consented under local IRB approval at four sites across the United States (Figure 1). Exclusion criteria included MR contraindications, substance abuse, and history of neurological disease, neuropsychological disorders, or head trauma.MRS Acquisition and Processing: This study was conducted using the Siemens MAGNETOM 3T Skyra Syngo, with a 32-channel head coil. Single-Voxel MRS data were acquired in the Posterior Cingulate Gyrus (PCG, 20x20x20mm; Figure 2a) using conventional PRESS with TE=30 ms, TR=2s, bandwidth=1.2 kHz, 1024 complex data points, water saturation, and 128 averaged acquisitions. Unsuppressed water spectra were also acquired for scaling reference. The protocol was identical across all sites.
Data were pre-processed using Suspect, an open-source Python library for MRS processing [6]. Frequency-, phase-, and/or eddy-current correction was performed as necessary prior to analysis using LCModel [7] (Figure 2b). Metabolite concentrations are in Institutional Units.
Post-processing: Metabolites for which Cramer-Rao Lower Bound (CRLB) was consistently greater than 20%, indicating unreliable data, were excluded. Remaining metabolites included Glu, Glu+Gln (Glx), GPC+PCh (tCho), GSH, mI, NAA+NAAG (tNAA), and Cr+PCr (tCr). For each scan, a T2 correction factor was calculated[8,9]. White matter (WM), grey matter (GM), and cerebrospinal fluid (CSF) partial volume fractions obtained by segmenting T1 MRI for each subject were used to calculate a correction factor (PVF) [8,9]. Both correction factors were applied prior to subsequent analysis.
Basic harmonization: An overall tCr mean, μtot, a corrected tCr mean for each site, μsite, and a scaling factor for each site, defined as μtot/μsite, were computed. tCr values for each site were harmonized by scaling by fsite, while metabolite/tCr ratios were harmonized by scaling by 1/fsite.
ComBat Harmonization: We used ComBat with Generalized Additive Model[5, 10] with Site, Age, and Full-Width Half-Maximum as covariates. Age was specified as a nonlinear effect. ComBat uses Empirical Bayes methods to estimate a prior distribution for each site that is later adjusted [4]. Performed using the neuroHarmonize[11] Python package.
Statistical Analysis: For basic harmonization, metabolite/tCr ratios were used, while ComBat was applied to absolute concentrations. The mean, median, and variance of metabolite concentrations before and after harmonization across sites were compared using one-way ANOVA, Kruskal-Wallis, and Levene’s Tests, respectively. Analyses were performed using Python 3.7.0 and R 3.6.1 in Jupyter Notebook.
Results
Basic harmonization is ineffective (Figure 3). There were no significant differences between harmonized and unharmonized metabolites with ANOVA, Kruskal-Wallis, and T-tests. Levene's test was significant for tNAA/tCr (p < 0.01, increased variance) and Glx/tCr (p < 0.05, increased variance).ComBat (Figure 4) harmonizes effectively. Almost all p-values show significance (p < 0.01) before harmonization, and none of them are significant after running ComBat (Figure 5). The ratios of maximum to minimum standard deviations among sites consistently decreased after harmonization, and notably are below 2, indicating comparable variances.
Discussion
Basic harmonization scales the data based on the mean of tCr and therefore is susceptible to bias as tCr may not be consistent across cohorts. It exaggerates data distributions and is ineffective in removing site differences. Whereas, ComBat estimates and removes site effects while accounting for covariates with nonlinear effects on metabolite concentrations. To our knowledge, this is the first time ComBat has been applied to spectroscopy data.These results may enable future research to increase sample size by pooling and harmonizing multi-site data, lending greater power and generalizability in MRS studies. In future studies, we will build machine learning classifiers to assess whether ComBat disallows data classification by Site. We will apply ComBat to other datasets for validation and extend the model to non-control subjects.
Conclusion
We demonstrated that ComBat, an advanced statistical technique rooted in Empirical Bayesian theory, outperforms basic methods for harmonizing MRS data. Standardizing methods for data harmonization promotes reproducibility and generalizability, potentially accelerating the translation of MRS to clinical research and practice.Acknowledgements
The authors would like to acknowledge Marcia Sahaya Louis of the Center for Clinical Spectroscopy at Brigham and Women's Hospital for her advice in formulating the concept and statistical tests in this abstract. We also thank Sribindu Sreepada, student at Sharon High School, MA, for her efforts in improving figure aesthetics.References
- Öz, G., Alger, J. R., Barker, P. B., Bartha, R., Bizzi, A., Boesch, C., ... & Dydak, U. (2014). Clinical proton MR spectroscopy in central nervous system disorders. Radiology, 270(3), 658-679.
- Bhogal, AA, Schür, RR, Houtepen, LC, et al. 1H–MRS processing parameters affect metabolite quantification: The urgent need for uniform and transparent standardization. NMR in Biomedicine. 2017; 30:e3804. https://doi.org/10.1002/nbm.3804
- L. G. Nyul, J. K. Udupa and Xuan Zhang, "New variants of a method of MRI scale standardization," in IEEE Transactions on Medical Imaging, vol. 19, no. 2, pp. 143-150, Feb. 2000, doi: 10.1109/42.836373.
- W. Evan Johnson and Cheng Li, Adjusting batch effects in microarray expression data using empirical Bayes methods. Biostatistics, 8(1):118-127, 2007. https://doi.org/10.1093/biostatistics/kxj037.
- Pomponio, R., Shou, H., Davatzikos, C., et al., (2019). "Harmonization of large MRI datasets for the analysis of brain imaging patterns throughout the lifespan." Neuroimage 208. https://doi.org/10.1016/j.neuroimage.2019.116450.
- Rowland, B.C., Sreepada, L.P., Jiang, S.H., & Lin, A.P. (2017). OpenMRSLab: An open‐source software repository for magnetic resonance spectroscopy data analysis tools.
- Provencher, S. (2020) LCModel and LCMgui User’s Manual. http://s-provencher.com/pub/LCModel/manual/manual.pdf
- Ernst T, Kreis R, Ross BD. Absolute Quantitation of Water and Metabolites in the Human Brain. I. Compartments and Water. J Magn Reson Ser B. 1993;102:1-8.
- Kreis R, Ernst T, Ross BD. Absolute Quantitation of Water and Metabolites in the Human Brain. II. Metabolite Concentrations. J Magn Reson Ser B. 1993;102:9-19.
- Fortin, J. P., N. Cullen, Y. I. Sheline, W. D. Taylor, I. Aselcioglu, P. A. Cook, P. Adams, C. Cooper, M. Fava, P. J. McGrath, M. McInnis, M. L. Phillips, M. H. Trivedi, M. M. Weissman and R. T. Shinohara (2017). "Harmonization of cortical thickness measurements across scanners and sites." Neuroimage 167: 104-120. https://doi.org/10.1016/j.neuroimage.2017.11.024
- Pomponio, R., neuroHarmonize, (2019), GitHub Repository, https://github.com/rpomponio/neuroHarmonize
Figures
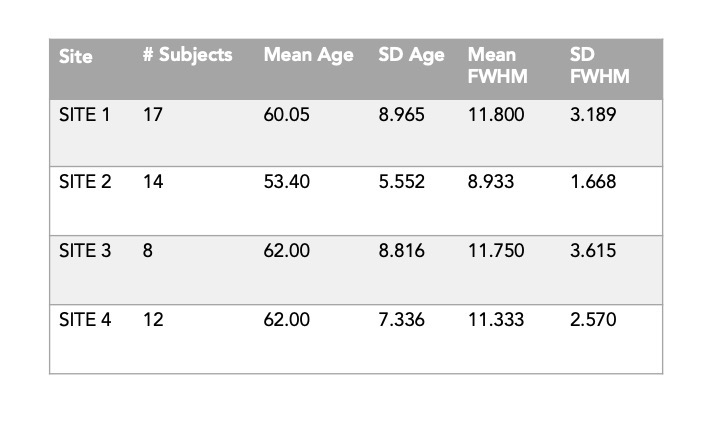
Table of data characteristics across the 4 sites. All sites recruited athletic male controls with similar ages. SITE 2 has slightly younger participants, but there is greater variance in ages within SITEs 1, 3, 4. The Full Width Half Max (linewidth) of the spectra from each site are comparable, with only SITE 2 showing slightly lower FWHM.
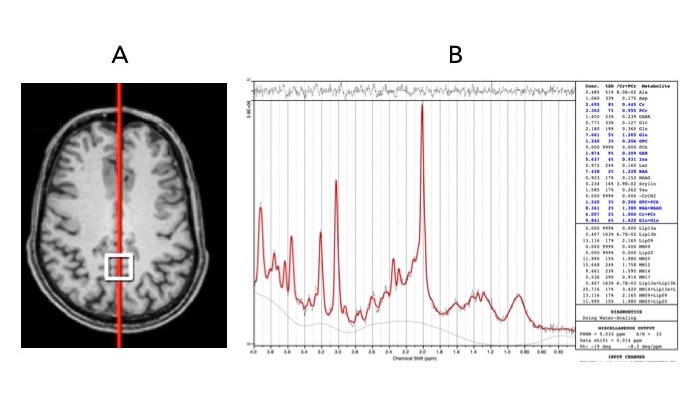
(A) Voxel placement of PCG within the brain (B) LCModel output showing the processed spectrum in one subject at SITE 1. The selected scan passed all the manual QA measures and had an FWHM of 8 after pre-processing, the lowest in our dataset.
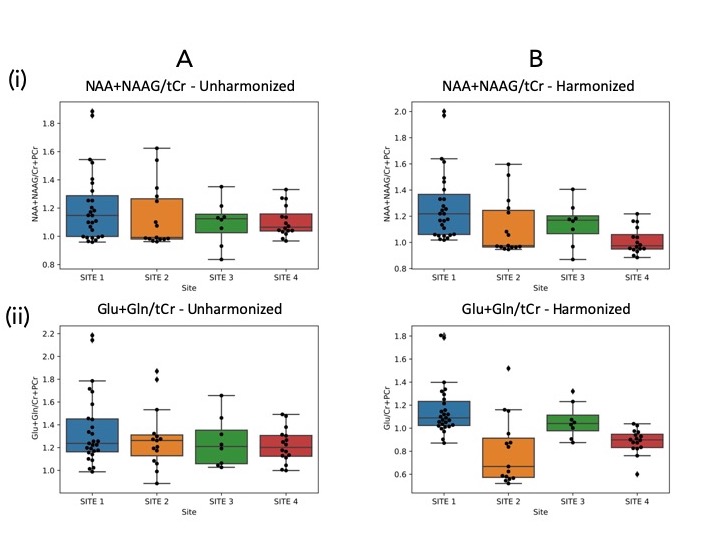
Basic Harmonization: Box plots illustrating the data distributions (A) before harmonization and (B) after harmonization in all 4 sites, for (i) tNAA/tCr (ii) Glx/tCr.
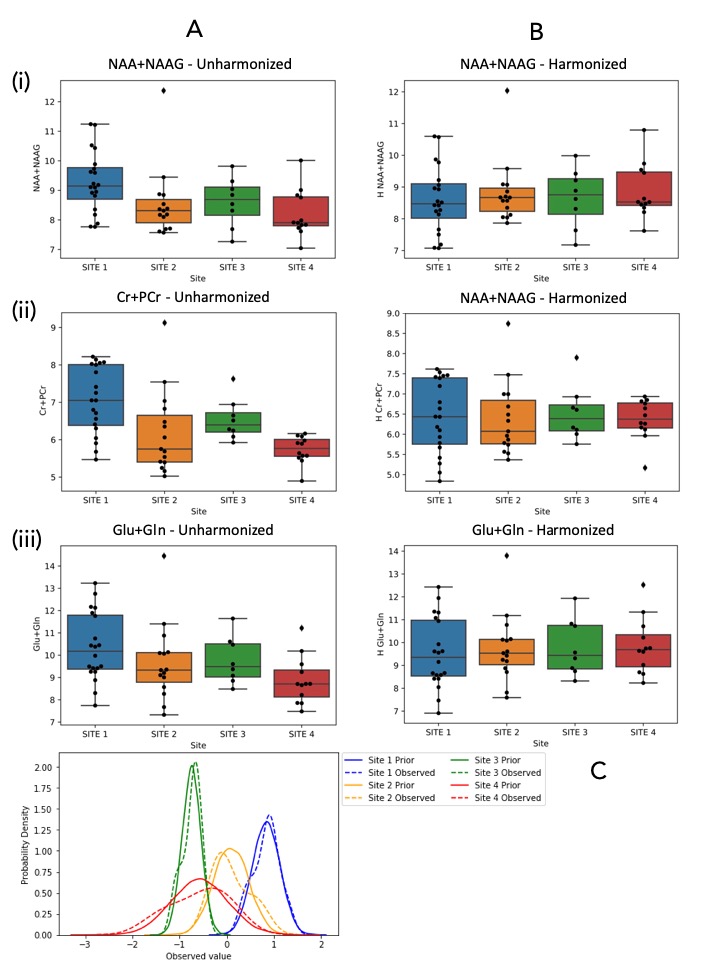
ComBat Harmonization: Box plots illustrating the means and significance with * or p-values (A) before harmonization and (B) after harmonization in all 4 sites, for (i) tNAA (ii) tCr (iii) Glx; (C) Visualization of Site effects that are removed by ComBat.
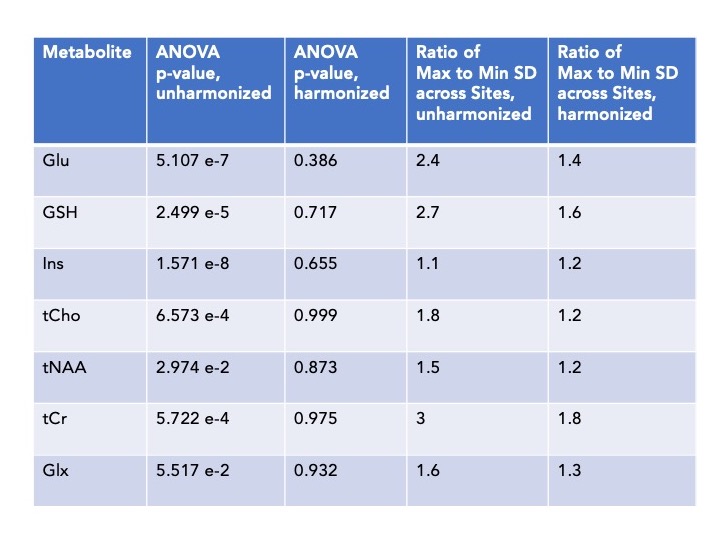
Table of statistical results from ANOVA and analysis of standard deviations before and after ComBat harmonization.