2832
Linear-combination modeling of GABA-edited MEGA-PRESS at 3T: Evaluating different modeling strategies
Helge Jörn Zöllner1,2, Sofie Tapper1,2, Steve C. N. Hui1,2, Peter B. Barker1,2, Richard A. E. Edden1,2, and Georg Oeltzschner1,2
1Russell H. Morgan Department of Radiology and Radiological Science, The Johns Hopkins University School of Medicine, Baltimore, MD, United States, 2F. M. Kirby Research Center for Functional Brain Imaging, Kennedy Krieger Institute, Baltimore, MD, United States
1Russell H. Morgan Department of Radiology and Radiological Science, The Johns Hopkins University School of Medicine, Baltimore, MD, United States, 2F. M. Kirby Research Center for Functional Brain Imaging, Kennedy Krieger Institute, Baltimore, MD, United States
Synopsis
Recent consensus states that linear-combination modeling (LCM) is the preferred method for modeling GABA-edited spectra. However, there is little peer-reviewed literature investigating how this should be performed. Here, we compare various modeling strategies for GABA-edited spectra, with different approaches to macromolecular signal parametrization, baseline stiffness, and fitting range. Variance of GABA+/tCr estimates decreased when prior knowledge was maximized, i.e., when a full fit range was used with a dedicated co-edited MM basis function. These new modeling strategies have been implemented in the MATLAB-based open-source MRS analysis toolbox Osprey (github.com/schorschinho/osprey).
Introduction
J-difference-edited MRS is commonly used to study the inhibitory neurotransmitter gamma-aminobutyric acid (GABA)1. The edited 3-ppm signal contains co-edited signals from macromolecules (MM) and homocarnosine2, and is hence referred to as GABA+. Linear-combination modeling (LCM), which uses metabolite basis spectra to maximize prior knowledge to constrain the model solution, has recently been recommended as the consensus approach for modeling the difference spectrum1. However, there have been few detailed comparisons of different modeling strategies to date.Here, we compare a range of strategies for modeling GABA-edited spectra, including different approaches to address co-edited MM signals, and effects of different fit ranges and baseline spline stiffness. A large, publicly available GABA-edited MRS dataset was used to evaluate the performance of the modeling strategies with the open-source package ‘Osprey’3.
Methods
62 MEGA-PRESS spectra from a recent multi-site study4 were included (Philips 3T scanners; TR/TE = 2000/68 ms; 2 kHz spectral width; 2048 samples; 27-ml cubic voxel volume in medial parietal lobe; including water reference data).All spectra were analyzed using Osprey3. Raw data were coil-combined and eddy-current-corrected based on the water reference. Individual averages were aligned using robust spectral registration5. Averaged edit-ON and edit-OFF spectra were aligned by minimizing the water signal in the difference spectrum.
Osprey’s default basis set (including 17 metabolites) was used for modeling, generated with localized 2D density-matrix simulations. MM0.93 and co-edited 3-ppm signals from macromolecules (MM3co) were accounted for by Gaussian basis functions (MM0.93: 3-proton signal; chemical shift 0.915 ppm; FWHM 11 Hz; MM3co: 2-proton signal; chemical shift 3 ppm; FWHM 14 Hz).
6 models were introduced to fit the 3-ppm signal (Figure 1A):
- GABAhard – composite GABA+ basis function (i.e. GABA and MM3co basis functions added in a fixed 1:1 ratio)
- GABAsoft – a soft constraint is applied to the GABA and MM3co amplitudes during optimization (1:1 ratio)
- Gaussfixed – MM3co is modeled as a separate basis function with fixed FWHM (14 Hz)
- Gaussfree – Similar to Gaussfixed, but an additional model parameter allows the FWHM to change during optimization
- MM09hard – composite MM0.93 + MM3co basis function (i.e. MM0.93 and MM3co basis functions added in a fixed 3:2 ratio)
- MM09soft – a soft constraint is applied to the MM0.93 and MM3co amplitudes during optimization (3:2 ratio)
Combining the various MM, baseline, and fit range approaches gave 51 different modeling strategies (Figure 1B). Mean modeling results were assessed, as well as GABA+:tCr (total creatine) ratio estimates.
Results
All 62 spectra were successfully quantified. Distinct modeling patterns are apparent in the mean fits (Figure 2):Substantial residuals around the edited 3 ppm signal occur for all modeling strategies if no MM3co model is included (grey model), accompanied by increased signal attribution to the baseline. For the reduced and intermediate fit range, mean MM3co models are consistent with each other, but show small differences for the full fit range. Notable baseline contributions appear between 1.0 and 2.7 ppm, and are more pronounced for smaller knot spacings.
GABA+/tCr distributions agree well across all strategies for all MM3co models, except when no MM3co model (Figure 3A) is used. These two models show systematically lower estimates. Figure 3B provides key insights:
- Increasing prior knowledge and degrees of model freedom (including any MM3co model) decreases CVs
- Increasing prior knowledge (increasing the fit range) decreases CVs
- High baseline flexibility is only beneficial for maximal prior knowledge (full fit range & MM3co model)
- Low baseline flexibility is only beneficial for the reduced fit range.
Discussion
While consensus recommends adapting LCM to quantify GABA-edited spectra, specific details of this practice remain unclear. Here, we present an assessment of potential modeling strategies.Results indicate a high level of agreement between all MM3co models, while not using any MM3co model leads to higher CVs and high residuals. Maximizing prior knowledge, while maintaining a higher degree of freedom for the model, decreases CVs.
Using the full fit range with a high baseline flexibility resulted in the lowest CVs, suggesting that the GABA-edited spectrum contains unidentified MM background components that are saturated or co-edited by the 1.9 ppm editing pulse. Further improvement may be achieved by including a measured MM baseline or a more complete set of basis functions e.g., including homocarnosine.
While reduced residuals and low CVs may be seen as an indicator for stable modeling, further validation of the different modeling strategies is needed, e.g. by comparing the GABA+ estimate from each model to the outcome of Gannet or simulated ground truth spectra. The various MM3co models will also be assessed for their potential to separate pure GABA from the MM3co model by comparison with macromolecule-suppressed MEGA-PRESS spectra.
Conclusion
We propose various modeling strategies to appropriately quantify GABA-edited spectra using LCM. It is recommended to include a dedicated basis function to account for co-edited 3 ppm signals.Acknowledgements
This work has been supported by NIH grants P41EB015909, R01EB016089, R01EB023963, R21AG060245, and K99AG062230.References
- Choi I-Y, Andronesi OC, Barker P, et al. Spectral editing in 1H magnetic resonance spectroscopy: Experts’ consensus recommendations. NMR Biomed. n/a(n/a):e4411. doi:https://doi.org/10.1002/nbm.4411
- Henry PG, Dautry C, Hantraye P, Bloch G. Brain gaba editing without macromolecule contamination. Magn Reson Med. 2001;45(3):517–520. doi:10.1002/1522-2594(200103)45:3<517::AID-MRM1068>3.0.CO;2-6
- Oeltzschner G, Zöllner HJ, Hui SCN, et al. Osprey: Open-source processing, reconstruction & estimation of magnetic resonance spectroscopy data. J Neurosci Methods. 2020;343:108827. doi:10.1016/j.jneumeth.2020.108827
- Mikkelsen M, Barker PB, Bhattacharyya PK, et al. Big GABA: Edited MR spectroscopy at 24 research sites. NeuroImage. 2017;159:32–45. doi:10.1016/j.neuroimage.2017.07.021
- Mikkelsen M, Tapper S, Near J, Mostofsky SH, Puts NAJ, Edden RAE. Correcting frequency and phase offsets in MRS data using robust spectral registration. NMR Biomed. Published online July 2020:e4368. doi:10.1002/nbm.4368
- Edden RAE, Puts NAJ, Harris AD, Barker PB, Evans CJ. Gannet: A batch-processing tool for the quantitative analysis of gamma-aminobutyric acid–edited MR spectroscopy spectra. J Magn Reson Imaging JMRI. 2014;40(6):1445-1452.
- Provencher S. LCModel & LCMgui User’s Manual. LCModel & LCMgui User’s Manual. Published 2020. Accessed July 15, 2020. http://s-provencher.com/pub/LCModel/manual/manual.pdf
Figures
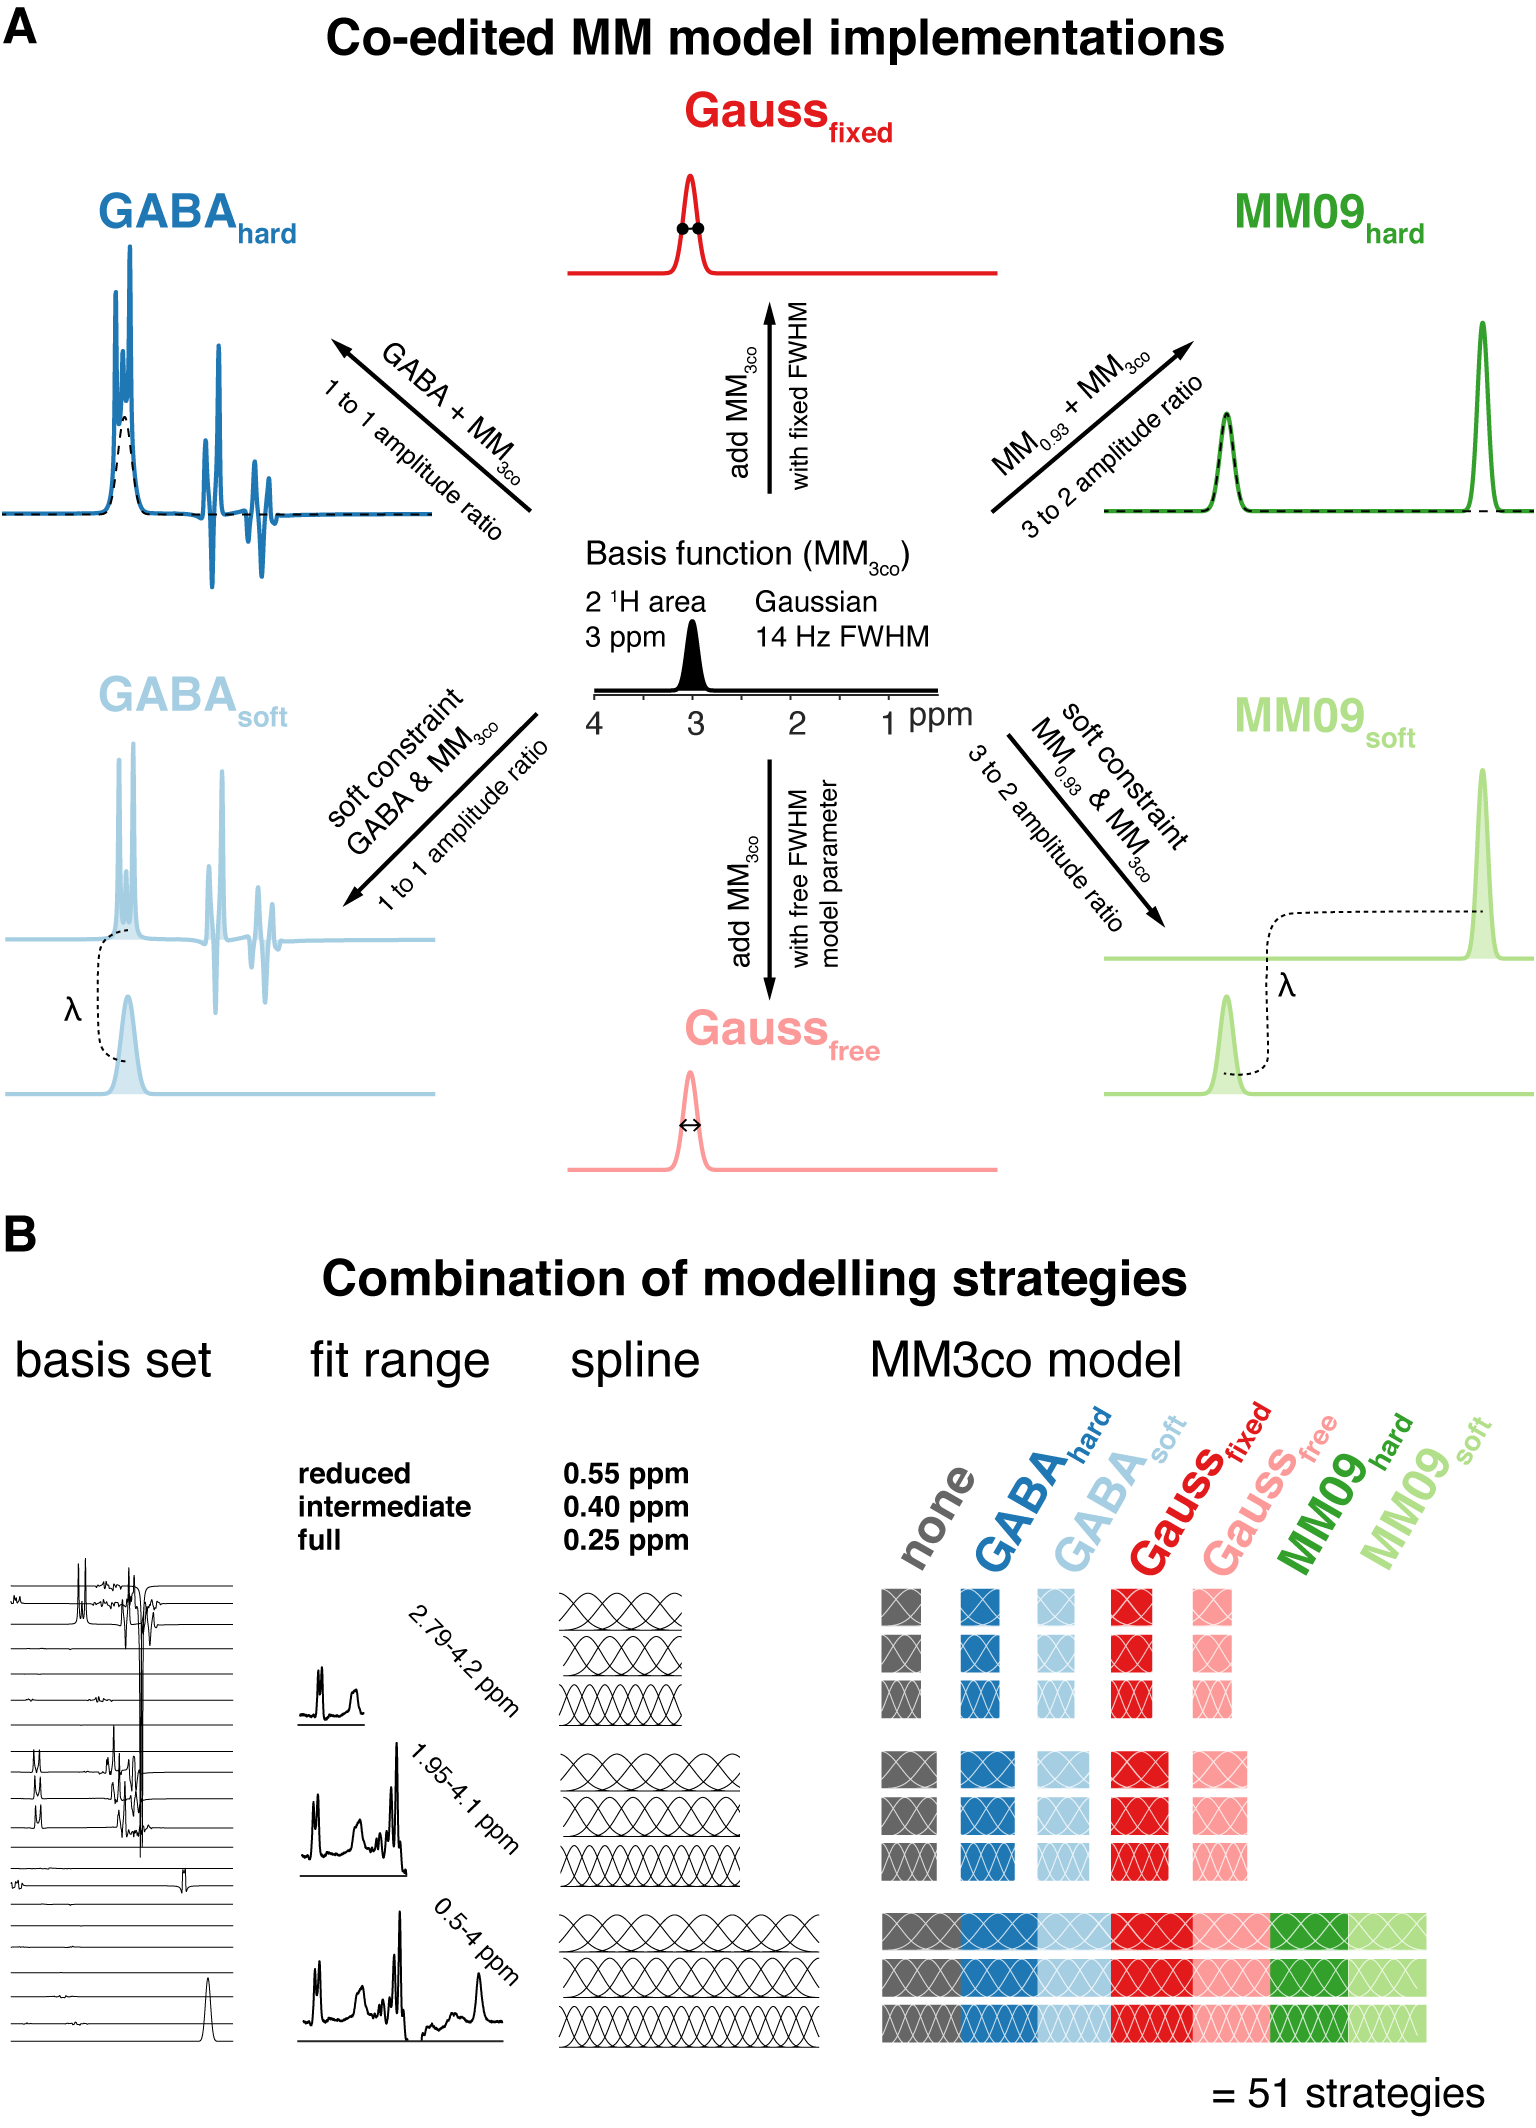
A) Co-edited MM3co model implementations – Overview of the six model implementations based on the 3 ppm co-edited MM basis function MM3co (B) Combinations of modeling strategies – Overview of the possible combinations of fit range, spline knot spacing ,and MM3co model.
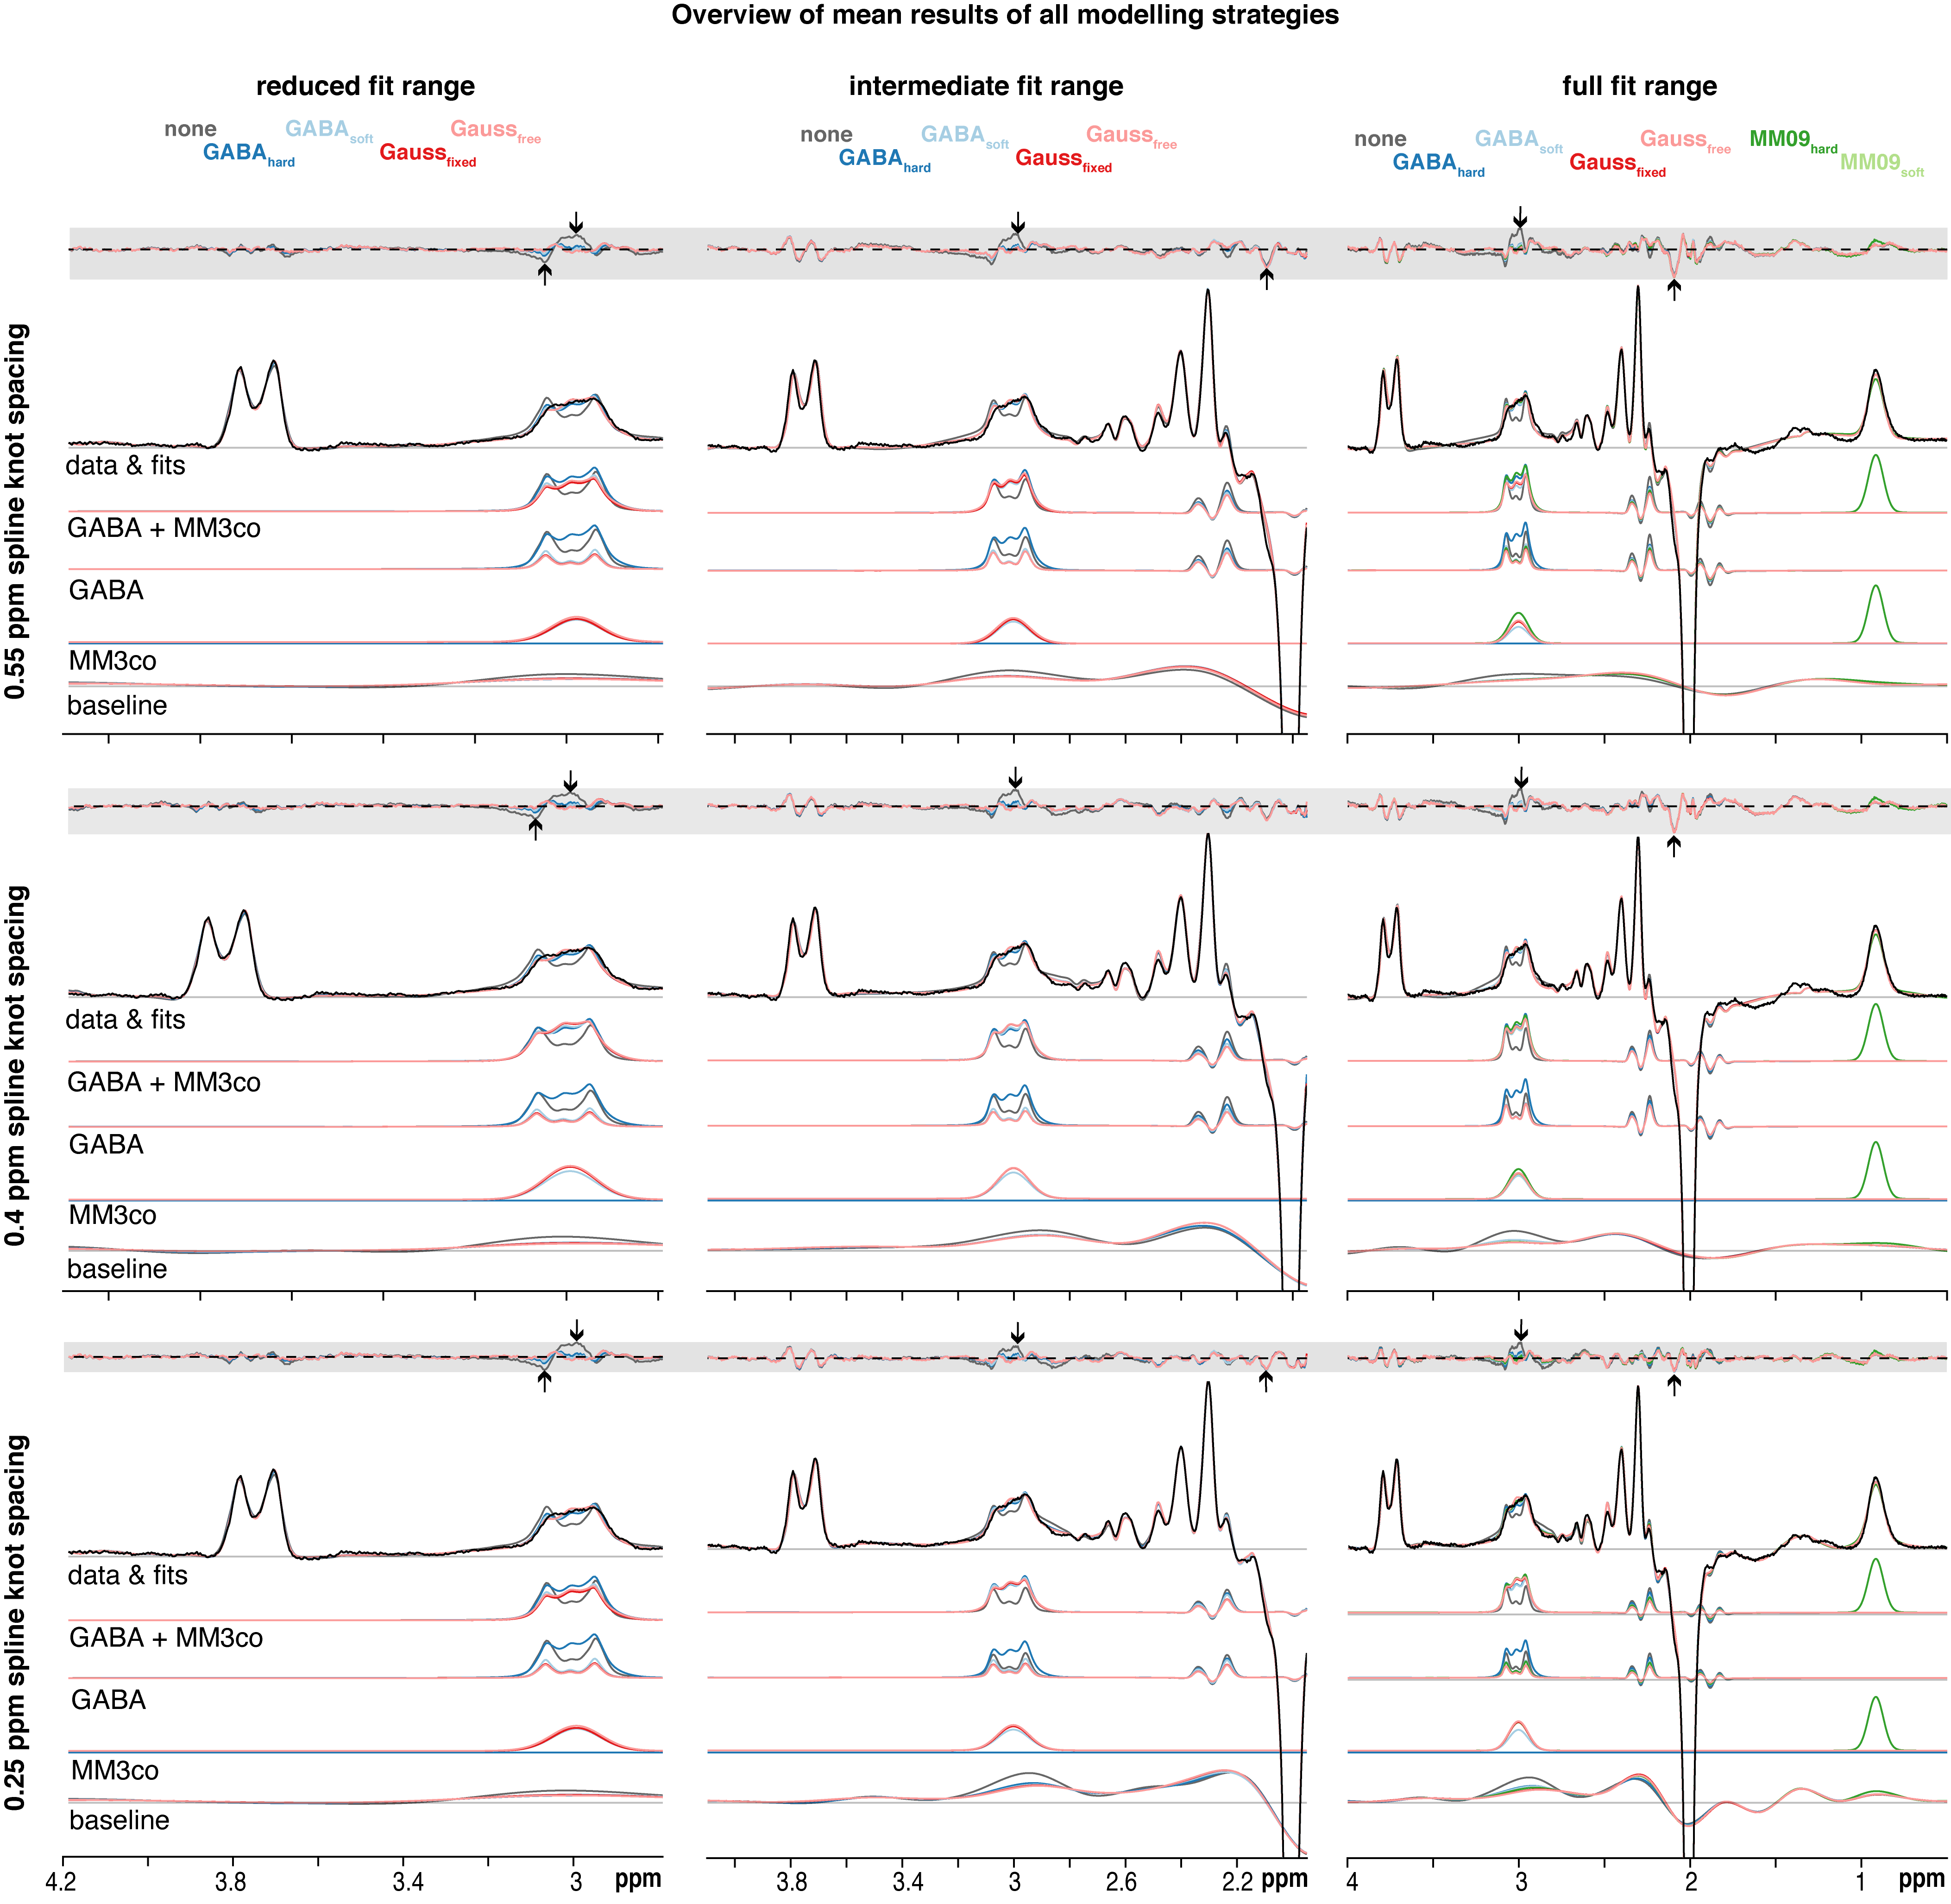
Visual overview of the mean residual, fits, and data of the different modeling strategies (color-coded). The mean estimates of GABA + MM3co, GABA, MM3co, and the baseline are also depicted. Each column contains one fit range (reduced, intermediate, full) and each row contains one spline knot spacing (0.55, 0.4, 0.25). Maxima and minima of each fit ranges’ residual are marked by the arrow, while the maximum and minimum across all fit ranges are visualized by the grey ribbon.
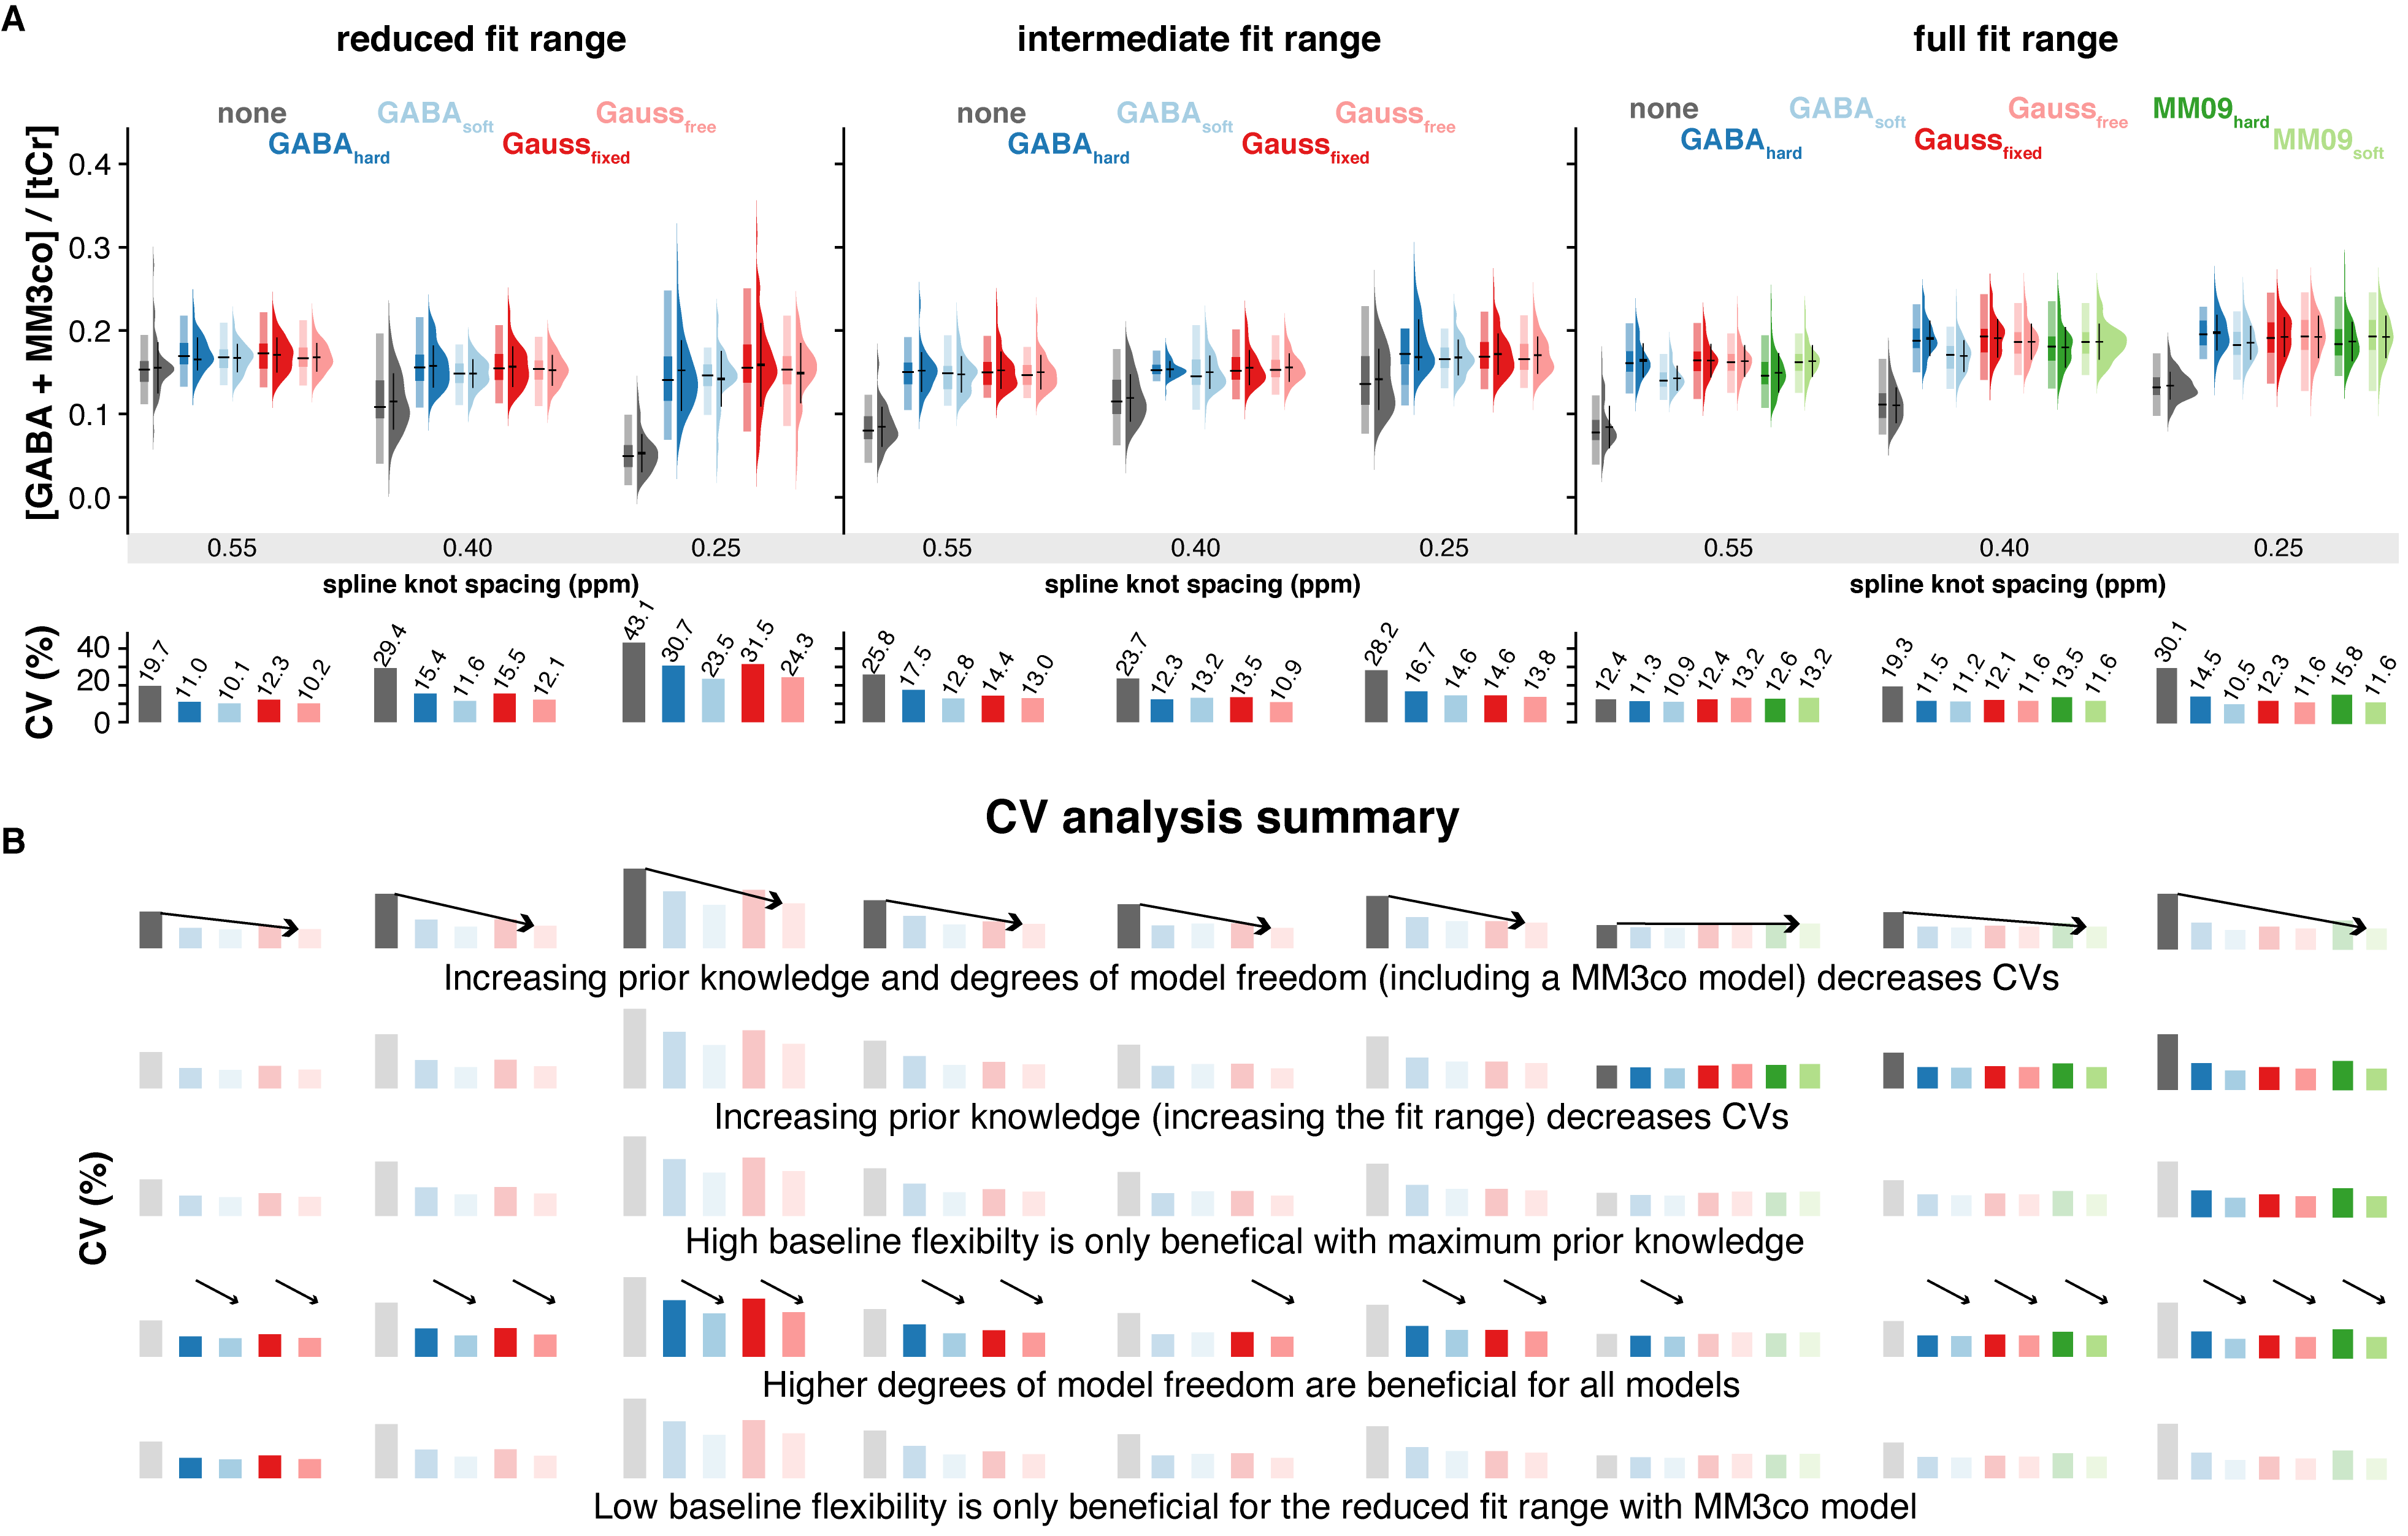
(A) Distribution of the GABA+/tCr. Boxplot, smoothed distribution, and mean +- SD for all MM3co models (color-coded) and knot spacings. The coefficient of variation (SD/mean x 100) is depicted in the second row. (B) Summary of the CV analysis with the five key findings.