2831
Reproducibility of Semi-LASER Localized Correlated Spectroscopic Imaging Using Concentric Ring Echo-Planar Trajectories1Radiological Sciences, UCLA Geffen School of Medicine, Los Angeles, CA, United States, 2School of Health Sciences, Purdue University, West Lafayette, IN, United States, 3UCLA School of Nursing, Los Angeles, CA, United States
Synopsis
Five-dimensional correlated spectroscopic imaging using concentric ring trajectories (5D COSI-CONCEPT) has been implemented. Since the maximum slew rates required for the concentric ring trajectories are lower than those for Cartesian echo-planar spectroscopic imaging for a given spectral bandwidth and spatial resolution, the eddy current issues are less challenging. The acquired 5D COSI-CONCEPT data was regridded along kx-ky and the accelerated kz-t1 data was reconstructed using group sparsity. Reproducibility of the sequence was evaluated in a brain phantom using 3T Prisma and Skyra MRI scanners. Pilot findings showed excellent coefficients of variance and intra-class correlation coefficients for all the six metabolites.
Introduction
Spectral overlap is one of the major concerns with proton (1H) magnetic resonance spectroscopy (MRS) even with 3T MRI scanners (1-2). As an alternative to spectral editing techniques (1,3,4) in which only one J-coupled metabolite can be edited in a single recording, localized single-voxel based 2D spectroscopic techniques and the multi-dimensional variants can detect J-coupled metabolites less ambiguously and have been successfully implemented with 3T and 7T MRI scanners (5-11). Rapidly changing gradients in Cartesian echo-planar spectroscopic imaging sequences notoriously induce eddy currents that create time-dependent magnetic field inhomogeneities which distort the spectra. Furuyama et al. implemented 1H spectroscopic imaging using concentrically circular echo-planar trajectories (SI-CONCEPT) (12), which has the advantage of low gradient slew rates. Emir et al. and Bogner et al. have implemented this concentric-ring based SI on 7T and 3T MRI scanners (2,13-15). During the past three decades, several researchers have reported test-retest reliability of metabolite detection and quantitation using single voxel localized spectroscopy as well as MR Spectroscopic Imaging (16-20). Here, we have implemented a novel five-dimensional (5D) correlated spectroscopic imaging using concentrically circular echo-planar trajectories (COSI-CONCEPT) on two different Siemens 3T MRI scanners (Prisma and Skyra) and evaluated reproducibility of the 5D COSI-CONCEPT using a brain phantom scanned on different days.Materials and Methods
Fig.1 shows the schematic diagram of the 5D COSI-CONCEPT sequence with semi-LASER localization containing a slice-selective 90° excitation and two adiabatic full passage refocusing 180° pairs. The t1 increment was added immediately before a final 90° pulse for coherence transfer (5-7). Concurrent Gx and Gy sinusoidal gradients were used for encoding different circular k-space rings, while non-uniform sampling (NUS) was applied along the 3rd spatial and 2nd spectral dimensions (kz-t1). An acceleration factor of 4 was applied to acquire 5D COSI-CONCEPT data from a brain phantom containing metabolites at physiological concentrations, using TE = 33.4 ms, TR = 1.5 s, matrix size = 16×16×8, field-of-view = 240×240×120 mm3, individual voxel size of 1.5×1.5×1.5 cm3, 64 t1 increments with Δt1 = 800 μs, and 512 t2 points with a spectral width of 1250 Hz along both F2 and F1. Total scan time was 25.6 minutes. The undersampled kz-t1 plane was reconstructed with a compressed sensing (CS) algorithm for Group Sparse l1-minimization (9). Global water suppression was performed using a WET module (21) preceding the first excitation pulse. A separate non-water-suppressed data set was collected as a reference and used to correct for eddy current-induced distortions using Klose’s method (22). The non-water-suppressed data was also used to determine the phase offsets in a phased-array coil for proper coil combination. Acquired 5D COSI-CONCEPT data were extracted, reconstructed and post-processed with a library of custom MATLAB-based programs (10, 12).Results
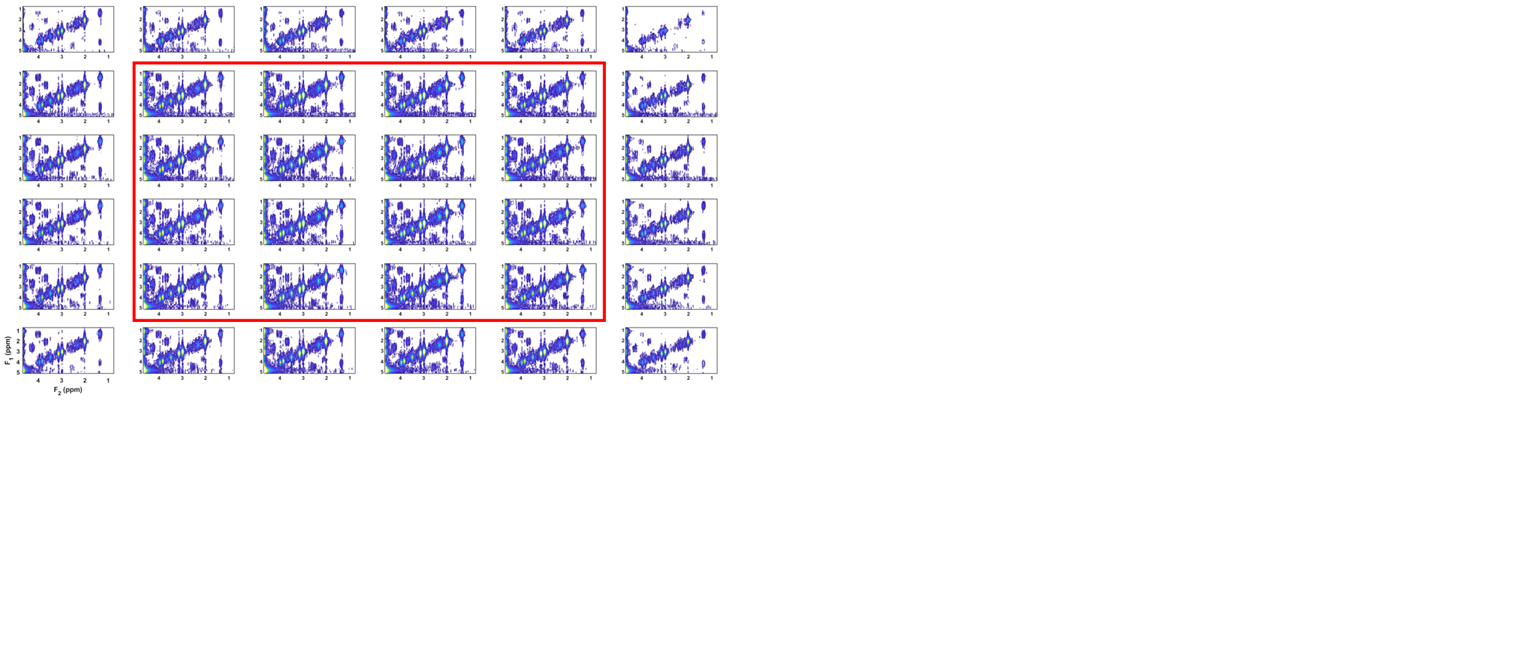
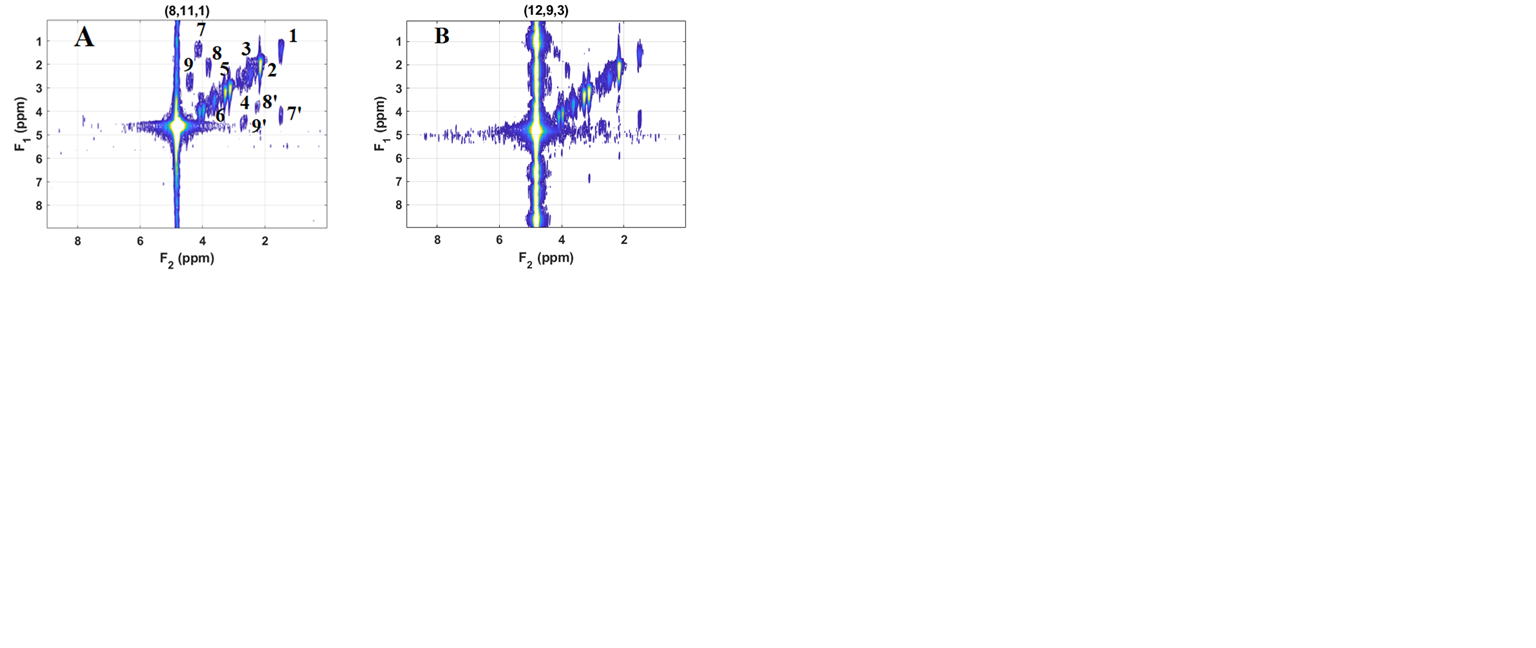
Figure 2 shows the volume-of-interest (VOI) localized by the semi-LASER module in 3 different planes (axial, sagittal and coronal). Multi-voxel 2D COSY spectra recorded using the 5D COSI-CONCEPT sequence on the 3T Prisma MRI scanner are shown in Fig.3. Shown in Fig.4 are 2D COSY spectra (3.4ml) extracted from the 5D COSI-CONCEPT data acquired using the A) Prisma and B) Skyra. Peak volumes of six metabolites from 2D COSY spectra were averaged across 16 voxels in each measurement over 13 different days. Coefficients of variance (CV’s) of ratios of the diagonal peaks (/Cr) of NAA, Ch, Glu, mI, and Lac were less than 10% and the 2D cross peak ratios (/Cr) ranged between 10 – 20% over 13 measurements using the Prisma scanner. Similar values were recorded using the Skyra scanner acquired over 7 days. However, there were slightly increased CV’s for 1-2 peaks while using the Skyra MRI scanner, probably due to the wider bore (70cm) and other hardware related changes. Table 1A shows the intraclass correlation coefficients (ICC) over 13 phantom data acquired using the 3T Prisma scanner and 7 phantom data acquired using the 3T Skyra scanner (p<0.0001). Table 1B shows the interday CV’s for both scanners, where the Prisma has lower CV’s although the number of measurements are fewer for the Skyra.Discussion
Good quality 2D COSY spectra were recordable using both 3T Prisma and Skyra Scanner on different days. The maximum slew rates of the COSI-CONCEPT sequence were below the EPSI maximum slew rates for a given spectral bandwidth and spatial resolution. Extracted 2D COSY spectra were reliable after regridding the polar-encoded data to Cartesian data and CS reconstruction of the accelerated kz and t1 dimensions.Conclusion
We have shown that the non-Cartesian encoded 5D COSI-CONCEPT spectra are very reliable on two different 3T platforms, and that the metabolite raw volume integrals and the ratios measured in the brain phantom are reproducible with excellent CV's for all the metabolites (NAA, Cr, Ch, Glu, Lac and mI).Acknowledgements
This research was supported by grants from 1) NIH/NHLBBI (5R01HL135562-03) and 2) A Breakthrough Step I grant from the US Congressionally Directed Medical Research Program (CDMRP)/ Breast Cancer Research Program (BCRP); contract/grant number: W81XWH-16-1-0524.
References
1. de Graaf RA. In vivo NMR Spectroscopy-3rd Edition: Principles and techniques, New York, NY: Wiley: 2018
2. Bogner W, Otazo R, Henning A. Accelerated MR Spectroscopic Imaging a- a review of current and emerging techniques. NMR Biomed 2020;12:e4314.
3. Magnusson PO, Boer VO, Marsman A, et al. Gamma-aminobutyric acid edited echo-planar spectroscopic imaging (EPSI) with MEGA-sLASER at 7T. Magn Reson Med 2019;81:773-780.
4. Wijtenburg SA, Rowland LM, Edden RAE, Barker PB. Reproducibility of brain spectroscopy at 7T using conventional localization and spectral editing techniques. J Magn Reson Imaging 2013;38:460-7. 5. Thomas MA, Yue K, Binesh N, et al. Localized two-dimensional shift correlated MR spectroscopy of human brain. Magn Reson Med 2001;46(1):58-67.
6. Thomas MA, Hattori N, Umeda M, et al. Evaluation of two-dimensional L-COSY and JPRESS using a 3t MRI scanner: from phantoms to human brain in vivo. NMR Biomed 2003;16:245-251.
7. Verma G, Hariharan H, Nagarajan R, et al. Implementation of two-dimensional L-COSY at 7Tesla: An investigation of reproducibility in human brain. J Magn Reson Imaging 2014;40:1319-1327.
8. Lipnick S, Verma G, Ramadan S, et al. Echo planar correlated spectroscopic imaging: Implementation and pilot evaluation in human calf in vivo. Magn Reson Med 2010;64(4):947–956.
9. Wilson NE, Burns BL, Iqbal Z, Thomas MA. Correlated spectroscopic imaging of calf muscle in three spatial dimensions using group sparse reconstruction of undersampled single and multichannel data. Magn Reson Med 2015;74(5):1199-1208.
10. Wilson NE, Iqbal Z, Burns BL, Keller M, Thomas MA. Accelerated five-dimensional echo-planar J-resolved spectroscopic imaging: Implementation and pilot validation in human brain. Magn Reson Med 2016;75:42-51.
11. Zhao TL, Li Y, Guo R, et al. Accelerated J-resolved 1H MRSI with limited and sparse sampling (k,t1,t2)- space. Magn Reson Med 2021;85:30-41. Epub 2020 Jul 29.
12. Furuyama J, Wilson NE, Thomas MA. Spectroscopic Imaging using concentrically circular echo-planar trajectories in vivo. Magn Reson Med 2012;67:1515-1522.
13. Chiew M, Jiang WW, Burns B, et al. Density-weighted concentric rings k-space trajectory for 1H magnetic resonance spectroscopic imaging at 7T. NMR Biomed. 2018;31(1):1-14:e3838.
14. Emir UE, Burns B, Chiew M, Jezzard P, Thomas MA. Non-water suppressed short echo-time magnetic resonance spectroscopic imaging using a concentric ring k-space trajectory. NMR Biomed 2017;30:e3714
15. Moser P, Hingerl L, Strasser B, et al. Whole-slice mapping of GABA and GABA thorn at 7T via adiabatic MEGA-editing, real-time instability correction, and concentric circle readout. NeuroImage. 2019;184:475-489.
16. Ding XQ, Maudsley AA, Sheriff S, et al. Reproducibility and reliability of short TE whole brain MR spectroscopic imaging at 3T. Magn Reson Med 2015; 73:921-928.
17. Terpstra M, Cheong I, Lyu T, et al. Test-retest reproducibility of neurochemical profiles with short-echo, single voxel MR Spectroscopy at 3T and 7T. Magn Reson Med 2016;76:1083-91.
18. Hnilicova P, Povazan M, Strasser B, et al. Spatial variability and reproducibility of GABA-edited MEGA-LASER 3D-MRSI in the brain at 3T. NMR Biomed. 2016;29(11):1656-1665.
19. Richards TL, Berninger VW, Aylward EH, et al. Reproducibility of proton MR spectroscopic imaging (PEPSI): comparison of dyslexic and normal-reading children and effects of treatment on brain lactate levels during language tasks. Am J Neuroradiol. 2002;23(10):1678-1685.
20. Binesh N, Yue K, Fairbanks L, Thomas MA. Reproducibility of localized 2D correlated MR Spectroscopy. Magn Reson Med 2002;48:942-948.
21. Ogg RJ, Kingsley PB, Taylor JS. WET, a T1- and B1-insensitive water-suppression method for in vivo localized 1H NMR spectroscopy. J Magn Reson B. 1994;104(1):1-10.
22. Klose U. In vivo proton spectroscopy in presence of eddy currents. Magn Reson Med 1990;14:26-30
Figures

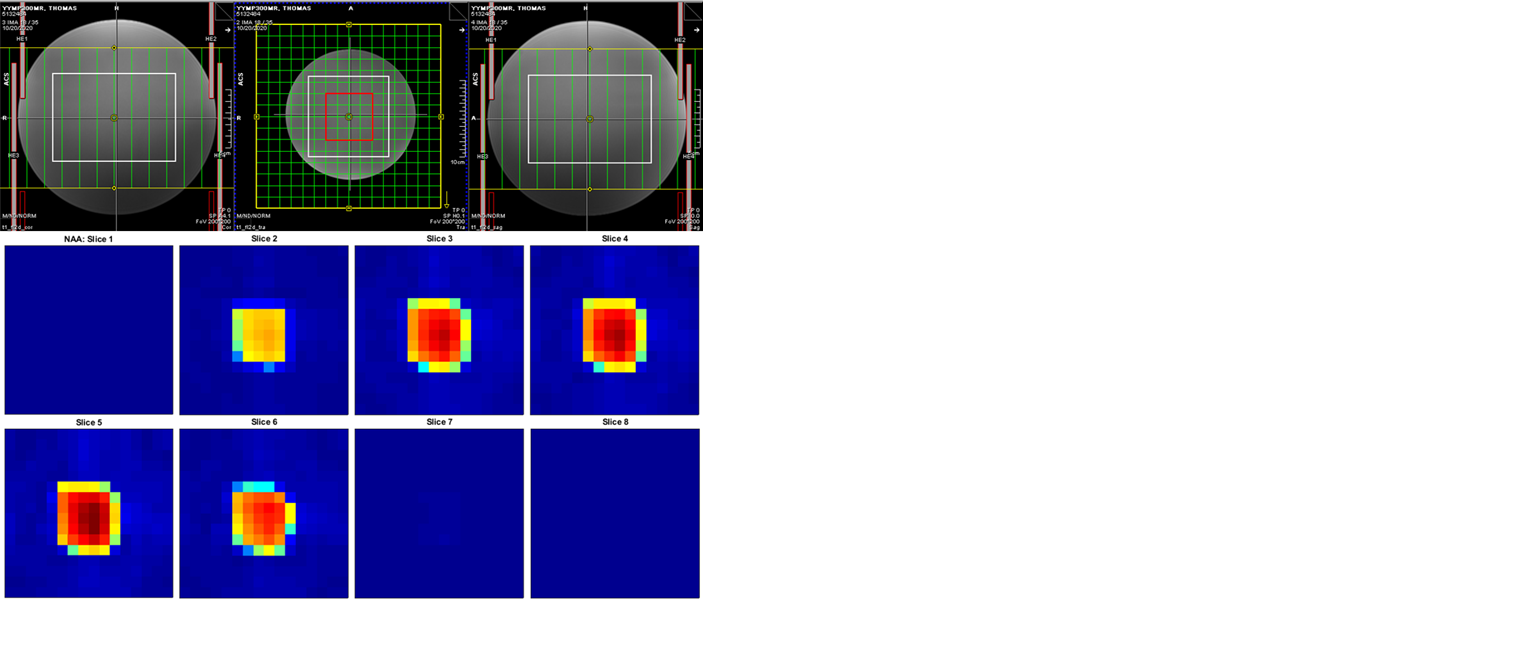
Fig. 2: (Top) Three-plane localization of the volume-of-interest (VOI) in the brain phantom. The VOI size was 10.5cm × 10.5cm × 7.5cm and the field-of-view (FOV) for spectroscopic imaging was 24cm × 24cm × 12cm along the left-to-right (L-R), anterior-to-posterior (A-P) and foot-to-head (F-H) directions, respectively. Sixteen voxels (red square) within the VOI were quantified. (Bottom) Axial NAA maps acquired along the F-H dimension within the FOV. Signal from five slices was measurable within the VOI, which had an extent of 7.5 cm along F-H.