2829
Association of estimated time from the onset of multiple sclerosis plaques with myelin and axon-related quantitative MRI measurement1Department of Radiology, Juntendo University School of Medicine, Tokyo, Japan, 2Division of Regenerative Medicine, The Jikei University School of Medicine, Tokyo, Japan, 3Department of Radiological Science, David Geffen School of Medicine, University of California Los Angeles, Los Angeles, CA, United States, 4Department of Diagnostic Radiology, Toho University Omori Medical Center, Tokyo, Japan, 5Department of Radiology, Graduate School of Medicine, The University of Tokyo, Tokyo, Japan
Synopsis
We investigated the association between estimated time from the onset of multiple sclerosis (MS) plaques and myelin- and axon-related quantitative MRI measurements using synthetic MRI (SyMRI) and neurite orientation dispersion and density imaging (NODDI). We retrospectively analyzed 32 MS patients with 73 newly appearing plaques. MS plaques with longer estimated time from the onset had significantly lower myelin volume fraction and higher g-ratio. It is suggested that myelin in plaques is under ongoing damage more than axons. SyMRI and NODDI may be useful for the quantitative assessment of temporal change in MS plaques.
Introduction
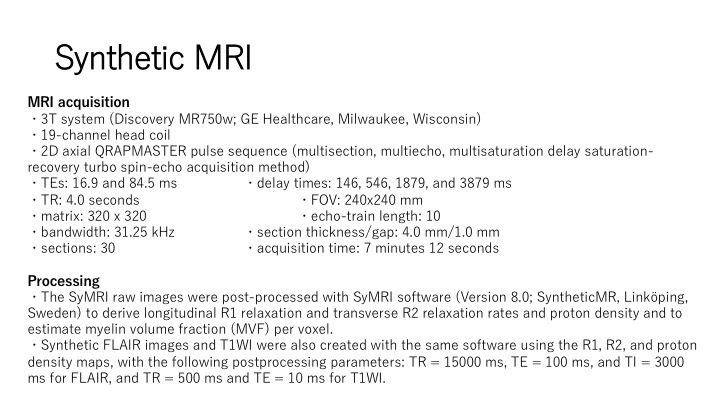
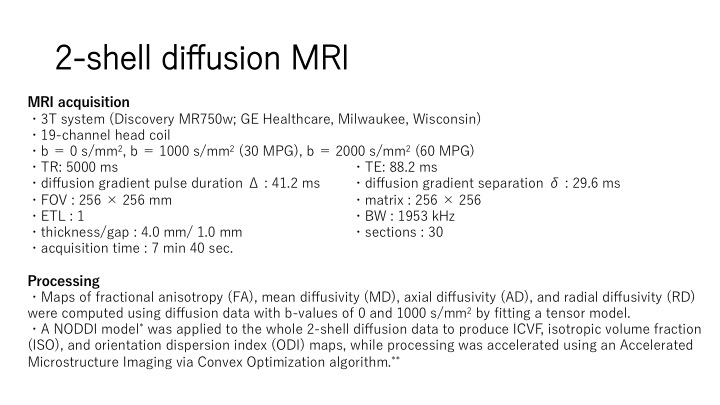
Synthetic MRI (SyMRI) generates adjustable contrast-weighted images based on simultaneous quantification of T1, T2, and proton density (PD) in a scan time of approximately 6 minutes for full head coverage with good accuracy and reproducibility1-3. One recent advance for estimating microstructural complexity of the brain tissue using diffusion MRI is neurite orientation dispersion and density imaging (NODDI). NODDI enables the inference and quantification of the direction and structure of neurites (axons and dendrites) by specifically probing the unique diffusion patterns within three separate microstructural environments: intra-neurite, extra-neurite, and CSF compartments4. Few studies have reported temporal variation of multiple sclerosis (MS) plaques using myelin imaging with SyMRI or NODDI. The aim of the current study was to investigate the association between estimated time from the onset of MS plaques and myelin- and axon-related quantitative MRI measurements.Methods
We retrospectively analyzed 161 patients with relapsing-remitting MS. All previous MR images of each MS patient were reviewed. Newly appearing MS plaques at any time point were included for further analyses. Estimated time from the onset of a plaque was defined as follows: (Date of SyMRI scan) − {Average of the difference between (Date of MRI scan at the appearance of a plaque) and (Date of the latest MRI before the onset of a plaque)}. In order to limit the difference between the "true date of the onset of a plaque" and the ”putative date of the onset of a plaque", we included plaques for which the interval between (Date of MRI scan at the appearance of a plaque) and (Date of the latest MRI scan before the onset of a plaque) was less than 1 year. MRI acquisition and processing of SyMRI and 2-shell diffusion MRI are shown in Fig. 1 and 2. Plaques were defined as a white matter area of more than 5 mm in diameter, with abnormally high intensity on synthetic FLAIR images. Each plaque was manually segmented. Also, normal-appearing white matter (NAWM) contralateral to each plaque with the same size as the plaque was manually segmented on synthetic FLAIR while avoiding areas with abnormal signal intensities. All the ROIs were copied and pasted onto the quantitative maps. Simple linear regressions were performed to assess the association between estimated time from the onset of plaques and quantitative MRI metrics. In each quantitative MRI metric, linear regression slopes were compared between plaques and NAWM by analysis of covariance while controlling for the false discovery rate. A P-value <.05 was considered statistically significant.Results
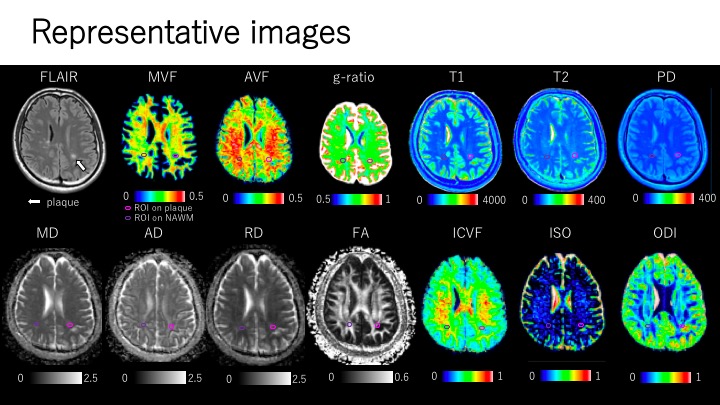
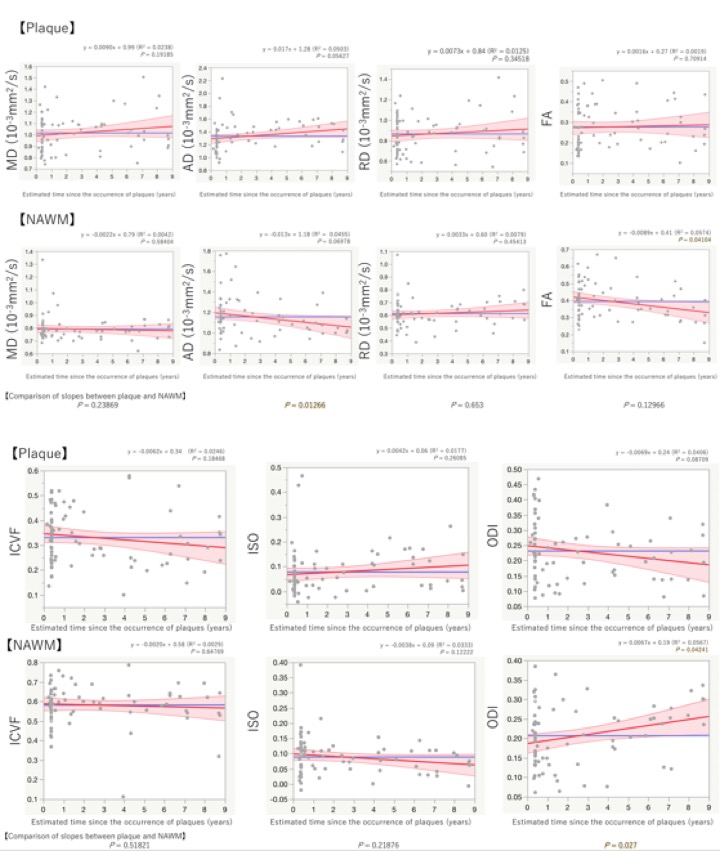
Thirty-two MS patients and 73 plaques were included in the study. Representative images are shown in Fig. 3. The results are shown in Fig. 4 and 5.Discussion
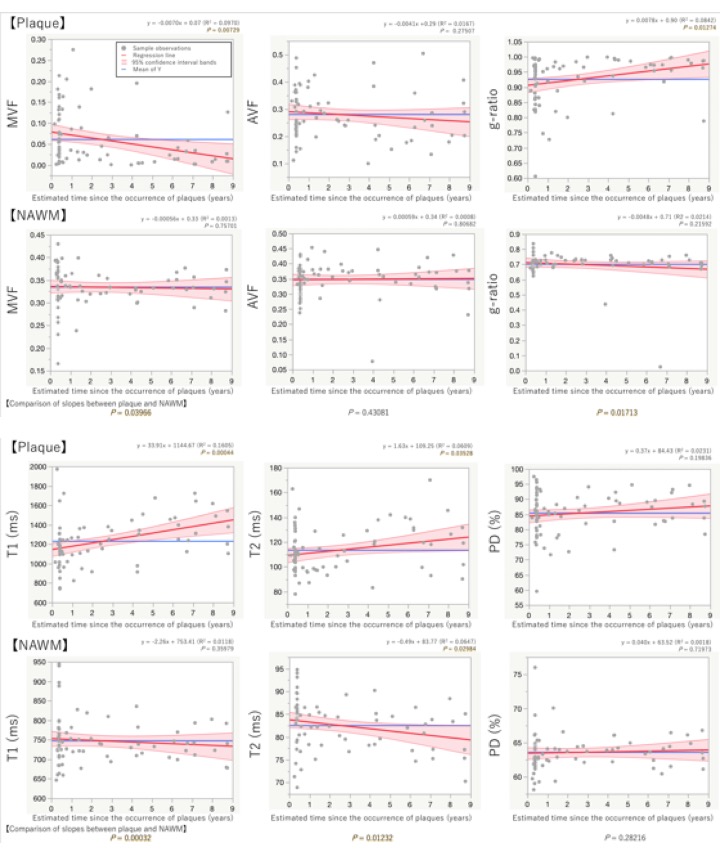
Plaque MVF and g-ratio in relation to the estimated time from the onset were significantly fitted to linear lines with negative and positive slopes, respectively. AVF was nonsignificantly fitted to a linear line with a negative slope. It is suggested that myelin in plaques is under ongoing damage more than axons. This corresponds to the results of previous histological research reporting that demyelination is the primary event in MS patients, and axons are relatively preserved in chronic plaques5. Plaque T1 and T2 in relation to the estimated time from the onset were significantly fitted to linear lines with positive slopes. Plaque PD was nonsignificantly fitted to a linear line with a positive slope. In MS pathology it has been shown that increased T1 and T2 are linked to increased water contents, caused by edema, as well as increased extracellular spaces, caused by demyelination and axonal loss6-10. Plaque MD, AD, and RD were nonsignificantly fitted to a linear line with positive slopes. These results may be related to increased water content and increased extracellular spaces in MS plaques. FA in plaque and NAWM was nonsignificantly and significantly, respectively, fitted to linear lines with positive and negative slopes, respectively. FA is nonspecific and does not distinguish between diseases characterized by different pathologic processes, such as edema, inflammation, demyelination, and leukoaraiosis11,12. Plaque ICVF and NAWM ICVF were nonsignificantly fitted to linear lines with negative slopes. These may suggest the ongoing loss of axonal density both in NAWM and in WM lesions in MS patients. Plaque ISO was fitted to a linear line with a positive slope. This may be related to the ongoing increase in water content and extracellular spaces in MS plaques. Plaque ODI was nonsignificantly fitted to a linear line with a negative slope. NAWM ODI in relation to the estimated time from the onset was significantly fitted to a linear lines with a positive slope. These results might suggest that loss of neuronal fibers, with fewer signals from fibers, may cause a decrease in ODI in plaques with longer estimated elapsed time from the onset, whereas NAWM shows a loss of fiber coherence with relatively maintained neuronal fiber density, leading to an increase in ODI.Conclusion
MS plaques with longer estimated time from the onset had significantly lower MVF and higher g-ratio. It is suggested that myelin in plaques is under ongoing damage more than axons. SyMRI and NODDI may be useful for the quantitative assessment of temporal change in MS plaques.Acknowledgements
This work was supported by the Japan Society for Promotion of Science, KAKENHI grant No. 18K15643.References
1. Warntjes JB, Leinhard OD, West J, et al. Magn Reson Med. 2008;60:320–29.
2. BlystadI, WarntjesJB, SmedbyO, et al. Acta Radiol. 2012;53:1158–63.
3. Hagiwara A, Hori M, Cohen-Adad J, et al. Invest Radiol. 2019;54:39-47.
4. Zhang H, Schneider T, Wheeler-Kingshott CA, et al. Neuroimage. 2012;61:1000–16.
5. Lucchinetti CF, Brück W, Rodriguez M, et al. Brain Pathol. 1996;6:259–74.
6. West J, Aalto A, Tisell A, et al. PLoS One. 2014;9:e95161.
7. Moore GR, Laule C, Mackay A, et al. J Neurol. 2008;255:1802–11.
8. Seewann A, Vrenken H, van der Valk P, et al. Arch Neurol.2009;66:601–09.
9. Vavasour IM, Li DK, Laule C, et al. J Neurol. 2007;254:1653–59.
10. van Walderveen MA, Barkhof F, Pouwels PJ, et al. Ann Neurol.1999;46:79–87.
11. Inglese M, Bester M. NMR Biomed. 2010;23:865–72.
12. Assaf Y, Pasternak O. J Mol Neurosci. 2008;34:51-61.
Figures