2827
Mapping myelin content in ex-vivo MS brain tissue using short-T2 MRI of the lipid-protein bilayer1ETH Zurich and University of Zurich, Zurich, Switzerland, 2University Hospital Zurich and University of Zurich, Zurich, Switzerland
Synopsis
Ultrashort-T2 signal from white matter can be captured for imaging using dedicated short-T2 techniques. In this work, such methods were applied to D2O-exchanged human brain tissue from four donors diagnosed with multiple sclerosis to obtain 0.39 mm isotropic resolution MR images of the ultrashort-T2 tissue components and a lower-resolution multi-TE image series which, via a model fitting procedure, was used to produce maps of the relative content of myelin lipid-protein bilayer. As proof-of-principle, the contrast in these images was compared with corresponding myelin-stained cryosections and sample photographs, yielding promising correlation for white matter, grey matter and multiple sclerosis lesions.
Introduction
Myelin is vital to the development and function of the central nervous system, and, consequently, demyelinating disorders such as multiple sclerosis (MS) can have devastating effects. It would be of great interest for the diagnosis, treatment and monitoring of such diseases, as well as the study of demyelination and myelin repair, to noninvasively track myelin content.Development of MRI techniques for myelin mapping has largely been focused on the unique relaxation properties of myelin water or on magnetisation transfer1-3. However, with the advancement of short-T2 imaging technology, approaches targeting the extremely rapidly decaying MR signal of the myelin lipid-protein bilayer have become feasible4-7. The aim of the present work is to apply the method presented in Ref. (7) for mapping the myelin content of ex-vivo porcine brain to tissue from MS patients and validate the image findings with histological myelin staining.
Methods
SamplesTissue slices (2-3 mm thick and around 15x15 mm2) from four MS patients (UK brain bank) were investigated. Demographic features of the patients are presented in Table 1, labelled as tissue samples 1-4.
In order to produce images depicting primarily non-aqueous proton content, H2O in the samples was exchanged with D2O prior to imaging (similar procedure to Refs. (4,7)).
Imaging
To capture signal from the myelin bilayer, dedicated short-T2 techniques and hardware are needed. This work relied on a high-performance gradient system capable of reaching a strength of over 200 mT/m at 100 % duty cycle8, fast transmit/receive switches9 and a proton-free loop coil of 40 mm diameter. Two different imaging sequences were used, the zero-TE variant HYFI10 and single-point imaging (SPI)11. See Table 2 for details on the protocols.
Analysis
The SPI protocol, consisting of fourteen images acquired at different TE, captures signal decay over time. The behaviour of this decay was analysed by means of a fitting procedure, as described in Ref. (7). The underlying model contains three signal components of Lorentzian or super-Lorentzian lineshape (with T2 or T2,min, respectively), namely water (T2 of 50 ms, chemical shift of 4.7 ppm), myelin bilayer (denoted uT2-S, T2,min of ~10 μs) and residual ultrashort-T2 signal (denoted uT2-L, T2,min of ~100 μs).
Specific T2 values of the non-aqueous components were found by fitting the average signal from normal-appearing white matter (WM) regions in samples 1 and 2. Maps of the amplitude contributions of each component were generated through voxel-by-voxel fitting where, to increase fit stability, all readily-determined parameters were fixed.
Tricubic interpolation was performed on all SPI data, reducing voxel size by a factor of 2, and an additional factor of 3 was applied for display purposes.
Histology
Subsequent to imaging, the samples were cryosectioned (10 µm) and underwent immunohistochemistry for myelin oligodendrocyte glycoprotein (MOG) with haematoxylin counterstain. MOG staining density is closely related to tissue myelin density.
Results
Figure 1 demonstrates signal decay as a function of time for the SPI image series.The T2,min times of the non-aqueous components were found to be 6.5 μs and 110 μs, which is in good agreement with expected values.
An example single-voxel fit is shown in Figure 2. The T2 times of all three components were fixed, and the fit found the chemical shifts of the uT2-S and uT2-L components at 1.26 ppm and 2.12 ppm, respectively. The former corresponds well with the expected chemical shift of fat, supporting the claim that the uT2-S component represents the myelin bilayer.
Figure 3 presents MR results, visual photographs and myelin-stained cryosections for all samples. Note that as a result of the D2O exchange, practically all signal in the MR images is non-aqueous. The HYFI images demonstrate the ability of dedicated short-T2 imaging systems to image the non-aqueous components of brain tissue at high resolution, and the amplitude maps of the uT2-S component are interpreted as depicting relative myelin content.
Both MR results show significant correlation with the sample photographs. Grey matter (GM) and WM are clearly distinguishable, with GM producing less MRI signal and giving lower uT2-S amplitude than WM. MS lesions hardly produce signal, indicating a lack of practically any detectable non-aqueous protons. Direct comparison of the MR images with the corresponding myelin-stained sections shows a clear correlation between MR signal intensity and MOG staining density.
It is worth noting that GM signal levels are significant enough for potential analysis also of GM myelin.
The amplitudes of the water and uT2-L components are small compared to the uT2-S component, constituting only around 2 % and 8 %, respectively.
Discussion and Conclusion
While the analysis of the SPI data gave conclusive results for the uT2-S component representing the myelin bilayer, there is likely additional information present in the observed signal evolutions which is yet to be extracted. Further work should also include validation in samples not subjected to D2O exchange and translation to in-vivo studies.Overall, accessing the myelin bilayer through short-T2 imaging methods was shown to be feasible also in human tissue. Notably, the MR image contrast enables depiction of MS lesions to a similar degree as histological MOG-staining.
Acknowledgements
The authors would like to thank Richard Reynolds from the UK MS Tissue Bank for providing the brain samples.References
- Piredda GF, Hilbert T, Thiran J-P, Kober T. Probing myelin content of the human brain with MRI: A review. Magn Reson Med. 2021;85:627-652.
- MacKay AL, Laule C. Magnetic Resonance of Myelin Water: An in vivo Marker for Myelin. Brain Plast. 2016;2:71-91.
- Varma G, Duhamel G, de Bazelaire C, Alsop DC. Magnetization transfer from inhomogeneously broadened lines: A potential marker for myelin. Magn Reson Med. 2015;73:614-622.
- Wilhelm MJ, Ong HH, Wehrli SL et al. Direct magnetic resonance detection of myelin and prospects for quantitative imaging of myelin density. Proc Natl Acad Sci. 2012;109:9605-9610.
- Du J, Ma G, Li S et al. Ultrashort echo time (UTE) magnetic resonance imaging of the short T2 components in white matter of the brain using a clinical 3T scanner. NeuroImage. 2014;87:32-41.
- Seifert AC, Li C, Wilhelm MJ, Wehrli SL, Wehrli FW. Towards quantification of myelin by solid-state MRI of the lipid matrix protons. NeuroImage. 2017;163:358-367.
- Weiger M, Froidevaux R, Baadsvik EL, Brunner DO, Rösler MB, Pruessmann KP. Advances in MRI of the myelin bilayer. NeuroImage. 2020;217:116888.
- Weiger M, Overweg J, Rösler MB et al. A high-performance gradient insert for rapid and short-T2 imaging at full duty cycle. Magn Reson Med. 2018;79:3256-3266.
- Brunner DO, Furrer L, Weiger M et al. Symmetrically biased T/R switches for NMR and MRI with microsecond dead time. J Magn Reson. 2016;263:147-155.
- Froidevaux R, Weiger M, Rösler MB, Brunner DO, Pruessmann KP. HYFI: Hybrid filling of the dead-time gap for faster zero echo time imaging. medRxiv. 2020. doi: 10.1101/2020.06.16.20132704.
- Balcom BJ, MacGregor RP, Beyea SD, Green DP, Armstrong RL, Bremner TW. Single-point ramped imaging with T1 enhancement (SPRITE). J Magn Reson Ser A. 1996;123:131-134.
Figures
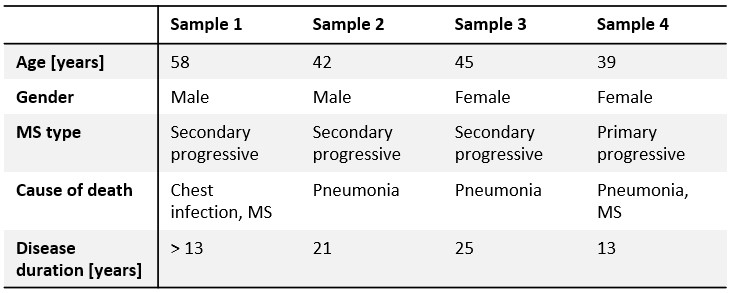
Table 1: Information on the human MS brain tissue samples. Disease duration is stated from the time of onset, except for sample 1 where only the time of diagnosis is known.
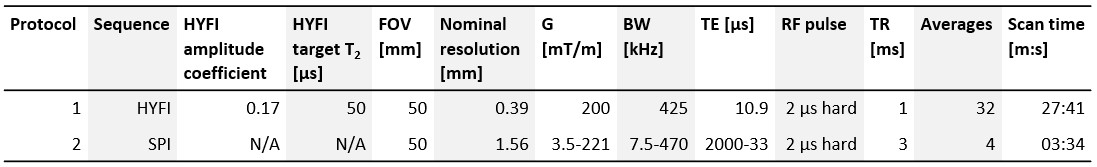
Table 2: Protocols for MRI of the myelin bilayer. Pulse power was adjusted for maximum signal yield, leading to flip angles of approximately 2º.
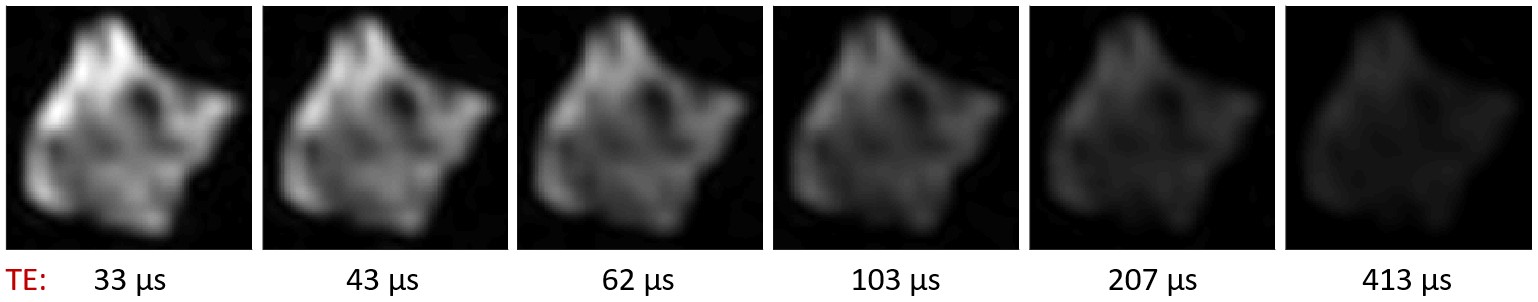
Figure 1: Time evolution of signal intensity in SPI images of human MS brain tissue after D2O exchange. Six of the fourteen images acquired for the SPI series of sample 1 are shown. The signal intensity drops as TE increases, and has all but vanished after 413 μs – a clear indication that the captured signal stems from tissues with T2 times of around a hundred microseconds at most.
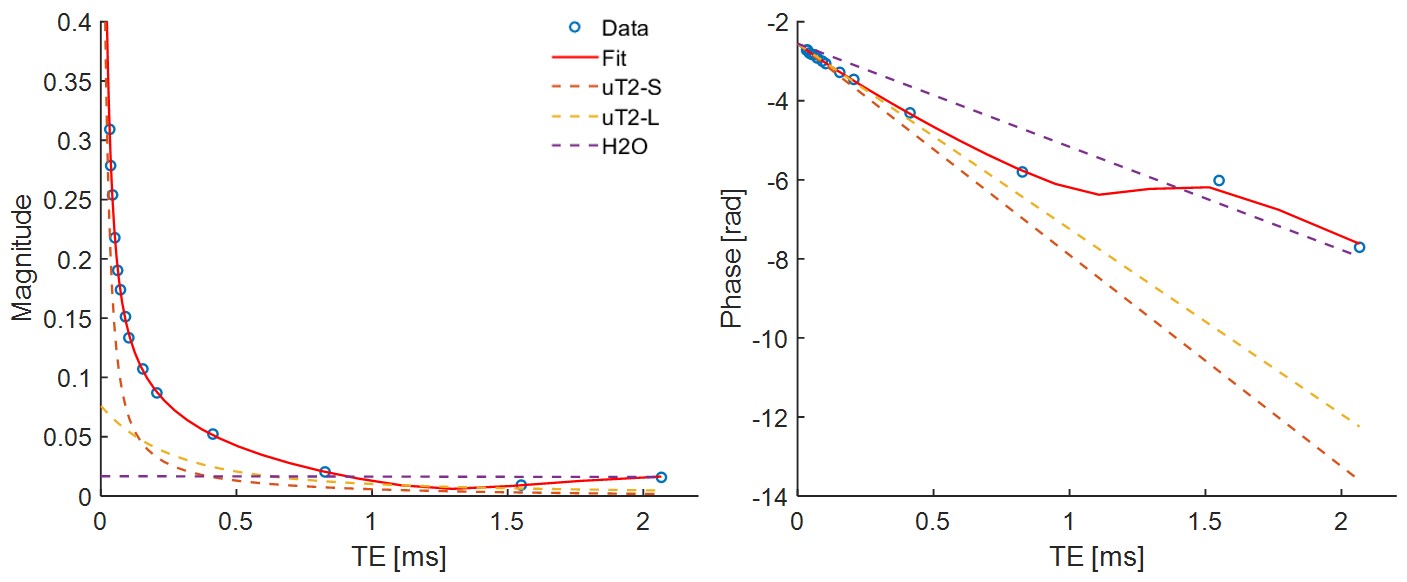
Figure 2: Example of a single-voxel fit of the data of Figure 1, showing normalised magnitude (left) and phase (right) evolution for a normal-appearing WM region in sample 1. The blue circles indicate data points and the solid red line shows the fit. The dashed lines represent the contributions of the signal model components: uT2-S, believed to represent the myelin bilayer (orange); uT2-L, assembling residual ultrashort-T2 signals (yellow); and water (purple). After around 1 ms the water signal dominates.
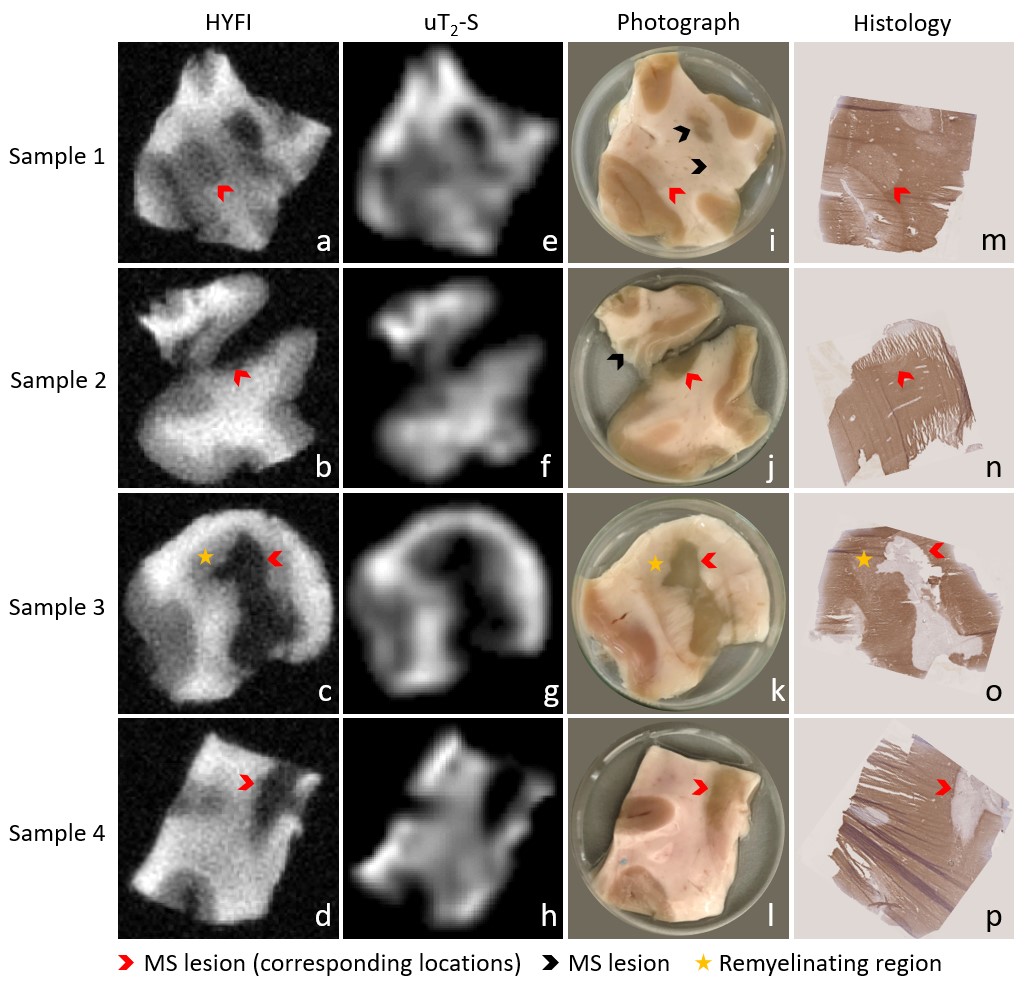
Figure 3: Image series showing the correlation between MRI results, photographs and histology for all samples. a-d) High-resolution HYFI images, e-h) amplitude maps of the uT2-S fit component, i-l) sample photographs, m-p) corresponding 10 µm cryosections with myelin staining using immunohistochemistry for MOG (brown) and haematoxylin counterstaining (purple). Note that sample 2 contains two tissue pieces (originally connected), but histology was only performed on the larger one.