2825
Increasing age is independently associated with higher free water in non-active MS brain - A multi-compartment analysis using FAST-T21Radiology, Weill Cornell Medicine, New York, NY, United States, 2Cornell University, Ithaca, NY, United States
Synopsis
Multiple Sclerosis (MS) includes both inflammatory demyelination and axonal degeneration, which may affect the tissue water fractions of brain parenchyma in both myelin and the CSF water compartments. Quantification of brain parenchyma CSF fraction (CSFF) may help us better understanding of this complicated neurodegenerative disease. Aging is the most common cause of neurodegenerations. Here we tested CSFF in a 111 non-active MS cohort (age:45-79 years) by using the multi-echo T2 relaxometry-based multiple water-compartment method. Multivariate multiple regression shows that in cortical gray matter CSFF increases with age by controlling other factors including gender, disease duration, and MS lesion burden.
Introduction
MS is a complex disease, characterized by inflammatory demyelination and axonal degeneration. It is hard to treat because the etiology is unknown. A better understanding of the disease mechanism will facilitate the development of new therapies1. Aging is the most common cause of neurodegenerations. This study utilized aging as a risk factor of neurodegenerations and tested its relationship with brain parenchyma CSF fraction (CSFF) in non-active MS brain. CSFF has been hypothesized as a potential biomarker of perivascular space (PVS) of vessels, which has been verified functioning as brain clearance pathway of the glymphatic system in recent studies2–4. We hypothesize that cerebral cortex CSFF will increase with aging in non-active MS independent of white matter lesion load (neuroinflammation). T2 relaxometry-based multiple water-compartment method has been applied in brain research for quantitative water fraction measure, but most of them focused on the myelin water in multiple sclerosis study5–7. In this study, we first applied the T2 relaxometry method8 and the three-pool water compartment model7 in the cortical grey matter to quantify the CSFF and hence inference the role of CSFF in non-active MS.Methods
$$${\bf Three\,compartment\,model}$$$The multi-echo T2 signal was decomposed into three parts, i.e., contributed from myelin (MWF), intra-extracellular (IEWF), and CSFF water (CSFF). The fitting was done using the nonlinear least square fitting method.
$$${\bf Subjects\,and\,data\,acquisition}$$$
This was a retrospective study of 111 non-active MS patients (male:33, female: 78, age: 58.02 9.70y) who were scanned as part of an imaging research database. Multi-echo T2 data was acquired using Fast Acquisition with Spiral Trajectory and adiabatic T2prep (FAST-T2) sequence at 3T. The imaging parameters: axial field of view = 24 cm; matrix size = 192×192; slice thickness = 5 mm; number of slices = 32; spiral TR = 7.8 ms; spiral TE = 0.5 ms; number of spiral leaves per stack = 32; flip angle = 10°; readout bandwidth = ±125 kHz; TEs = 0, 7.6, 17.6, 67.6, 147.6, 307.6 ms.
$$${\bf Data\,processing\,and\,analysis}$$$
T1w images of all subjects were processed using FreeSurfer (FS)9. Multi-echo T2 data was fitted using the three-compartment model for the CSFF7. CSFF values were extracted in the cortical lobes using the masks generated from FS10. MS lesion was segmented using convolutional neural network-based segmentation tool11. PVS score was evaluated on the T2w image at the semiovale slice12. A multivariate regression model was used for the analysis of the relation between CSFF and age, gender, MS lesion-load, and disease duration. The p-values were FDR and BON adjusted to exclude the effects of the MS disease.
Results
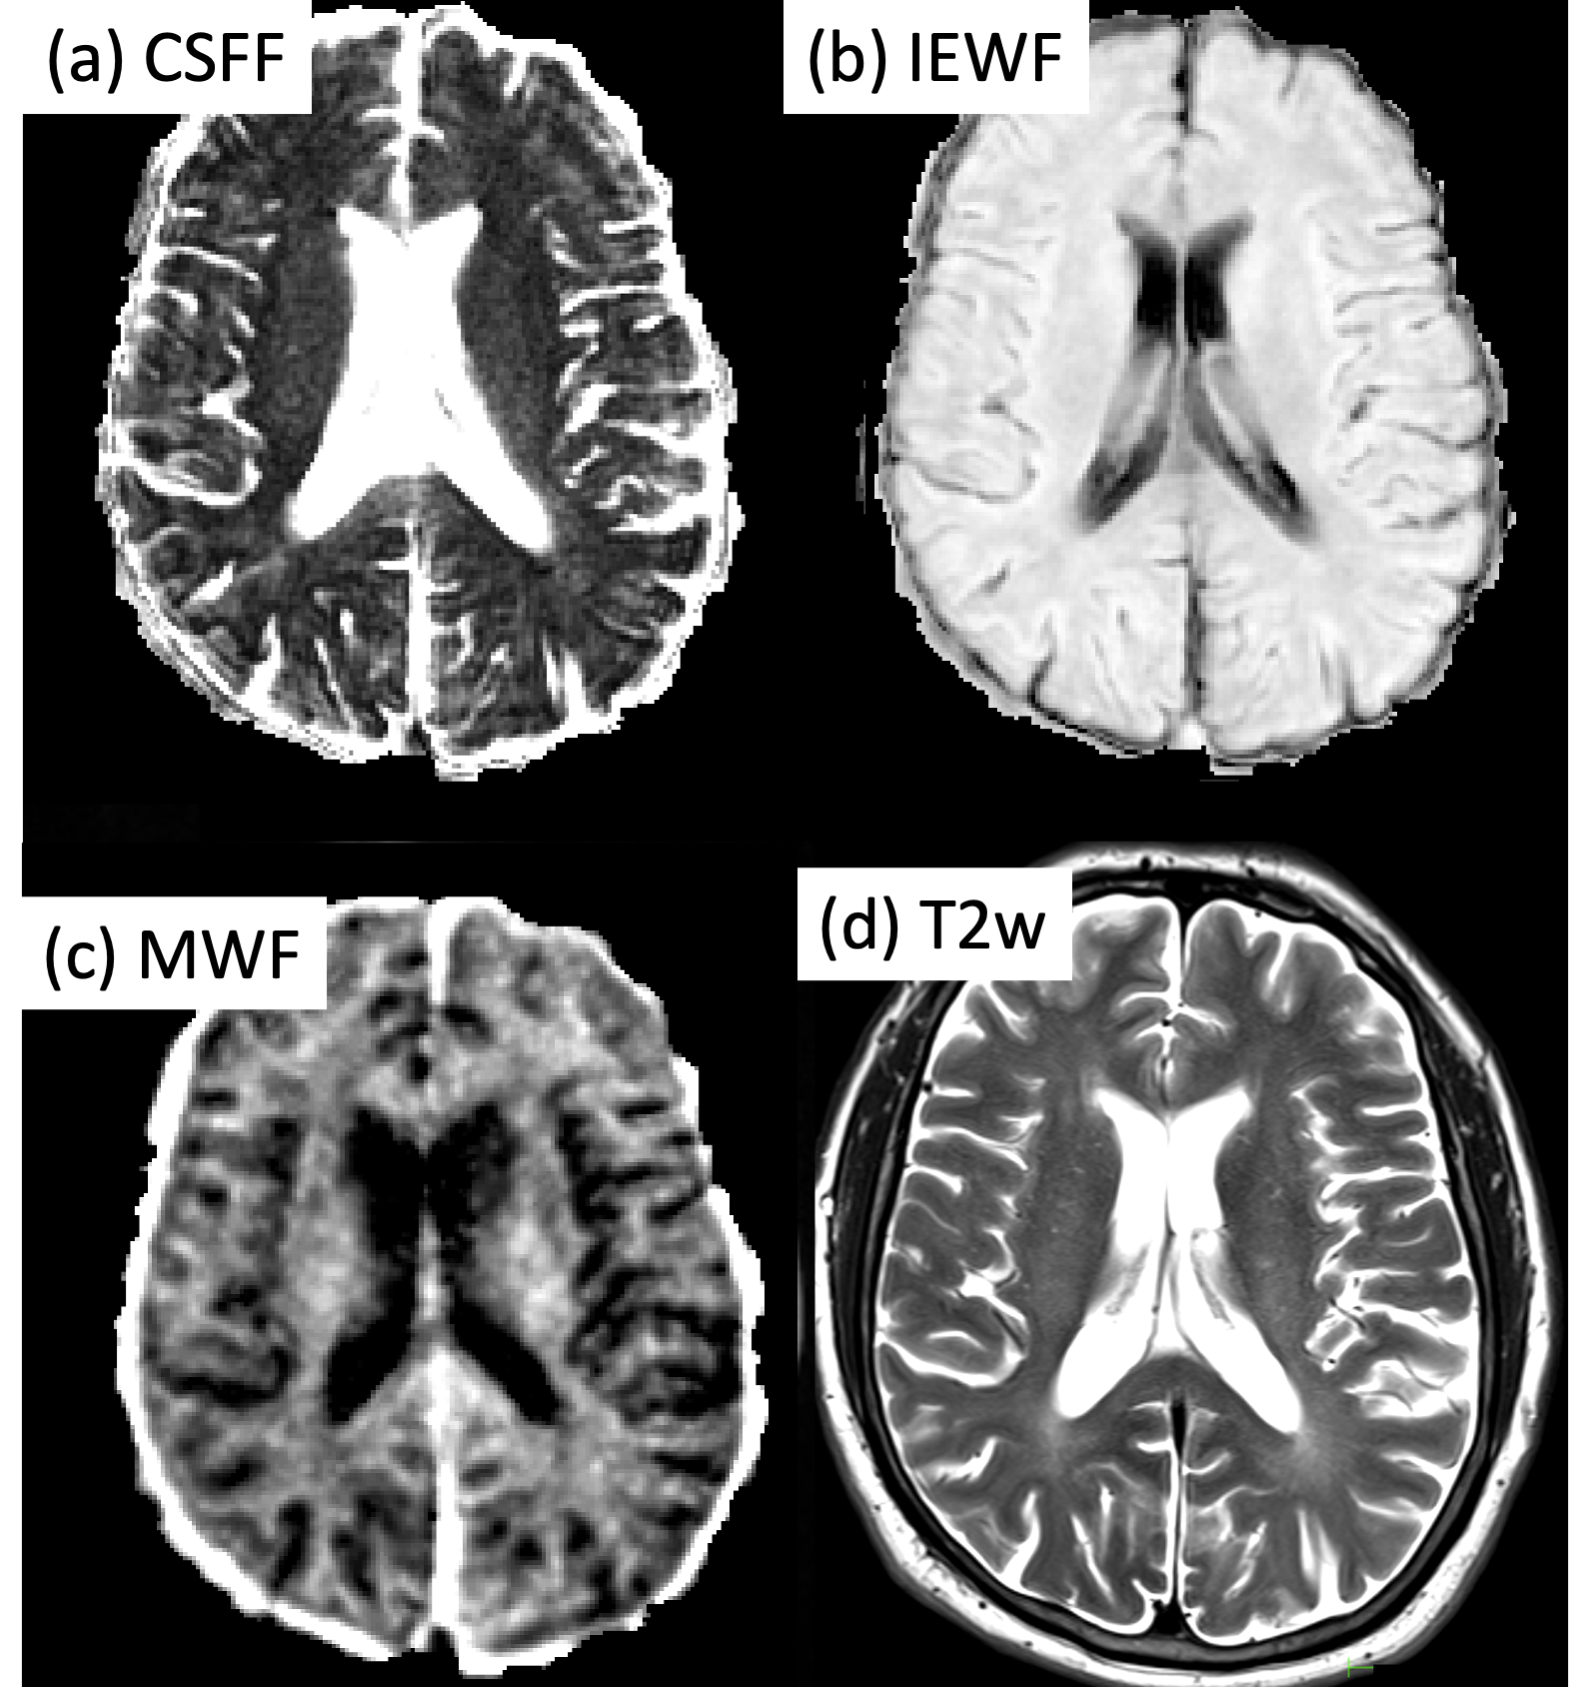
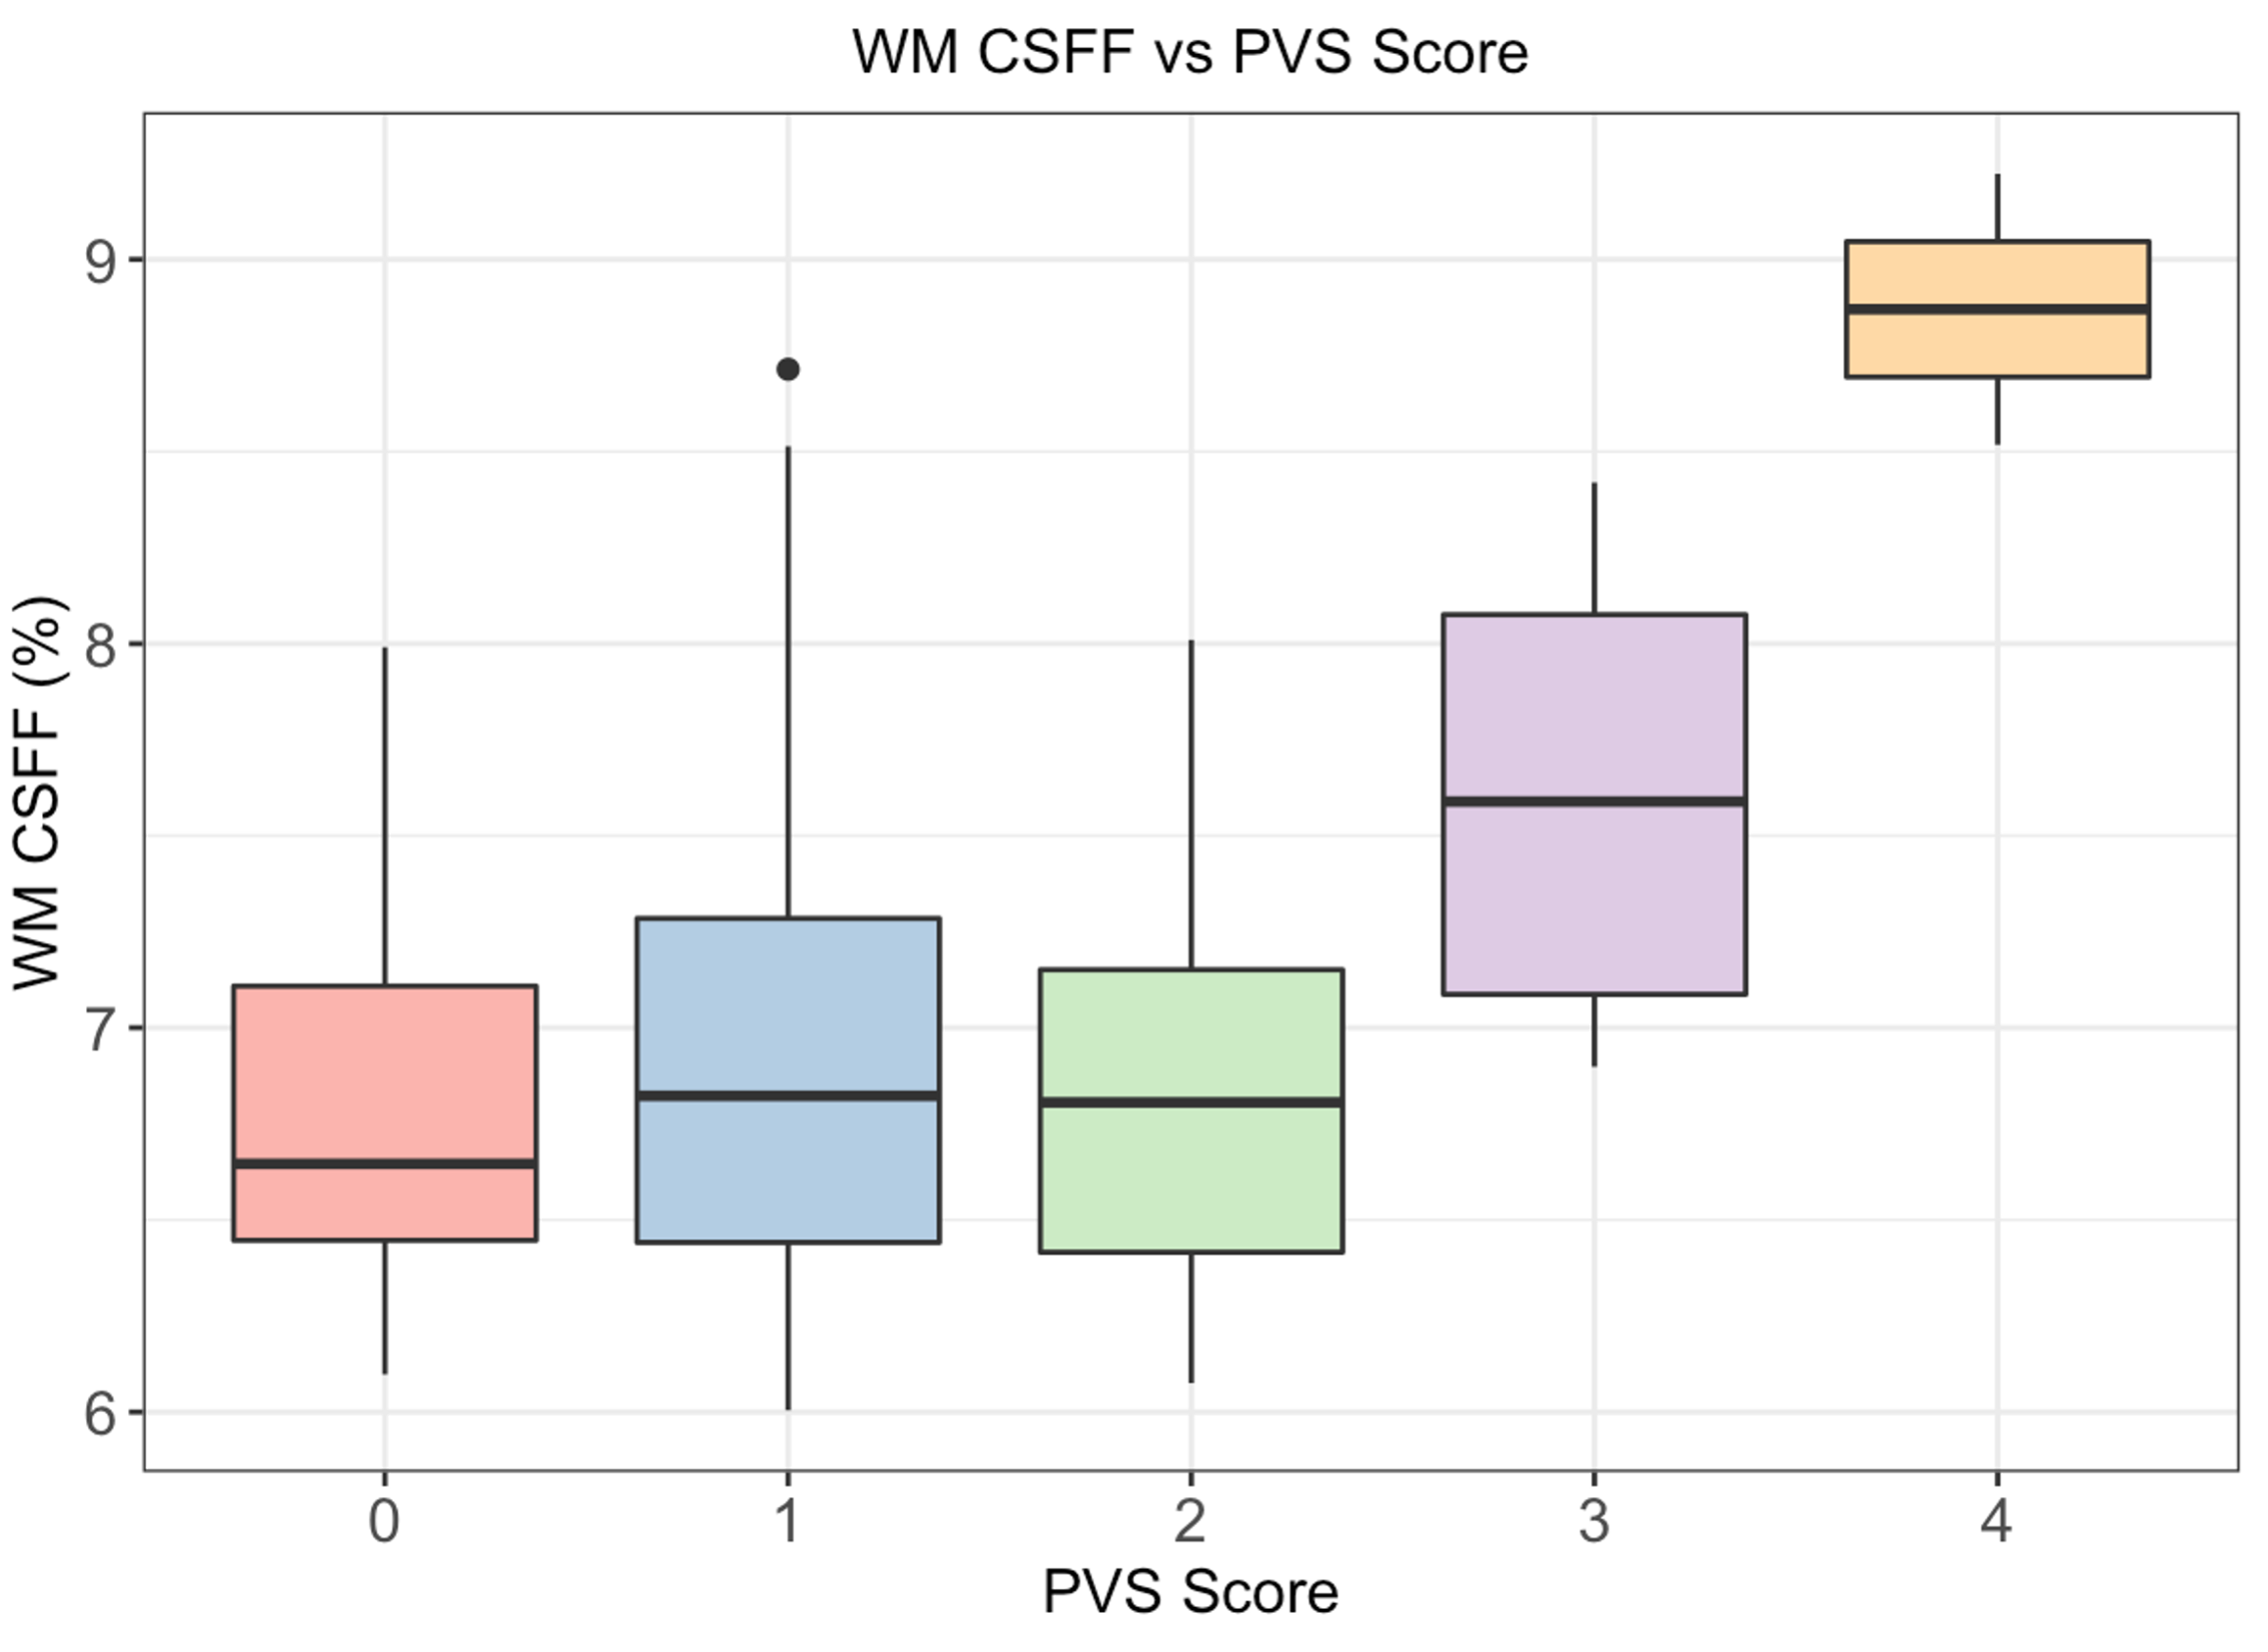
Fig.1 shows the CSFF, IEWF, MWF maps, and T2 weighted maps. The T2w map was used for the PVS scoring on the slice of semiovale.The relationship between white matter CSFF and PVS score is shown in Fig.2, in which the CSFF increases with PVS score. This indicates that CSFF could be an alternative measure of PVS. ANOVA model shows that there is a difference in WM CSFF by PVS score (F=5.83, p<0.001).
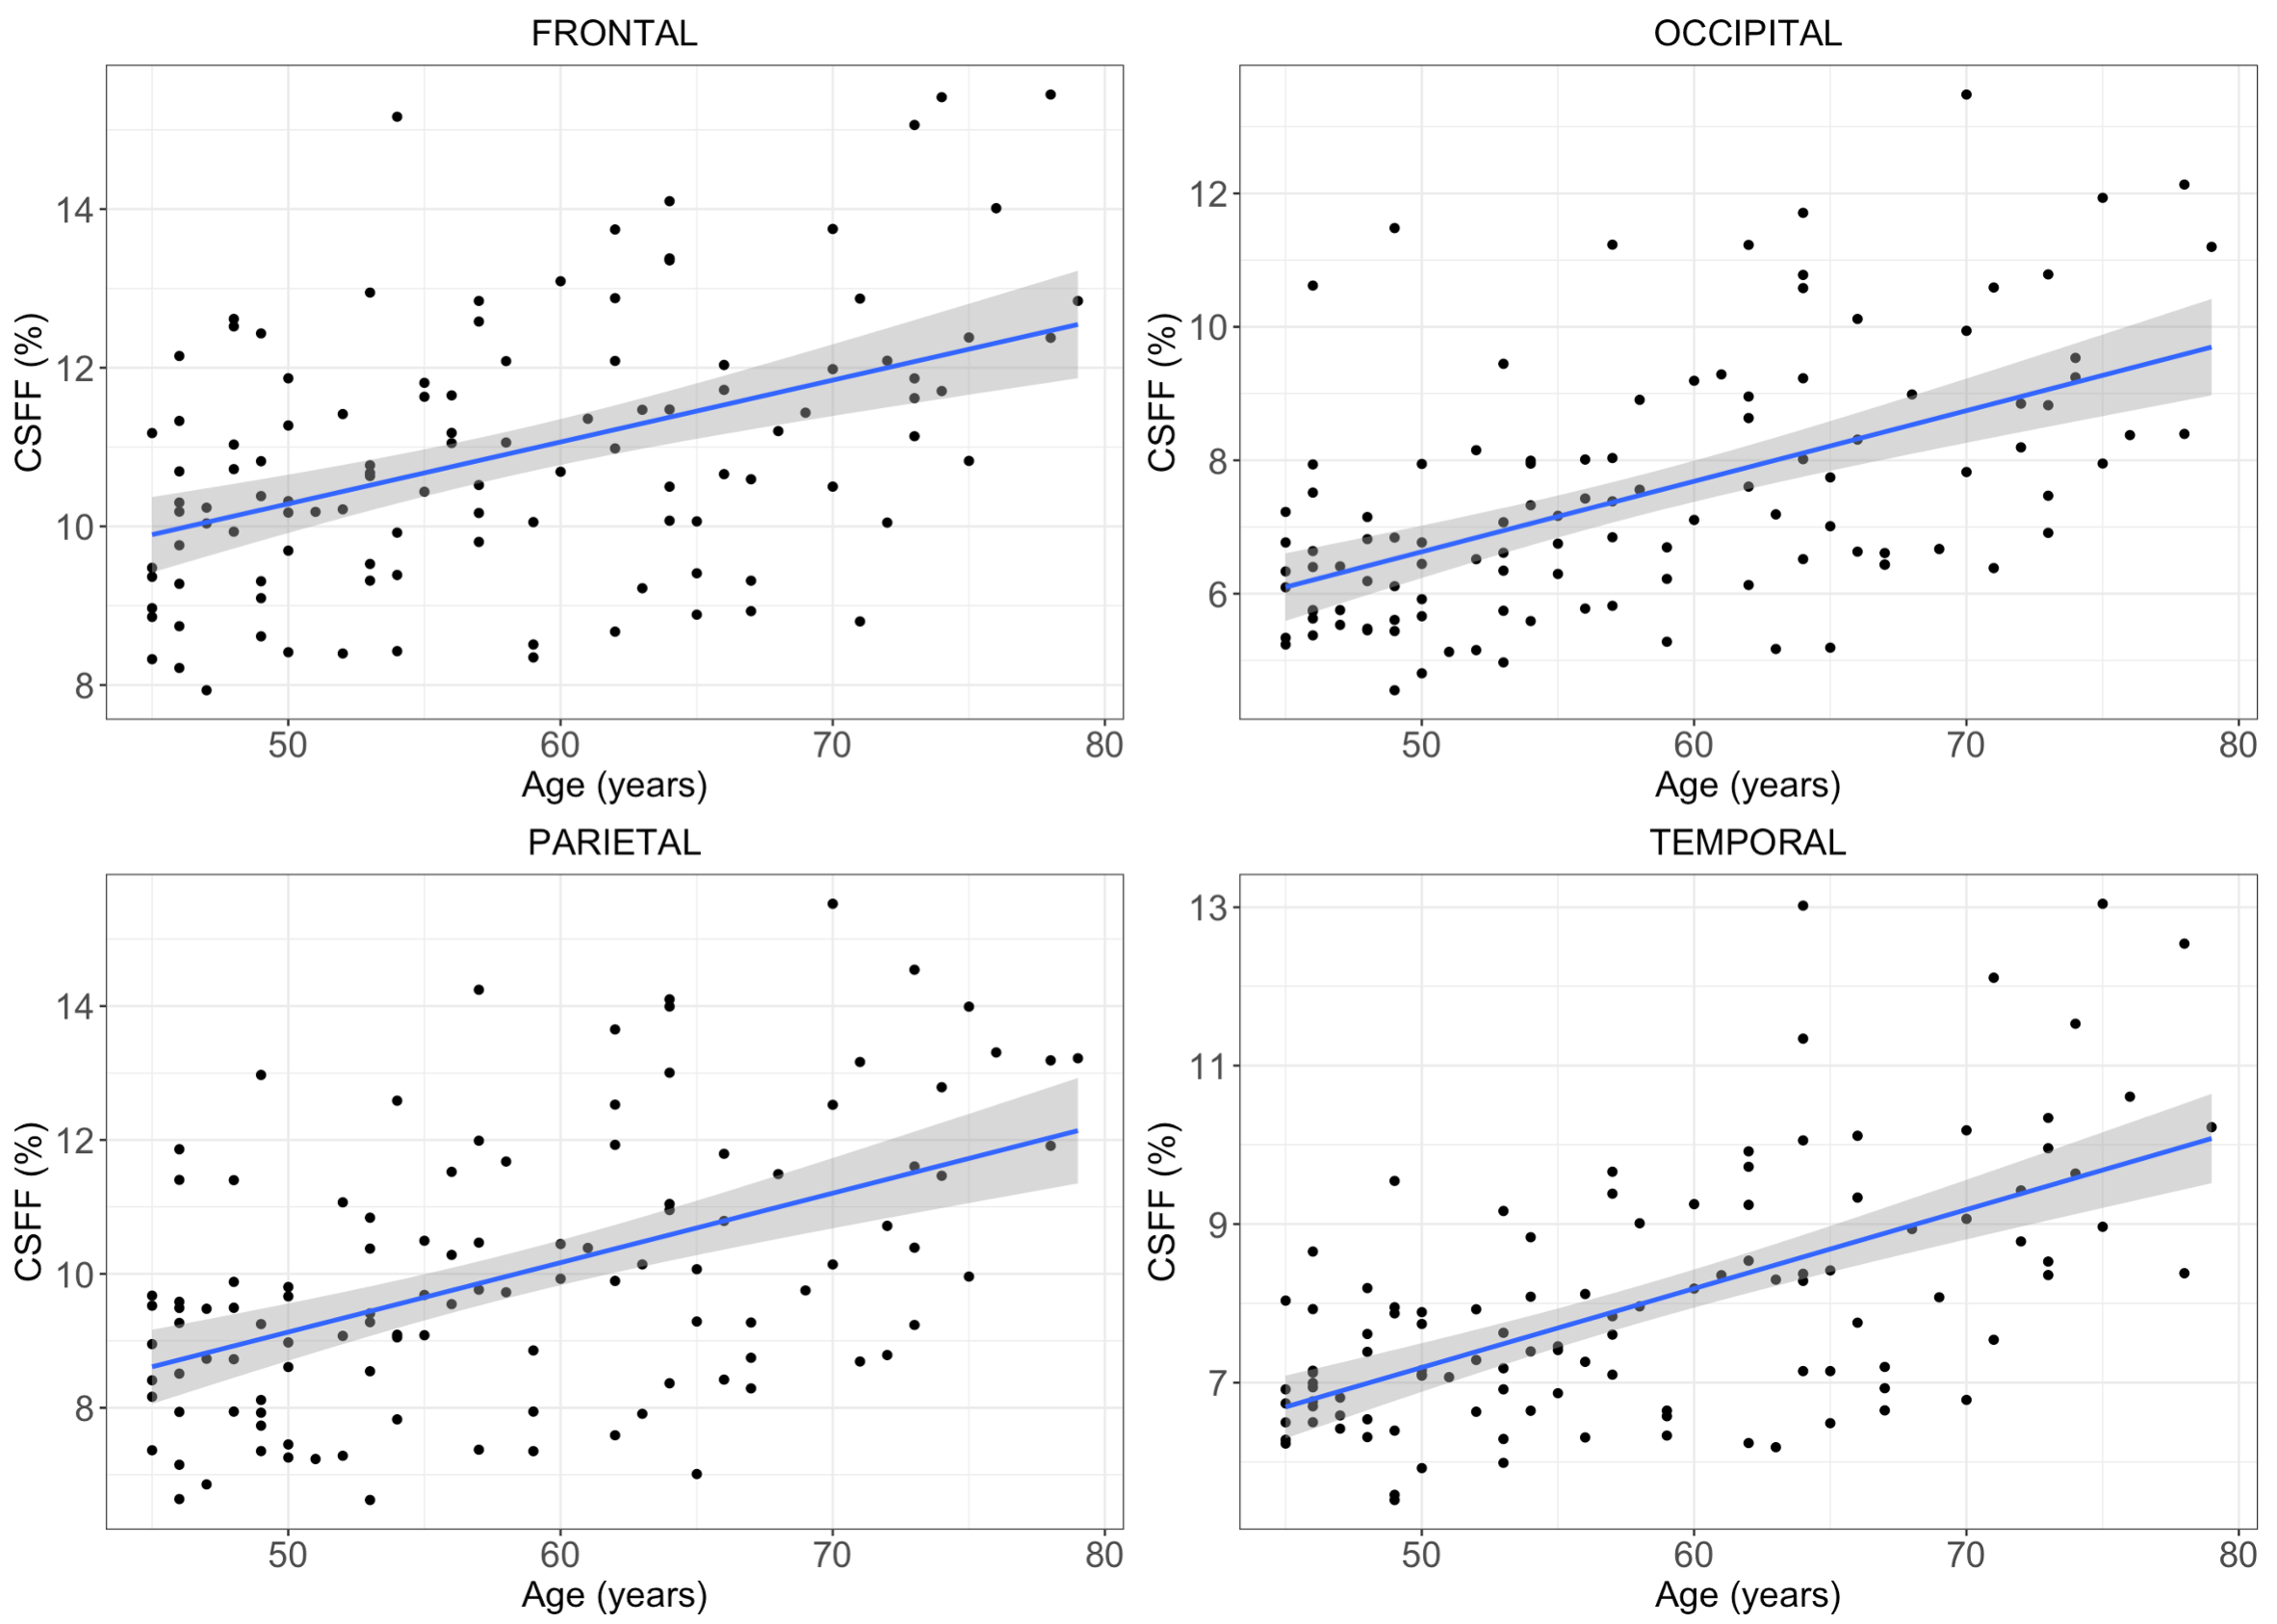
The linear relationship between CSFF and age in four cortical lobes is shown in Fig.3. The multivariate regression analysis shows that age significantly related to CSFF in all four lobes by controlling the gender, disease duration, and MS lesion burden (FDR adjusted p-values are frontal: p=0.02, occipital/parietal/temporal: p<0.01).
Discussion
The role of neurodegeneration in MS has got increasing attention in recent years, which may involve the disfunction of the recently discovered brain glymphatic system13. PVS is an important pathway of the glymphatic system and has been reported link with aging and neurodegeneration disease. On the other hand, CSFF reflects the nature of the CSF water compartment in the brain parenchyma and has been hypothesized as a quantitive measure of PVS which was filled with CSF14,15. T2 relaxometry based modeling provides us an alternative way to measure PVS by evaluating the CSFF. With this method, we observed CSFF increases with aging in the cerebral cortex for the first time by controlling MS disease factors, which indicates that CSFF could be a potential biomarker to monitor the dysfunction of glymphatic clearance in MS.The quantification of CSFF not only includes the visible PVS shown in conventional MR images but also the invisible PVS in conventional MR images. In Fig.2 CFFS doesn't seem very different for PVS score 0-2 but starts to increase at a score of 3. This may be because the portion of the visible enlarged PVS is a relatively small part of total PVS in those subjects, and the CSFF measure reflecting total PVS was driven by those invisible small ones.
Conclusion
Multi-echo spiral T2 relaxometry provides a way to map the CSFF in the cerebral cortex, which is a potential new biomarker to monitor the glymphatic clearance function and may help us better understand the MS mechanism.Acknowledgements
No conflict of interest.References
1. Bjelobaba, I., Savic, D. & Lavrnja, I. Multiple Sclerosis and Neuroinflammation: The Overview of Current and Prospective Therapies. Curr. Pharm. Des. 23, 693–730 (2017).
2. Brown, R. et al. Understanding the role of the perivascular space in cerebral small vessel disease. Cardiovasc. Res. 114, 1462–1473 (2018).
3. Durcanova, B. et al. The Configuration of the Perivascular System Transporting Macromolecules in the CNS. Front. Neurosci. 13, (2019).
4. Zhu Yi-Cheng et al. Severity of Dilated Virchow-Robin Spaces Is Associated With Age, Blood Pressure, and MRI Markers of Small Vessel Disease. Stroke 41, 2483–2490 (2010).
5. Kwon, O. I., Woo, E. J., Du, Y. P. & Hwang, D. A tissue-relaxation-dependent neighboring method for robust mapping of the myelin water fraction. NeuroImage 74, 12–21 (2013).
6. Kulikova, S., Hertz-Pannier, L., Dehaene-Lambertz, G., Poupon, C. & Dubois, J. A New Strategy for Fast MRI-Based Quantification of the Myelin Water Fraction: Application to Brain Imaging in Infants. PLOS ONE 11, e0163143 (2016).
7. Nguyen, T. D. et al. Feasibility and reproducibility of whole brain myelin water mapping in 4 minutes using fast acquisition with spiral trajectory and adiabatic T2prep (FAST-T2) at 3T: Whole Brain Myelin Water Mapping with FAST-T2. Magn. Reson. Med. 76, 456–465 (2016).
8. Nguyen, T. D. et al. T2prep three-dimensional spiral imaging with efficient whole brain coverage for myelin water quantification at 1.5 tesla. Magn. Reson. Med. 67, 614–621 (2012).
9. Fischl, B. et al. Whole Brain Segmentation: Automated Labeling of Neuroanatomical Structures in the Human Brain. Neuron 33, 341–355 (2002).
10. Greve, D. N. & Fischl, B. Accurate and robust brain image alignment using boundary-based registration. NeuroImage 48, 63–72 (2009).
11. Zhang, H. et al. Geometric Loss for Deep Multiple Sclerosis lesion Segmentation. ArXiv200913755 Cs Eess (2020).
12. Potter, G. M., Chappell, F. M., Morris, Z. & Wardlaw, J. M. Cerebral Perivascular Spaces Visible on Magnetic Resonance Imaging: Development of a Qualitative Rating Scale and its Observer Reliability. Cerebrovasc. Dis. Basel Switz. 39, 224–231 (2015).
13. Nedergaard, M. & Goldman, S. A. Glymphatic failure as a final common pathway to dementia. Science 370, 50–56 (2020).
14. Mestre, H., Kostrikov, S., Mehta, R. I. & Nedergaard, M. Perivascular Spaces, Glymphatic Dysfunction, and Small Vessel Disease. Clin. Sci. Lond. Engl. 1979 131, 2257–2274 (2017).
15. Bakker, E. N. T. P. et al. Lymphatic Clearance of the Brain: Perivascular, Paravascular and Significance for Neurodegenerative Diseases. Cell. Mol. Neurobiol. 36, 181–194 (2016).
Figures