2823
A Comparison of Brain Iron Accumulation Patterns Between Subtypes of Multiple Sclerosis1Department of Medical Biophysics, University of Toronto, Toronto, ON, Canada, 2Electrical and Computer Engineering, McMaster University, Hamilton, ON, Canada, 3School of Biomedical Engineering, McMaster University, Hamilton, ON, Canada
Synopsis
A data analysis pipeline was developed to correlate multiple sclerosis (MS) disease severity with regional susceptibility weighted imaging (SWI) intensity scores. It was assumed that reduced brain SWI signal correlated with elevated iron accumulation. Susceptibility weighted imaging (SWI) was used to map regional variations in brain iron content within each MS subtype. Number of brain areas with abnormal brain iron (relative to healthy age/sex matched controls), and the size of abnormal SWI image clusters, correlated with disease severity, based on subtype.
Introduction
Multiple sclerosis (MS) is a neuro-inflammatory and neuro-degenerative disease of the central nervous system characterized by focal demyelinating lesions. When lesions form, patients may experience a wide array of neurological symptoms depending on the location of the lesion. Lesion relapses may, or may not, fully or partially resolve over time. Multiple sclerosis is a progressive disease, meaning that some patients experience a steady decline in neurological function over time, with or without relapses. The exact cause of progression is unknown.There are 4 subtypes of MS, based on the temporal characteristic of lesion formation: Benign MS (BMS), Primary Progressive (PPMS), Secondary Progressive (SPMS) and Relapsing/Remitting (RRMS). Although MS is a complex disease one common factor among all subtypes seems to be abnormal accumulation of iron. Because susceptibility weighted imaging (SWI) is sensitive to local iron accumulation we sought to understand whether this imaging approach could differentiate different subtypes of MS, assuming severity is related to local iron content.
Materials and Methods
In a protocol approved by our institutional ethics board, patients meeting the revised 2005 McDonald Criteria1 for multiple sclerosis were recruited and stratified into the 4 MS subtypes according to the following definitions: RRMS patients having had two or more attacks, separated by at least 30 days; SPMS patients initially having a relapsing-remitting pattern but then showing gradual deterioration with increasing disability over a period of at least 12 months (independent of any clinically documented attacks); PPMS patients with progressive disease right from the time of clinical onset, and who have been in this pattern for at least 12 months (with or without attacks superimposed); BMS patients having a form of RRMS for at least 5 years with an attack rate (mild, Expanded Disability Status Scale , EDSS < 3.0) less than 1 per year 2. Twenty-five patients for each subtype were recruited for a total of 100 patients. Additionally, 100 age and sex matched controls were recruited.Magnetic Resonance Imaging MRI was performed using a GE 3T Signa HD MRI system and an 8-channel neurovascular (NV) phased array RF coil (GE Healthcare, Milwaukee, WI). Anatomical images were acquired using a FAME (Fast Acquisition with Multiphase Elliptical) fast gradient echo sequence (1mm3 isotropic voxels, TE/TR = 2.1/5.3 ms, flip angle = 12°, 488Hz/pixel receiver bandwidth, 256x256 matrix). SWI data was acquired using an 'in-house' developed fully flow compensated 3D acquisition (SPGR, TE/TR=20/30ms, flip angle=30o 2mm slice thickness, 256x512 matrix, 64 slices, 1NEX, ASSET=2, no fermi filter and no grad warp). Reconstruction of SWI was done according to Haacke 3.
For analysis all data was first converted to NIFTI. FAME images were skull-stripped and transformed to the MNI-27 template using the auto_tlrc function in AFNI 4. SWI processed data were co-registered and processed similarly. The AFNI command 3dAnova, with significance level α = 0.001 was used to determine regional SWI signal differences between groups. For each image voxel, an F-statistic, p-value, and the square root of the mean sum of squares due to treatment effect (MSTR) was calculated. Significant voxels were grouped into clusters and sizes noted. Voxels with touching edges were considered part of the same cluster, but not if their corners touched. Additionally, the cluster positions were cross-referenced with the MNI-27 atlas to determine overlap with anatomical regions. The amount of overlap for each cluster and anatomical region was calculated as the number of overlapping voxels divided by the total number of voxels within the cluster. To compensate for multiple comparisons, false discovery rate (FDR) was determined for each cohort and cluster sizes were adjusted using a scaling factor of (1-FDR), for each MS cohort, to give FDR-corrected sizes.
Results
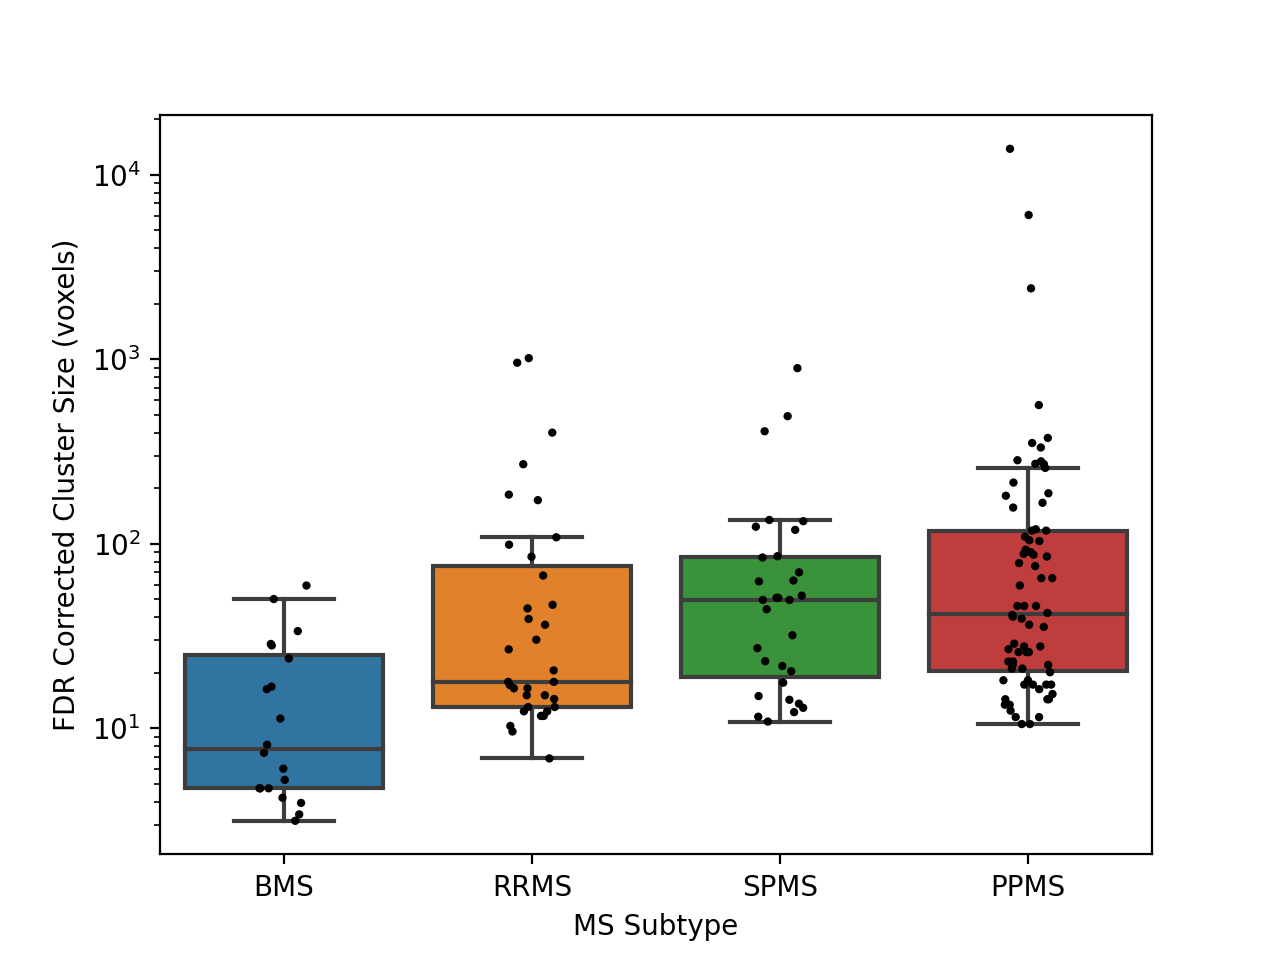
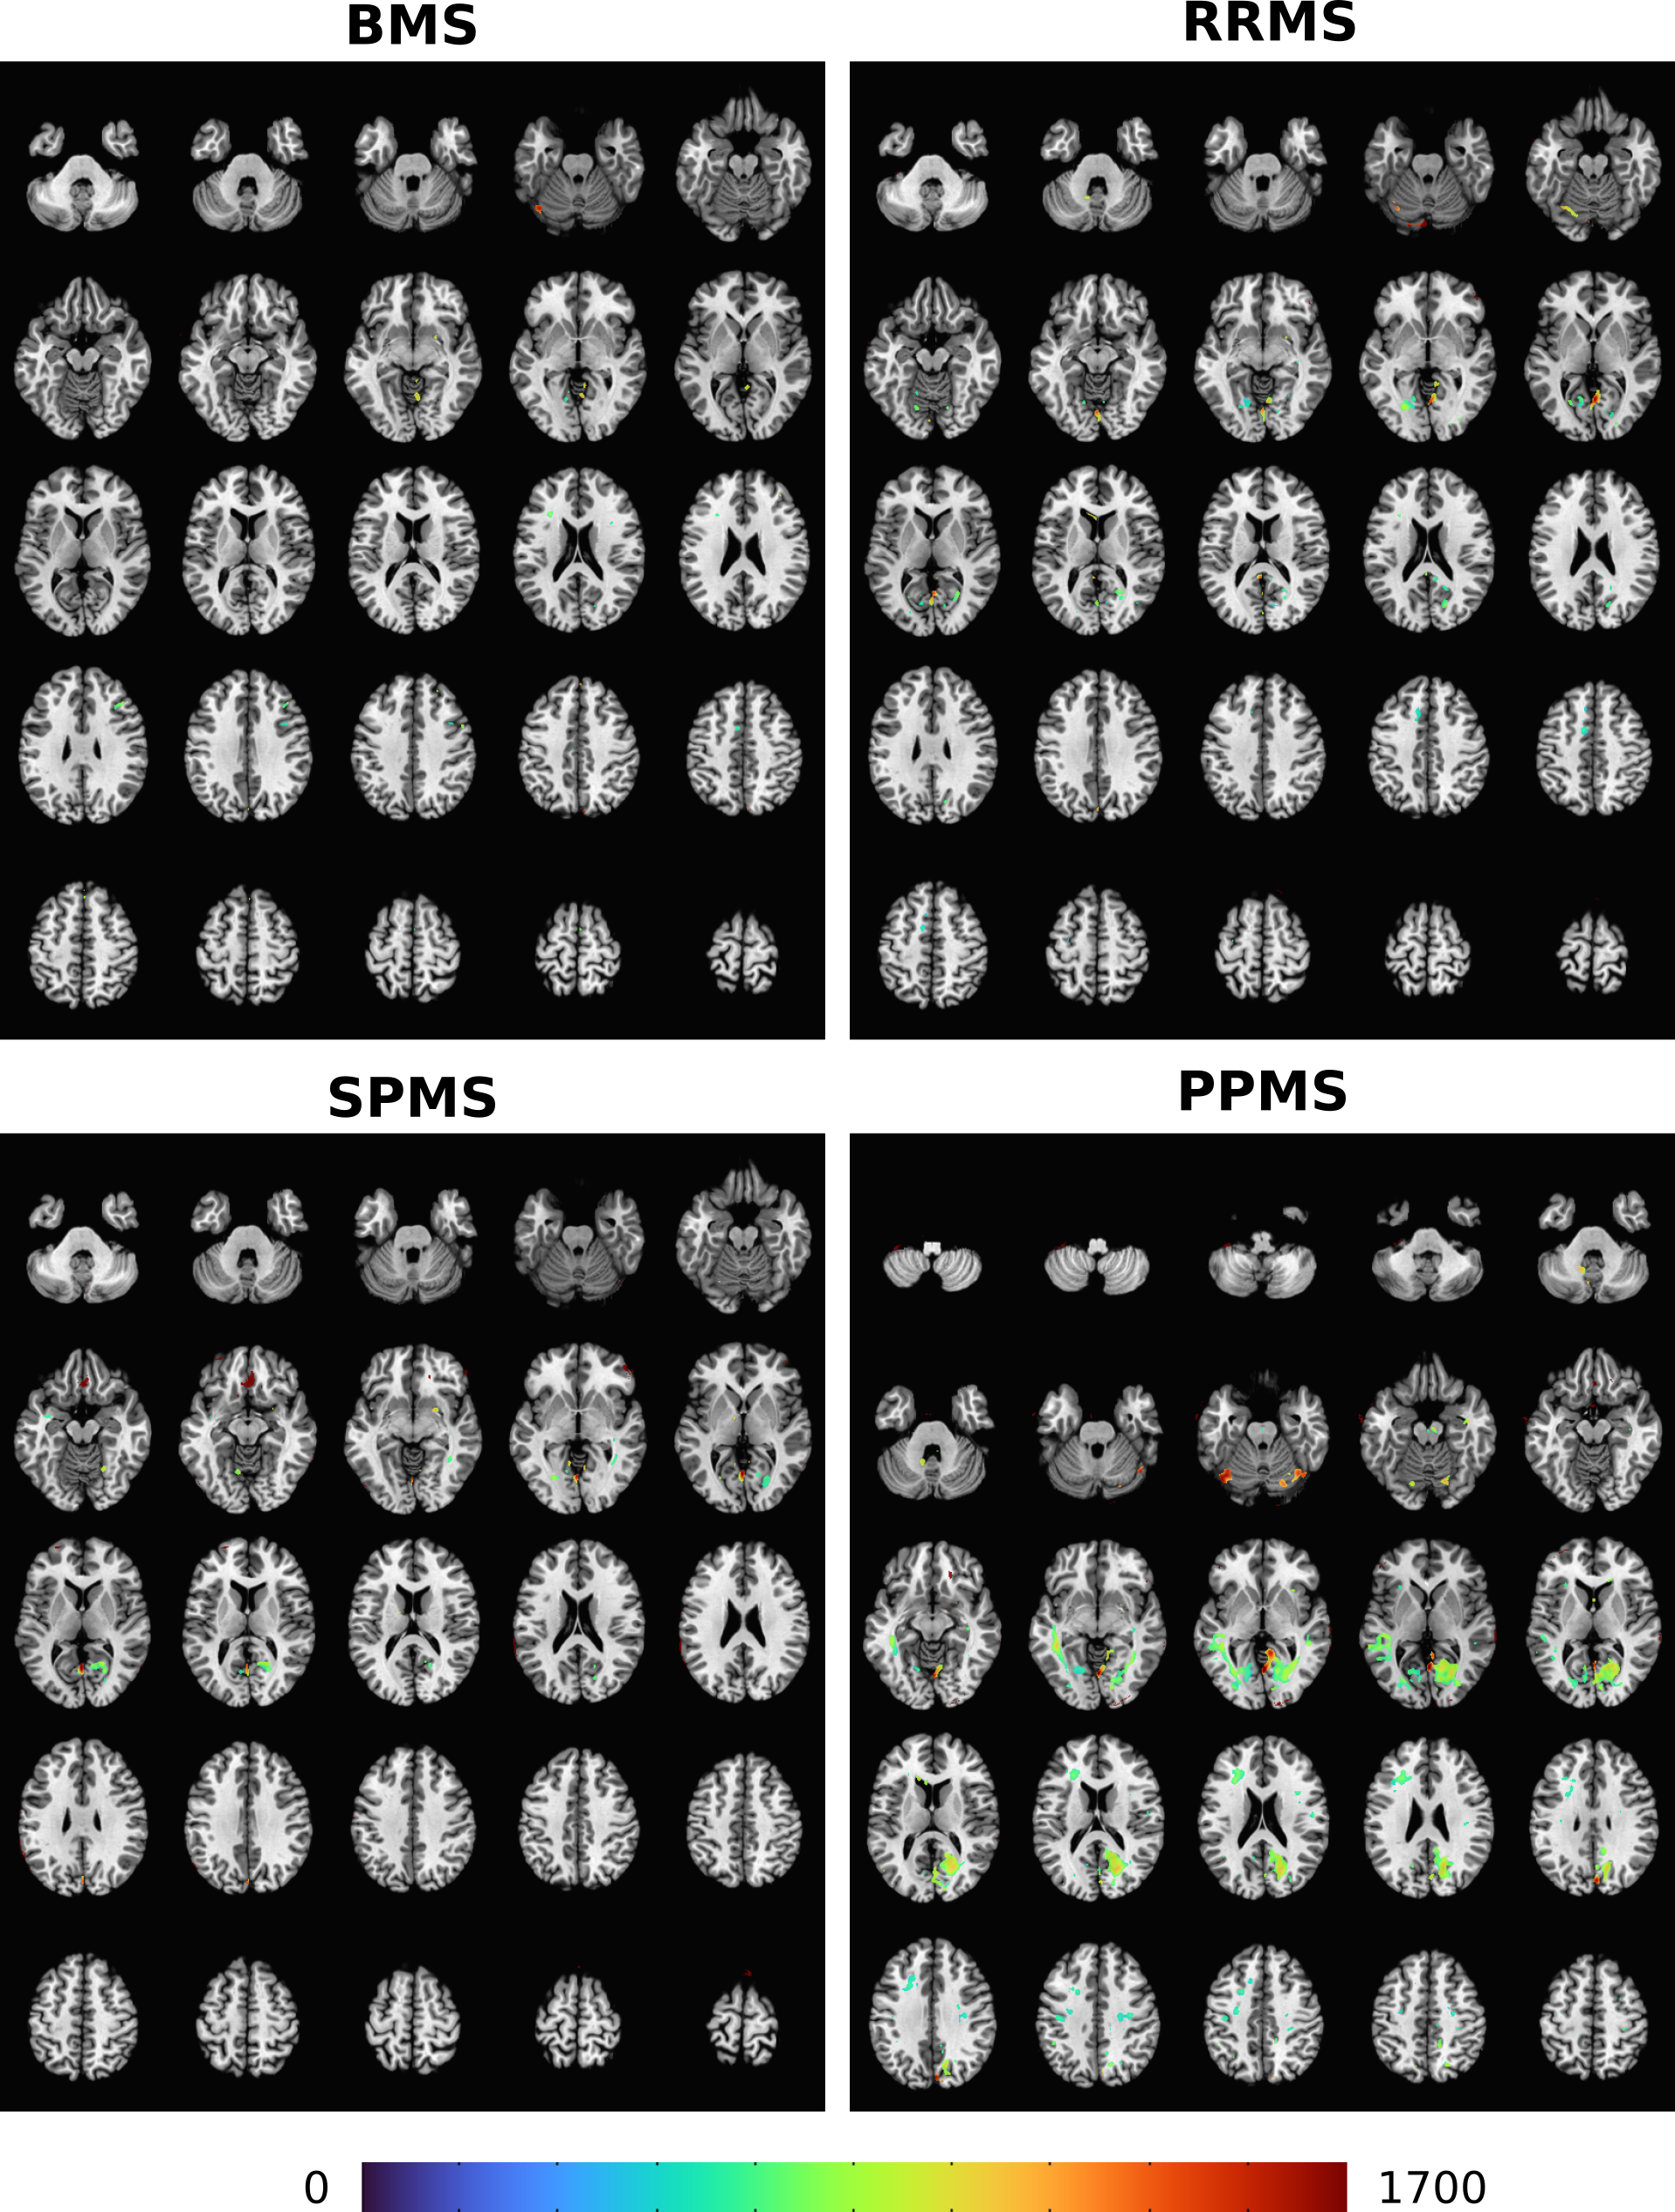
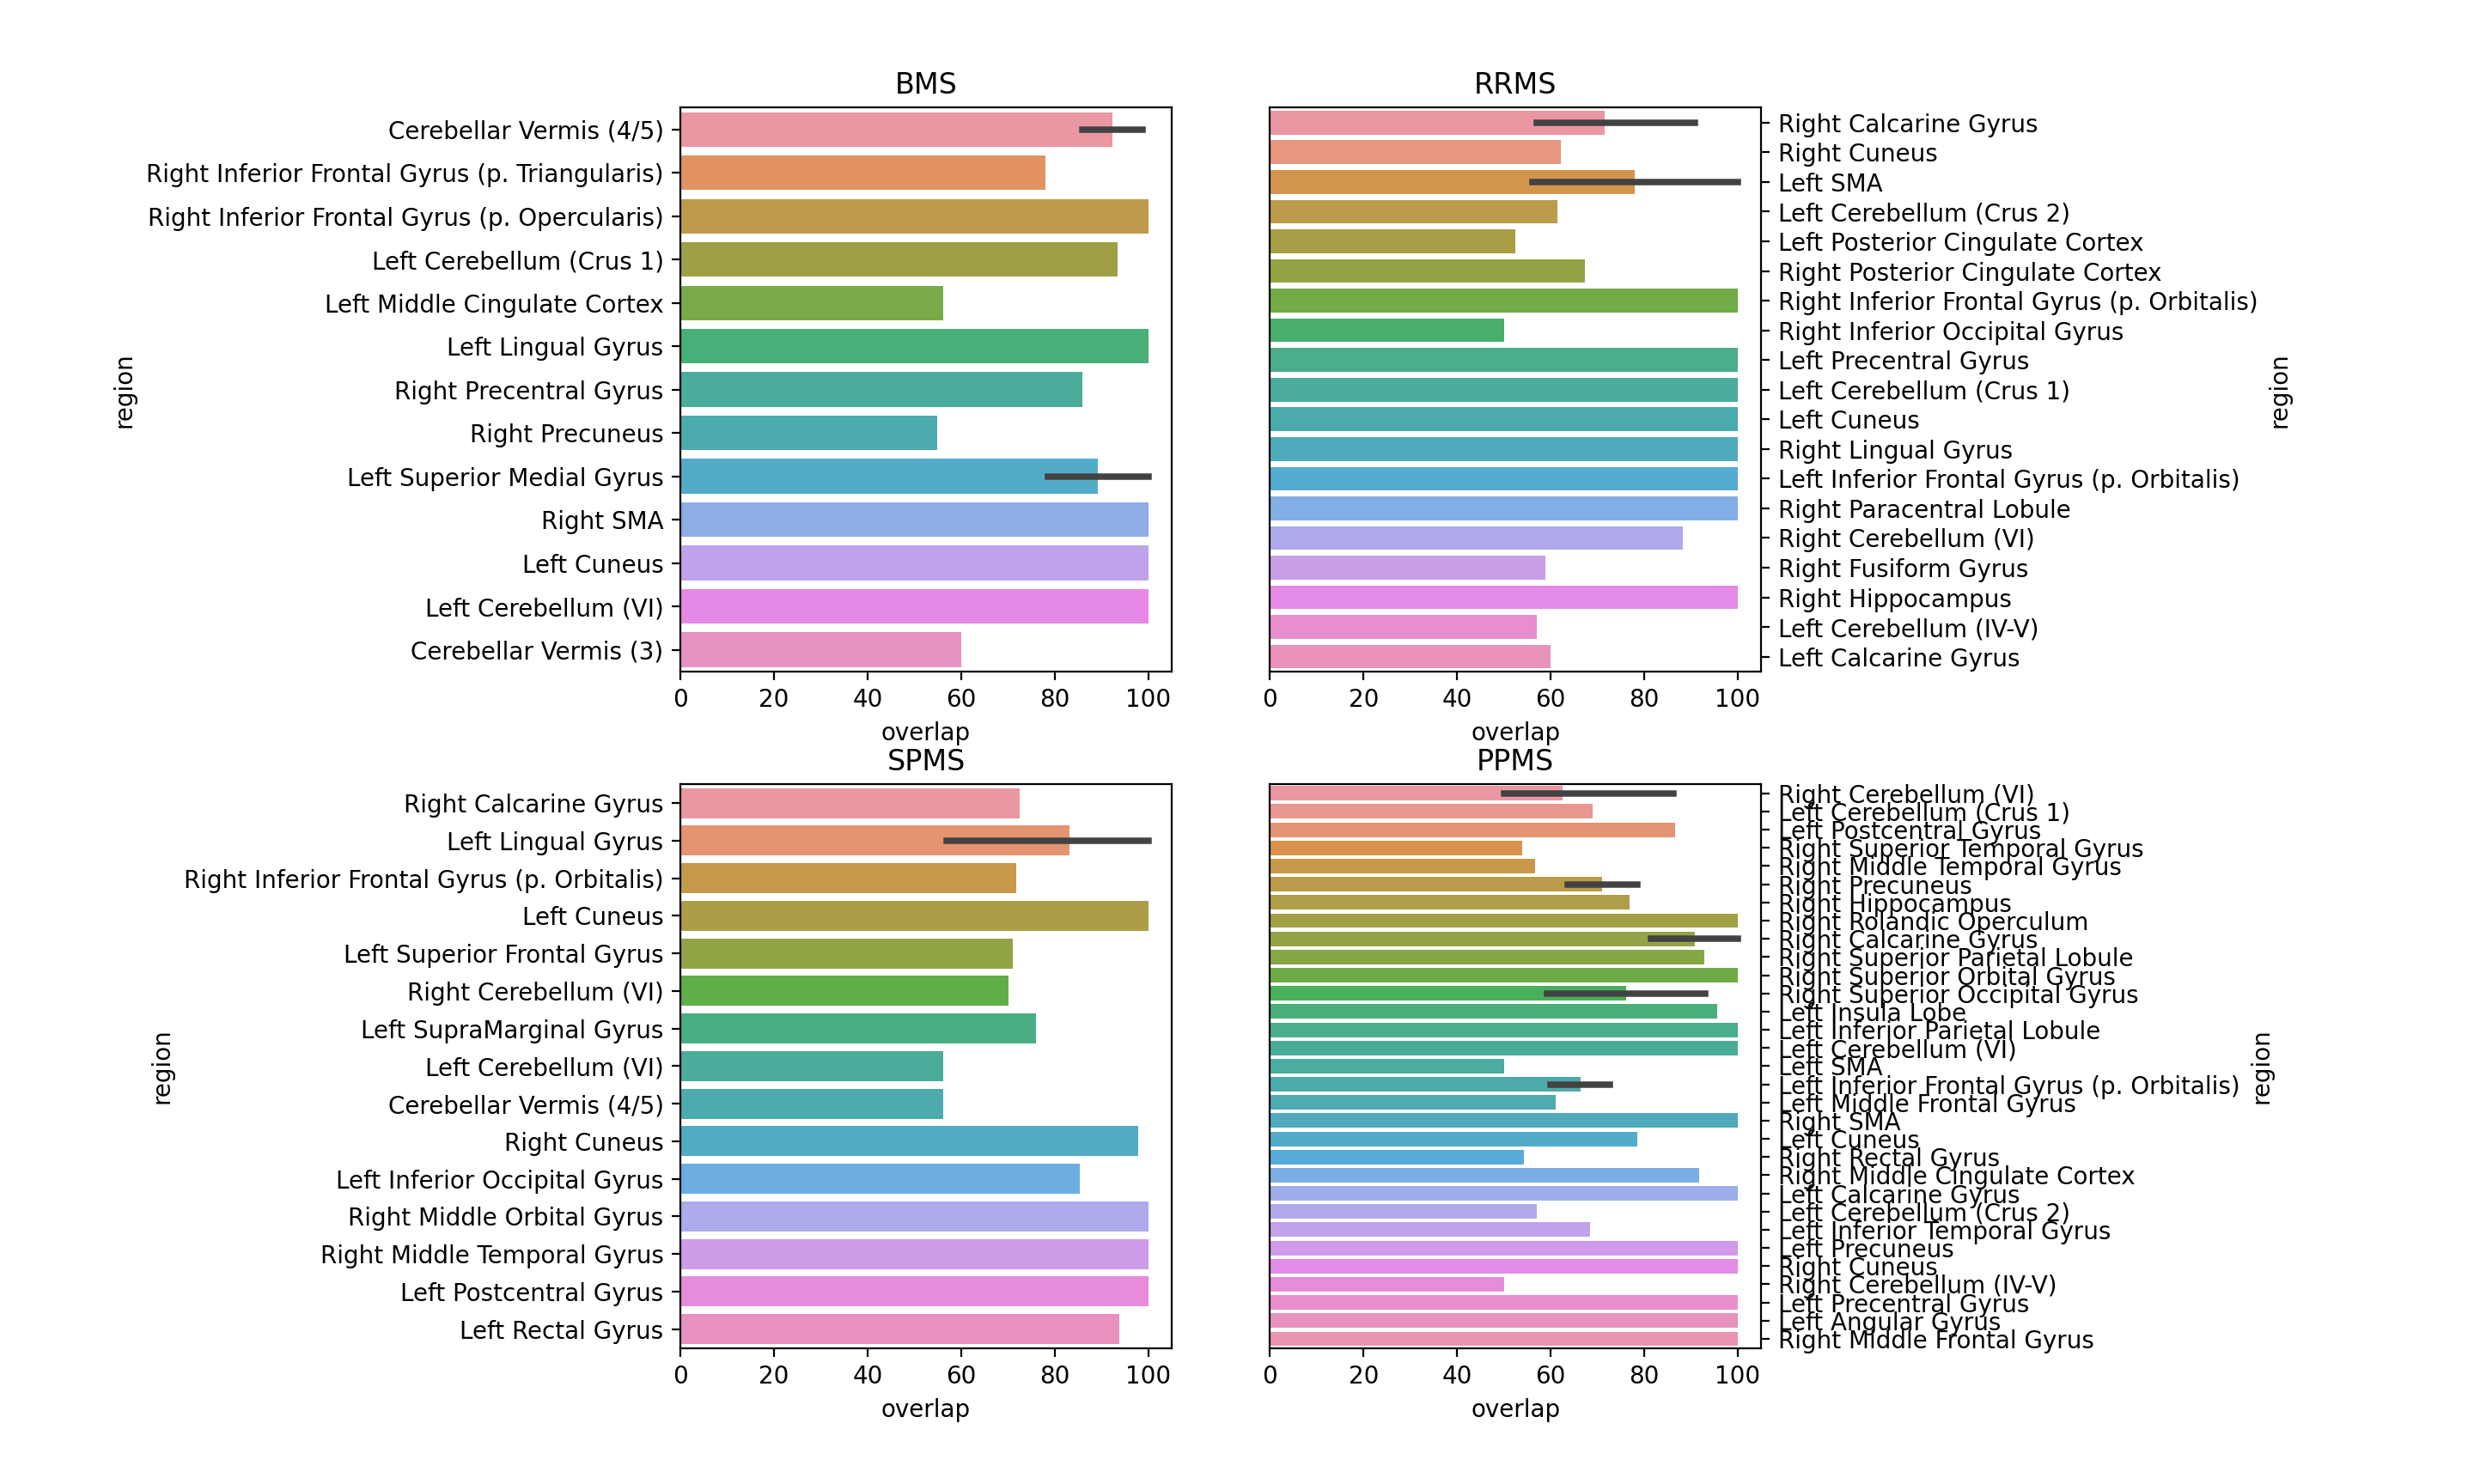
Subjects with PPMS exhibited significantly larger cluster sizes (Fig.1) and notably the most significant number of significantly different brain areas, compared to other MS subtypes (relative to controls) (Figs.2,3). While subjects with SPMS exhibited smaller clusters than those with PPMS, the clusters were situated in many of the same brain regions (Figs.2,3). The cluster sizes varied in a similar spatial pattern, but the largest SPMS cluster size was approximately 25% relative to the largest seen in PPMS. Subjects with RRMS had clusters in a larger variety of locations (Figs.2,3). Finally, BMS patients exhibited clusters of smallest size but anatomically in similar areas as other subtypes. It was clear that the number of significantly affected brain regions correlated with the subtype severity (Fig.3).Discussion and Conclusions
SWI is well known to be sensitive to regional anatomical iron content. Here we show how reduction in SWI signal, assumed to be related to local iron content, correlates with MS severity and subtype. Worsened MS subtype appears characterized by increasing numbers of affected brain regions, most likely reflective of significantly elevated iron, relative to healthy age/sex matched controls. Our mapping approach in future will best be repeated using quantitative susceptibility mapping (qSM).Acknowledgements
No acknowledgement found.References
[1] Polman CH, et al. (2005). Diagnostic criteria for multiple sclerosis: 2005 Revisions to the ‘McDonald Criteria, Annals of Neurol. 58(6):840-846.
[2] Kurtzke JF (1983) Rating neurologic impairment in multiple sclerosis: an expanded disability status scale (EDSS). Neurology. 33(11):1444–1452.
[3] Haacke EM et al. (2009) Susceptibility-weighted imaging: technical aspects and clinical applications, part 1Am J Neuroradiol. 30(1):19-30.
[4] Cox RW. (1996) AFNI: software for analysis and visualization of functional magnetic resonance neuroimages. Comput Biomed Res. 29(3):162-173.
Figures