2822
Quantitative multi-modal MRI shows correlations between lesion iron deposition and neuro-axonal density in progressive multiple sclerosis1NMR Research Unit, Queen Square MS Centre, Department of Neuroinflammation, UCL Queen Square Institute of Neurology, Faculty of Brain Sciences, University College London (UCL), London, United Kingdom, 2Centre for Medical Image Computing (CMIC), Department of Medical Physics and Biomedical Engineering, University College London (UCL), London, United Kingdom, 3Universitat Oberta de Catalunya, Barcelona, Spain, 4Centre for Medical Image Computing (CMIC), Department of Medical Physics and Biomedical Engineering, University College London(UCL), London, United Kingdom, 5Radiomics Group, Vall d’Hebron Institute of Oncology, Vall d’Hebron Barcelona Hospital Campus, Barcelona, Spain, 6Multiple Sclerosis Centre of Catalonia (Cemcat), Vall d’Hebron Institute of Research, Vall d’Hebron Barcelona Hospital Campus, Barcelona, Spain, 7University College London Hospitals, Biomedical Research Centre, National Institute for Health Research, London, United Kingdom, 8Department of Brain & Behavioural Sciences, University of Pavia, Pavia, Italy, 9Brain Connectivity Center Research Department, IRCCS Mondino Foundation, Pavia, Italy
Synopsis
We present preliminary results on ten patients with progressive multiple sclerosis(PMS) who underwent multi-modal MRI including quantitative magnetisation transfer (qMT), relaxometry and neurite orientation dispersion and density imaging (NODDI). We obtained metrics sensitive to iron deposition (T2*), myelin (restricted proton fraction (F)), and neuro-axonal density (neurite density index (NDI)) in lesions and brain tissues. Increased lesion T2* was related to decreased NDI in lesions and cortical grey matter. The lesion high T2* and low NDI were related to worse cognitive performance. In PMS, iron deposition from innate immune activity may lead to axonal loss and represent a future therapeutic target.
INTRODUCTION
Mechanisms leading to tissue injury in multiple sclerosis (MS) are yet not fully understood. The innate immune response from activated microglia and macrophages can contribute to myelin and neuro-axonal loss1. Progressive patients (PMS) can have chronic lesions with active microglia and macrophages2, promoting slow but relentless neurodegeneration3.Therefore, understanding the dynamic cascade of events leading to neuro-axonal damage is crucial since it can help to determine targets for future therapeutic interventions in PMS.This study used a novel multi-parametric quantitative MRI protocol to investigate pathological alterations in the PMS patients’ brains.We obtained iron deposition measures, a marker of microglia and macrophage activation, via T2* mapping4.For the myelin characterisation, we used a quantitative magnetisation transfer (qMT) model, which provides a sequence-independent parameter, the bound proton fraction (F), which has been shown to have sensitivity to demyelination. For neuro-axonal microstructure, we used neurite orientation dispersion and density imaging (NODDI)5, that provides two neurite morphology metrics: the neurite density index (NDI) and the neurite orientation dispersion index (ODI), unconfounded by cerebrospinal fluid contamination. In particular, NDI estimates the fraction of axons and dendrites within neural tissue, and is altered in MS.We aimed (i): to define the relationship between lesion iron deposition, lesion myelin content, and lesion axonal density; (ii) to define the association of iron deposition, to NDI within brain tissues, and disability.METHODS
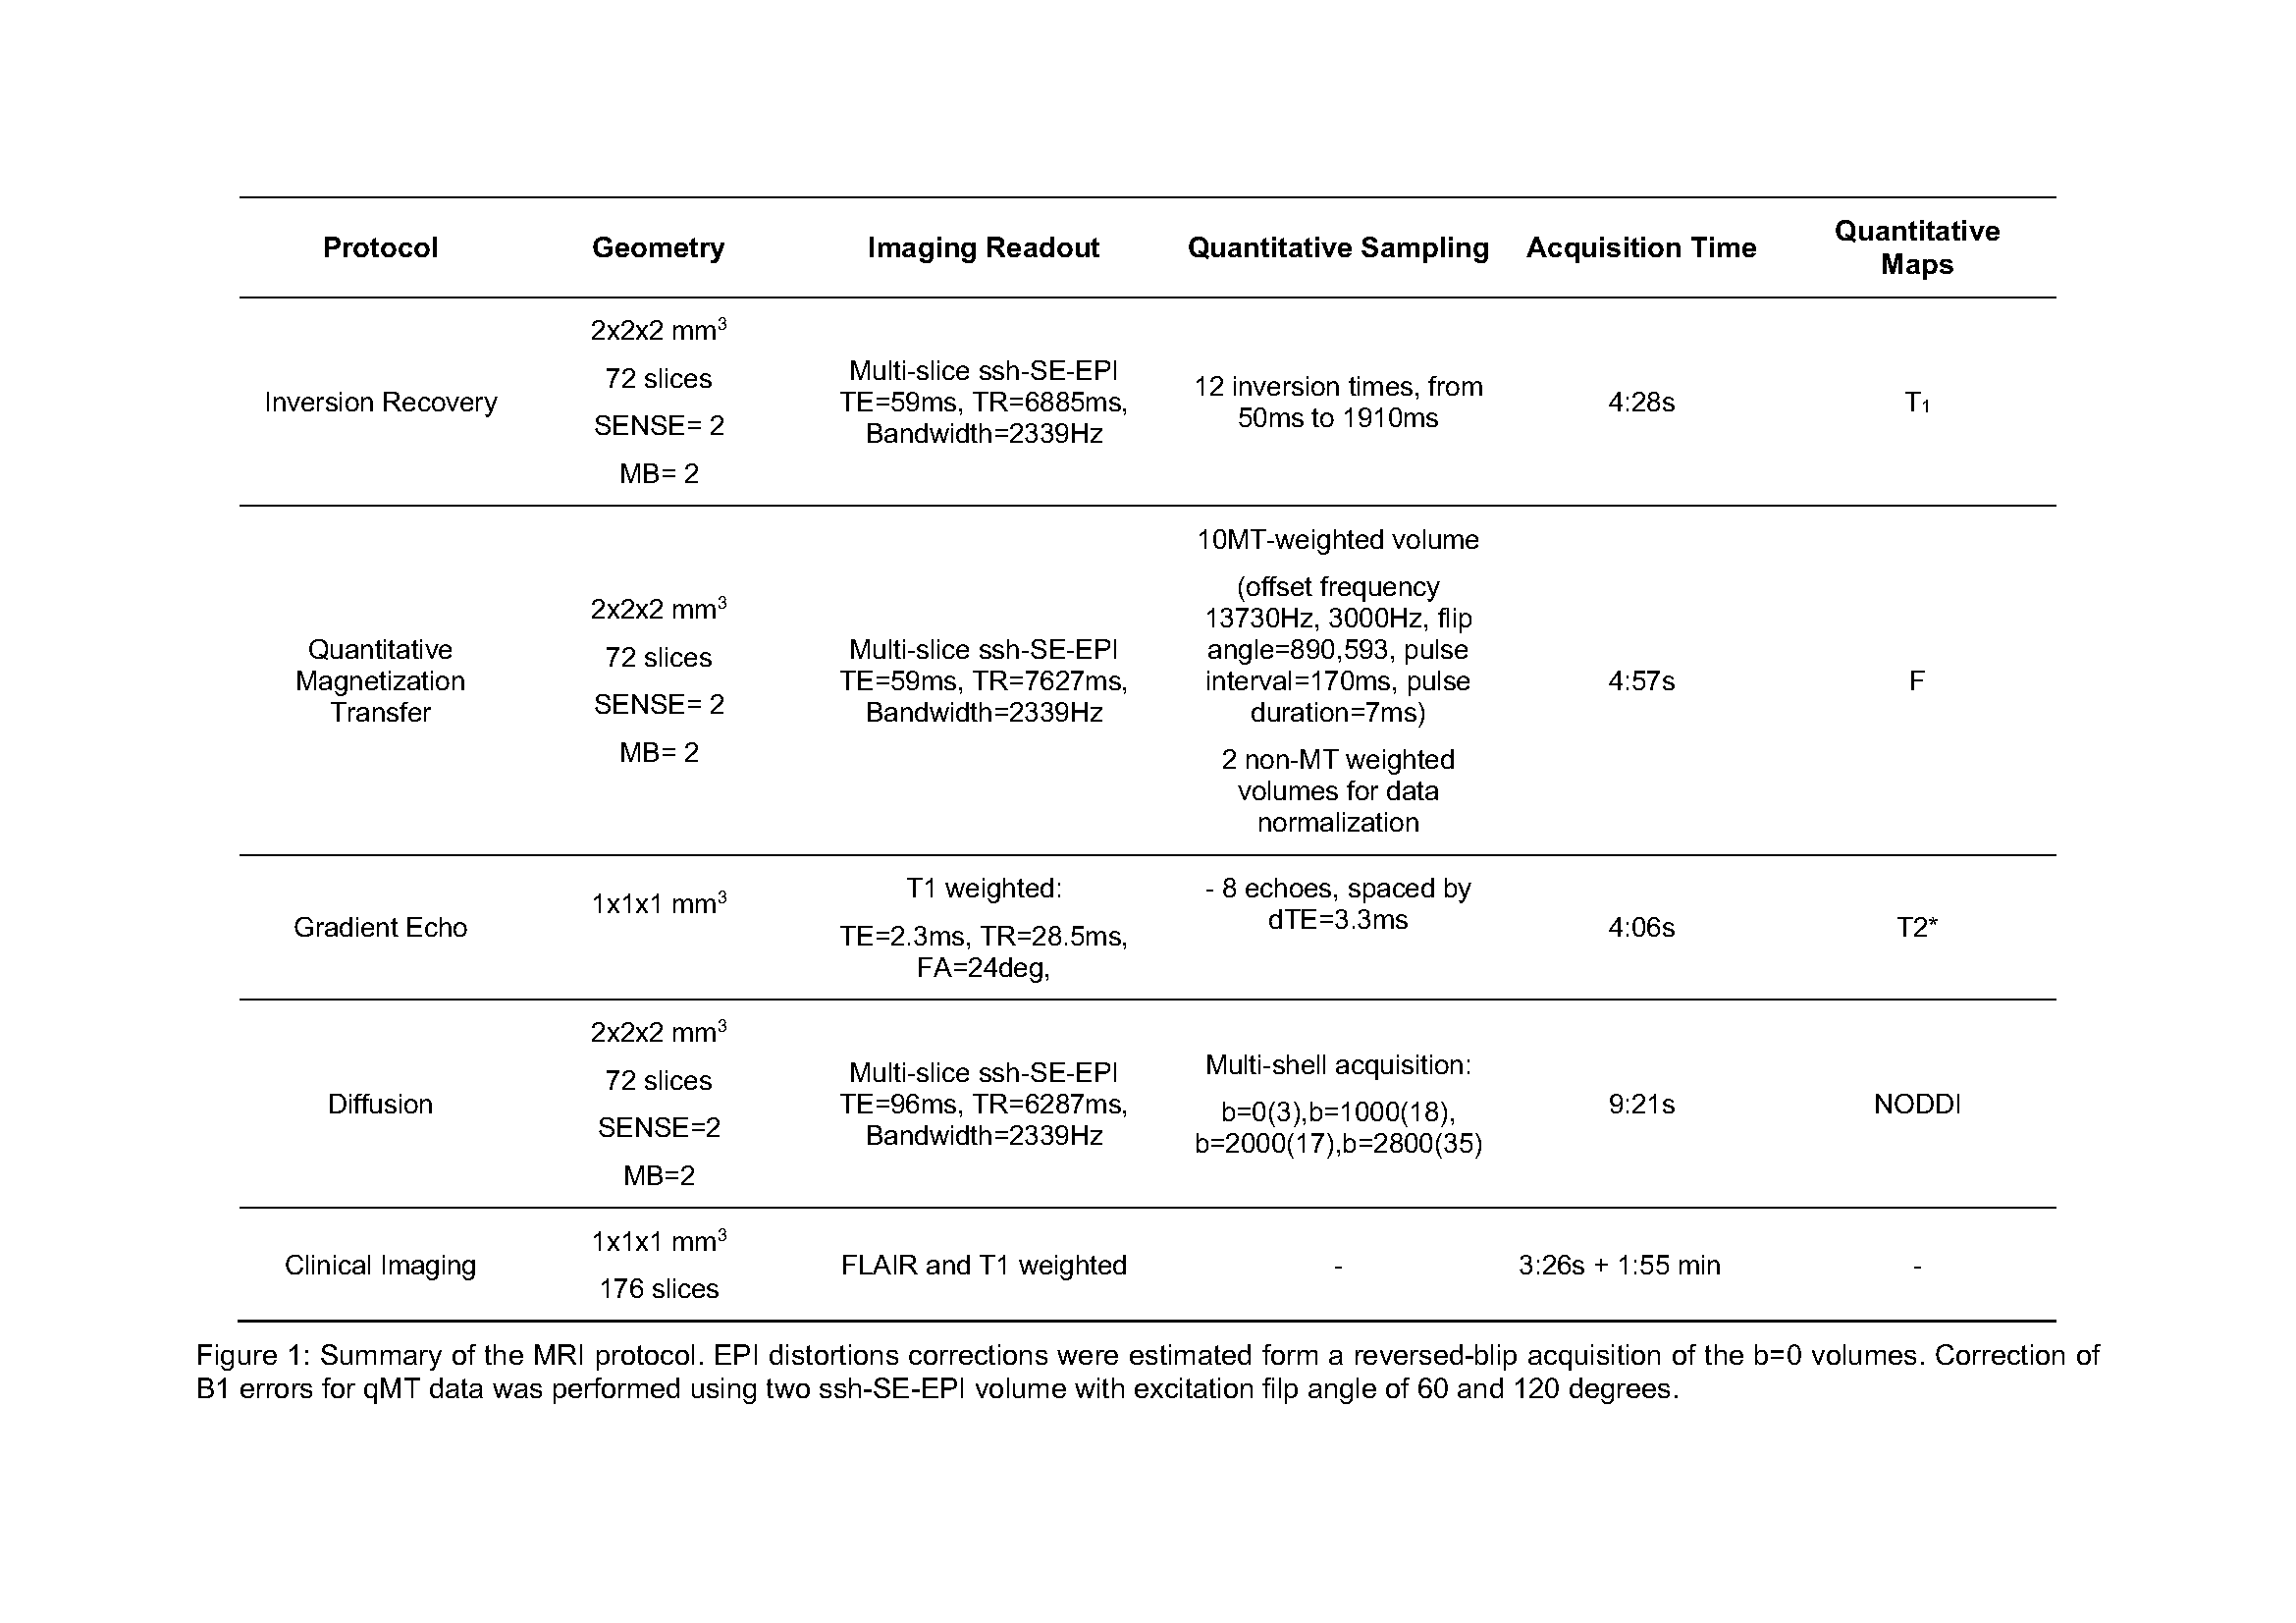
We recruited PMS patients with Expanded Disability Severity Scale (EDSS) score ≥4.0 and disability progression in the preceding two years. This is an ongoing study: we are presenting preliminary results from ten subjects.We set up the multi-modal MRI brain protocol within a clinically feasible scan time using simultaneous multi-slice MRI. Using a 3T scanner with a 32-channel head coil and a maximum gradient strength of 80Tm-1, we acquired Echo Planar Imaging (EPI)-based qMT (including B0 and B1 correction), and multi-shell diffusion MRI sequence. A multi-echo 3D spoiled gradient-echo sequence was used for T2* estimation. We also acquired 3DT1 and 3DFLAIR sequences. Sequence parameter details are given in Figure (table) 1.White matter lesions were segmented and used to fill the 3DT16 images which were then segmented into grey matter (GM) and normal-appearing white matter (NAWM)7. Tissue regions-of-interest were then co-registered to F, T2* and NDI maps via affine transformations estimated on the 3DT1 volume.Participants were clinically assessed using standard MS neurological scores for physical disability: EDSS8, Timed 25-foot Walk Test (TWT) for lower limb function, and 9-Hole Peg Test (9HPT)9, for upper limb function. We estimated cognitive disability with the Symbol Digit Modalities Test (SDMT)10.We used a paired t-test for assessing differences between lesions and NAWM in MRI metrics. We used the Pearson’s correlation test with Bonferroni correction for correlations between different MRI metrics and between MRI metrics and SDMT. We used the Spearman correlation test for correlations with EDSS.RESULTS
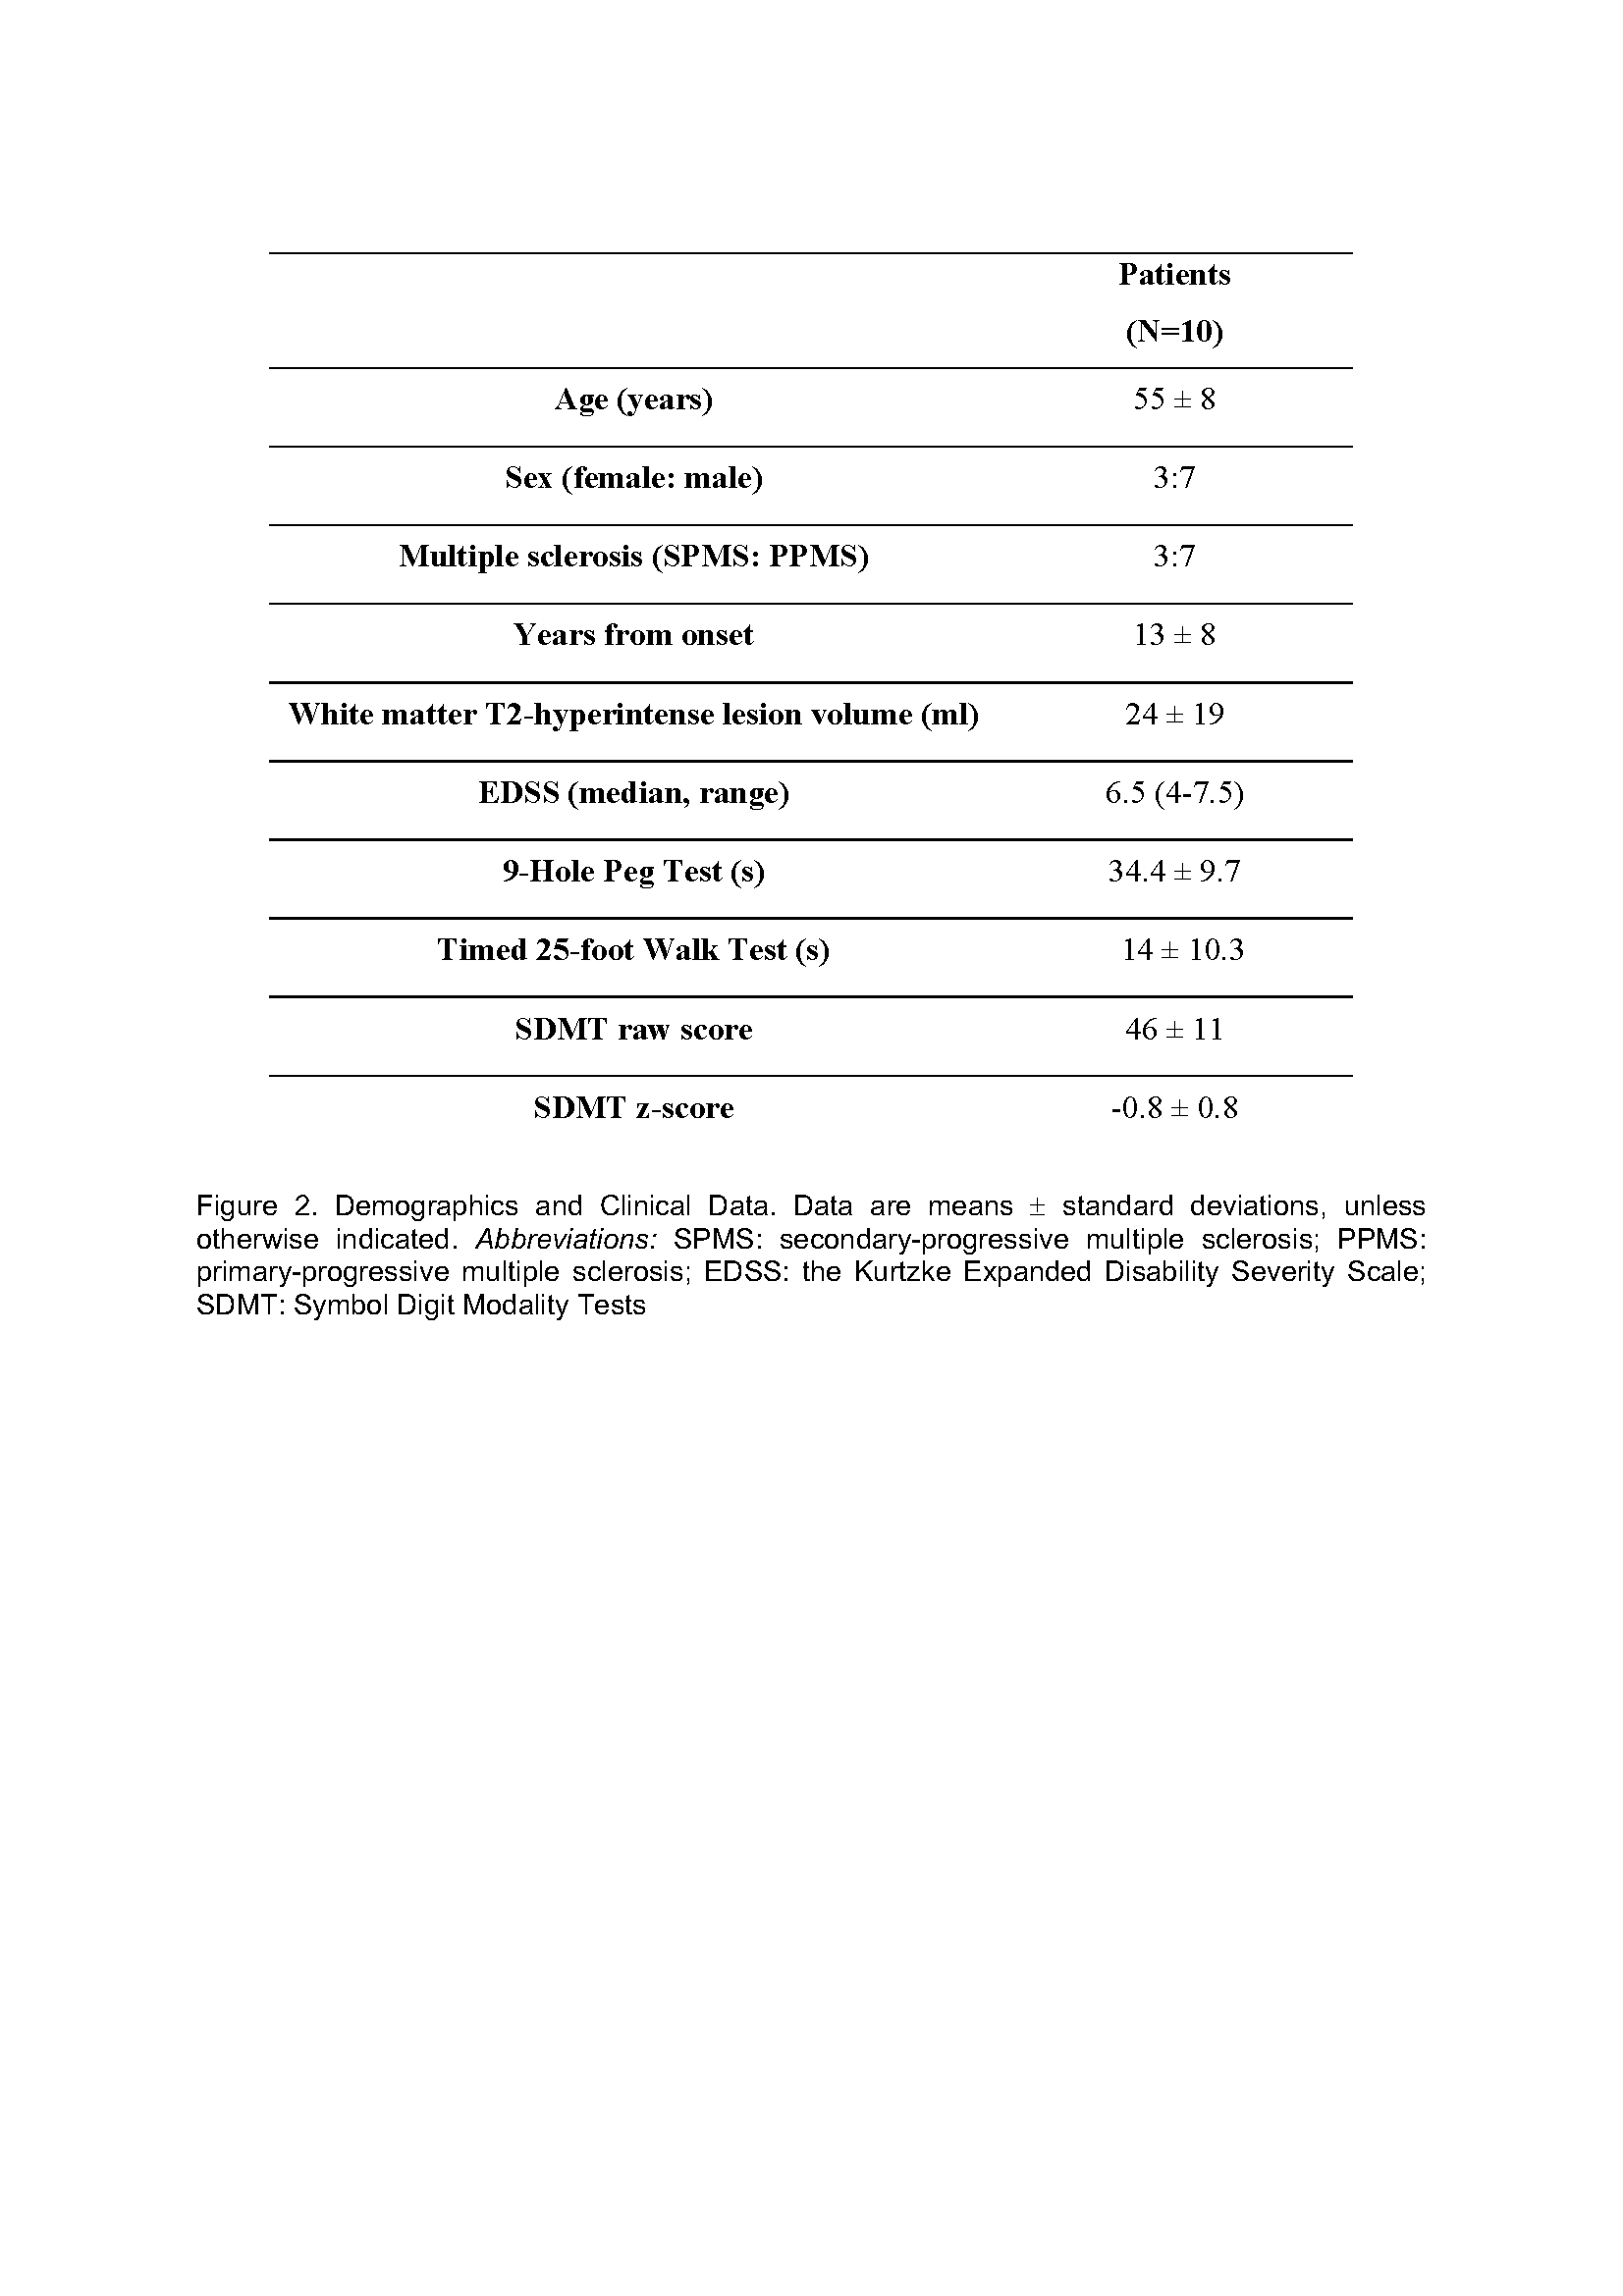
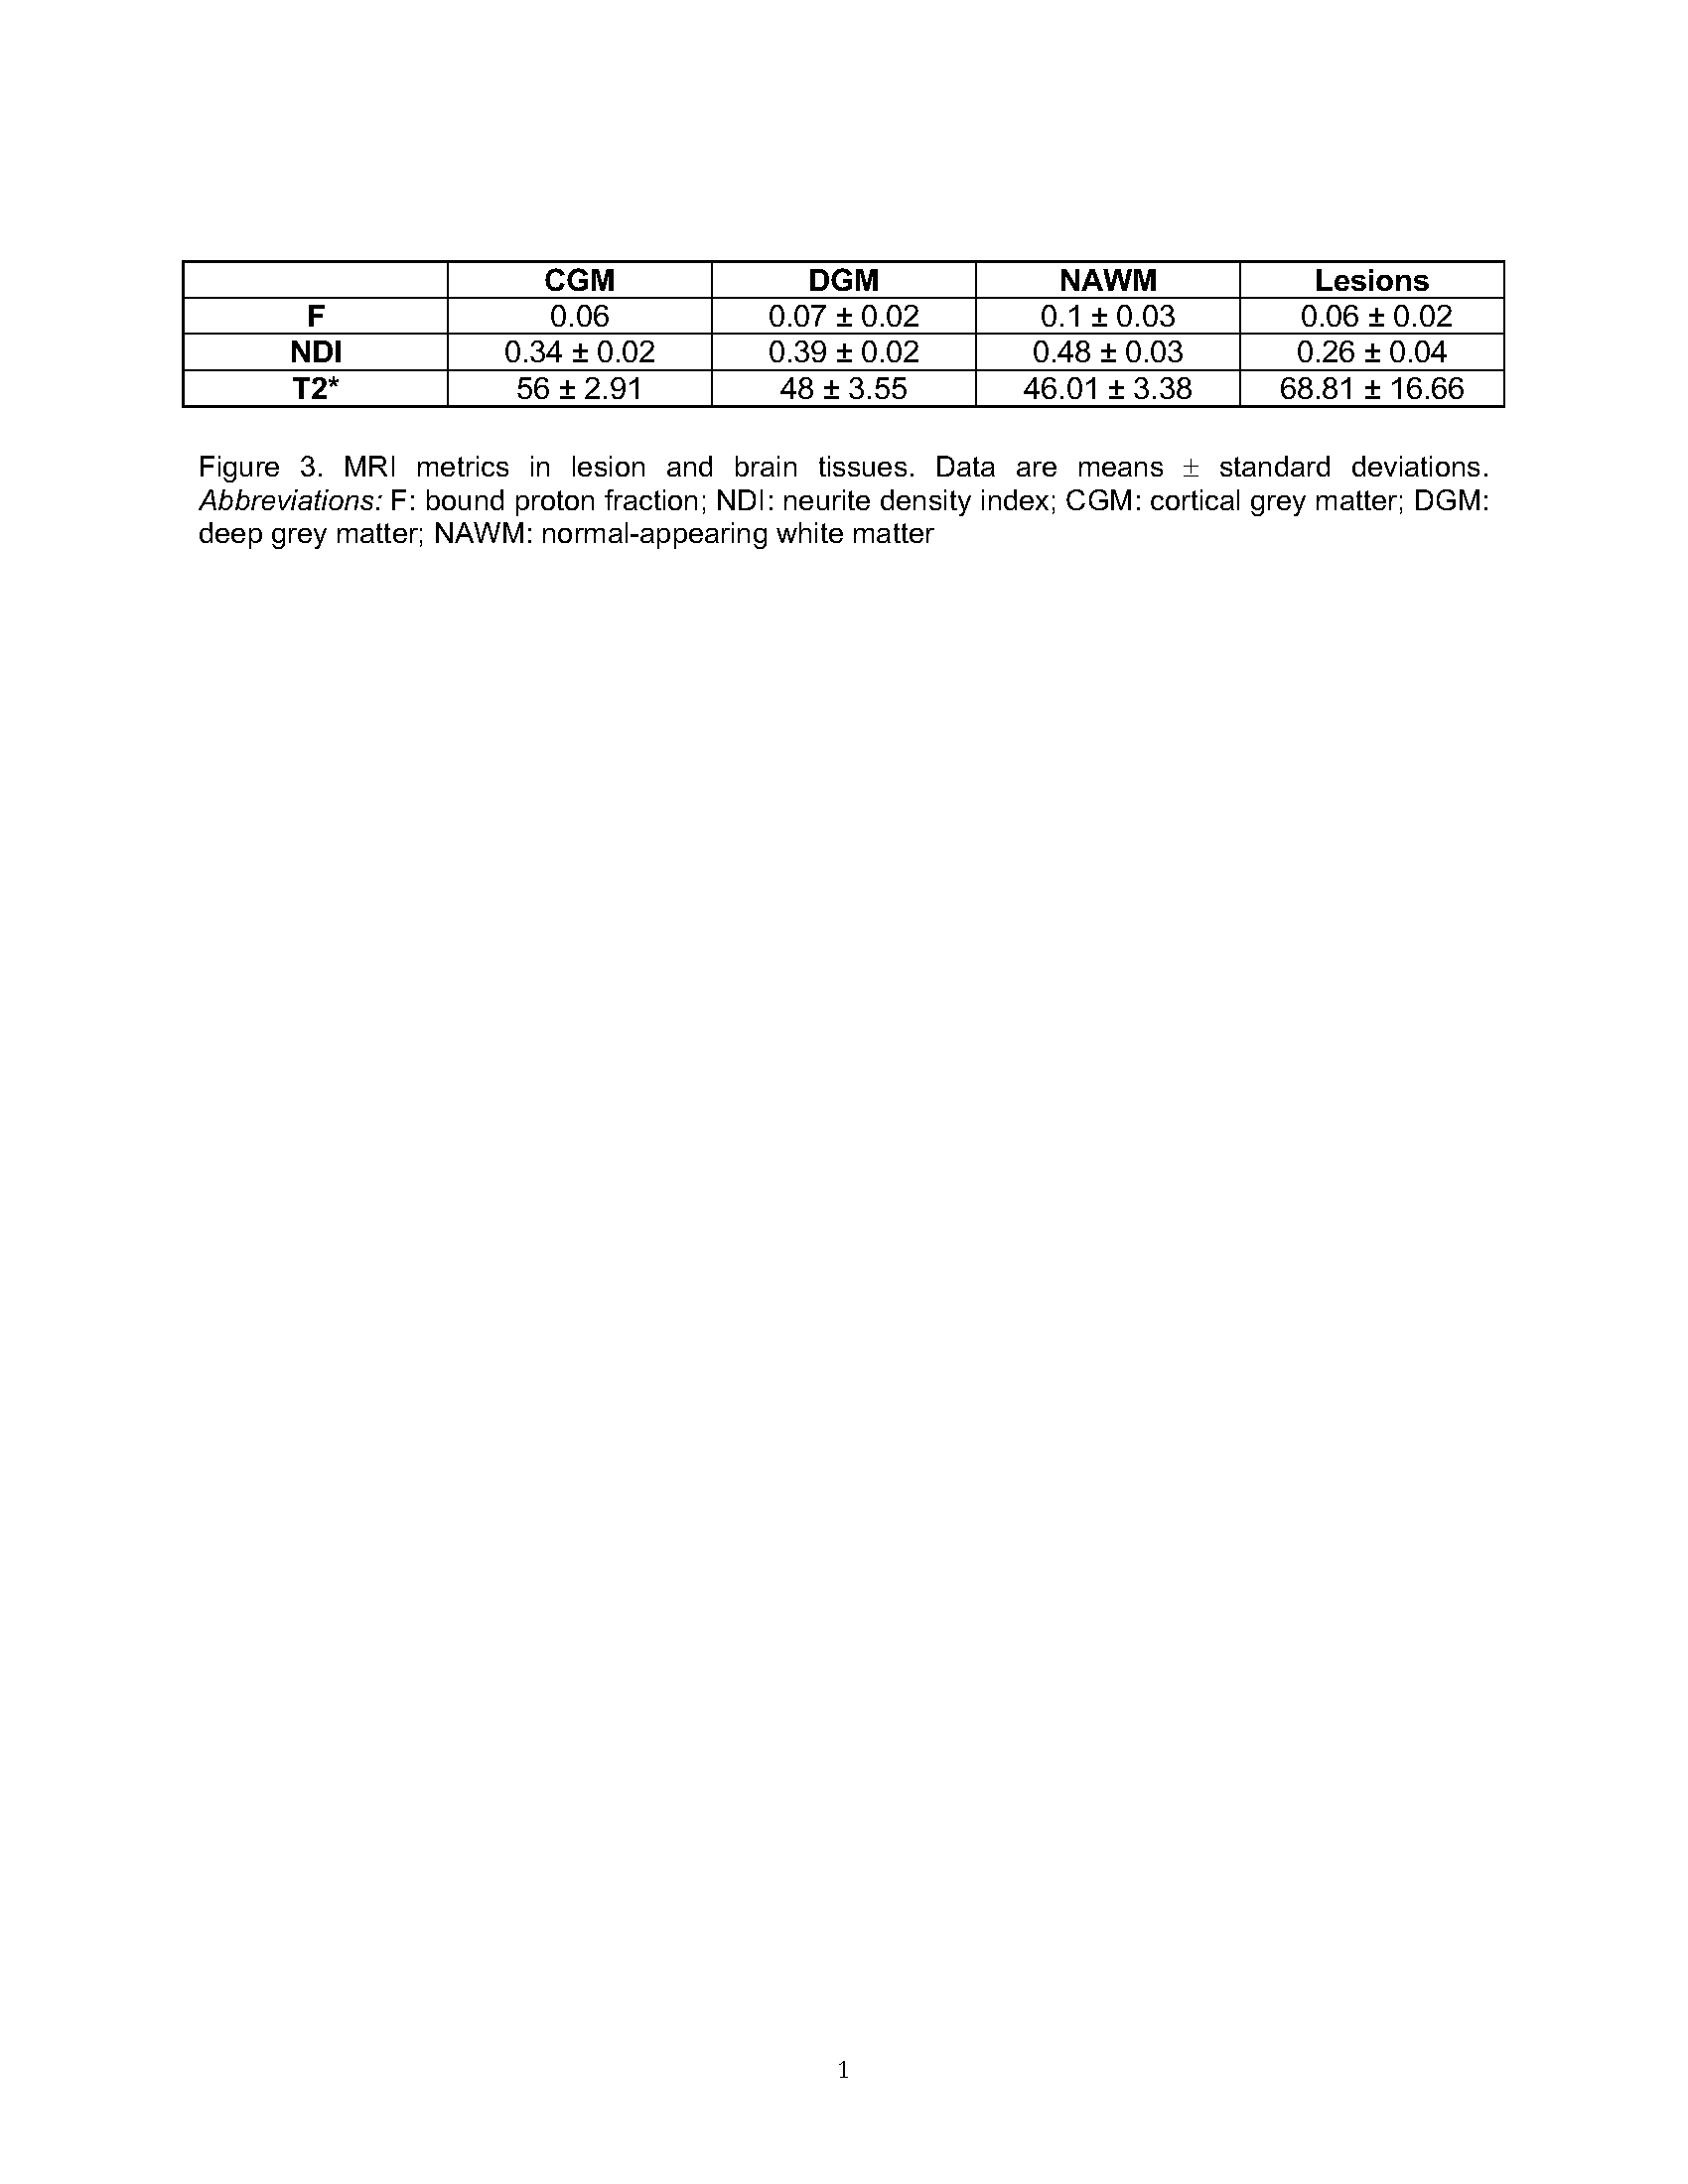
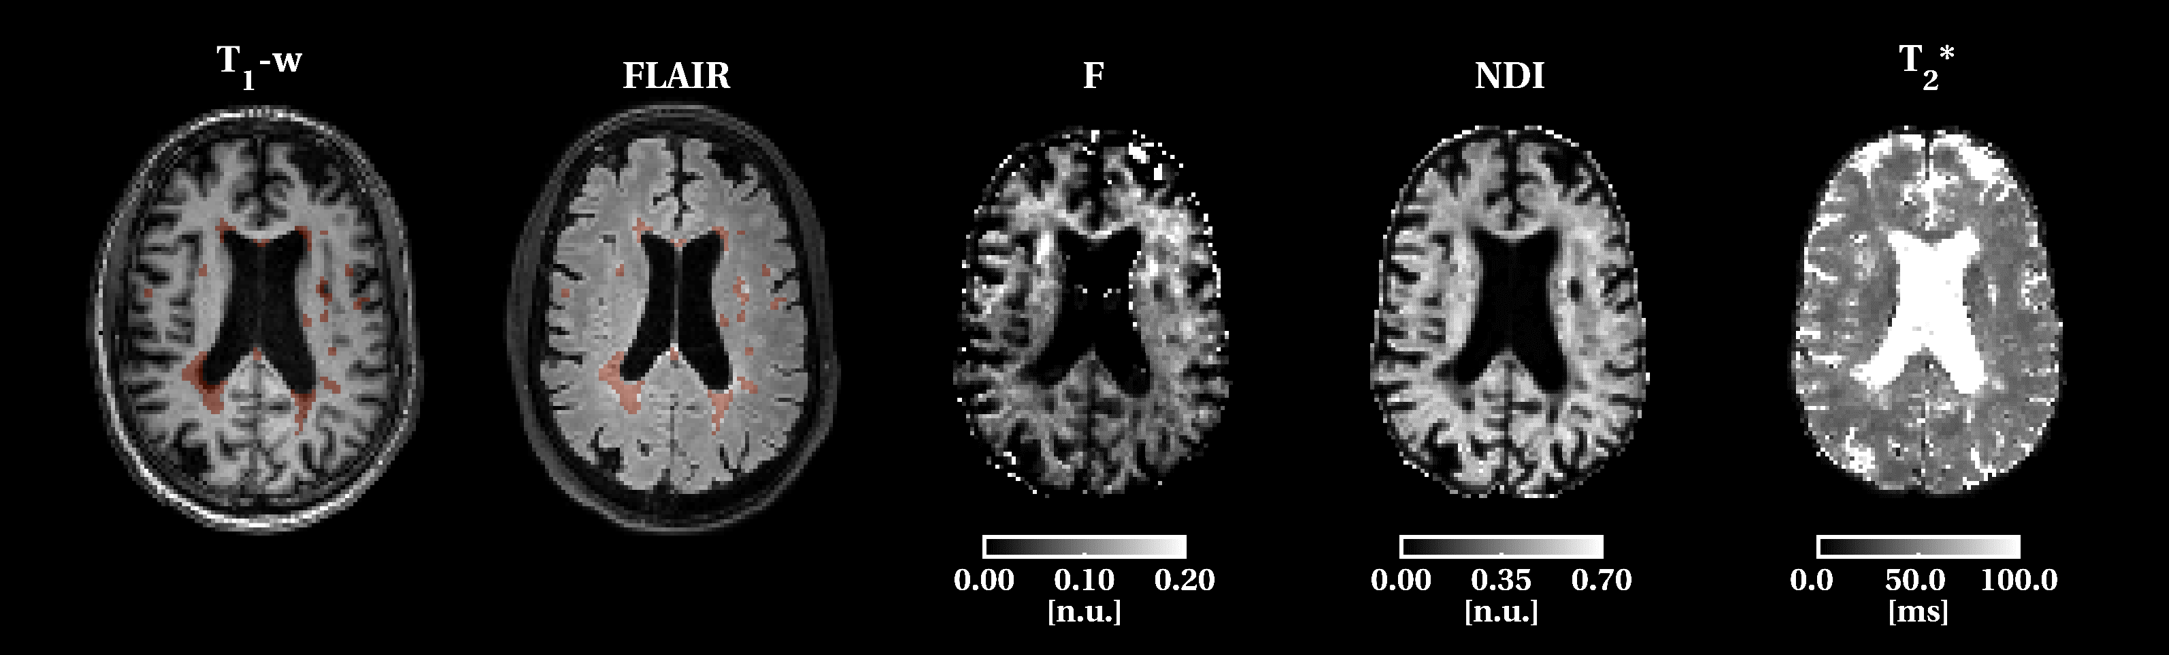
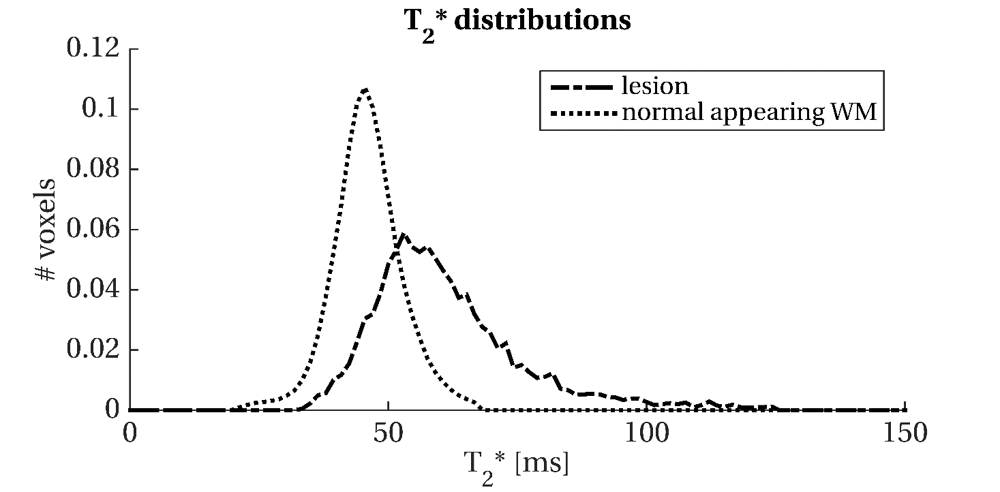
Of the ten patients with PMS (age: 55.4±8.2; female:3), seven had secondary- and three primary-progressive MS. EDSS range was 4-7.5 and SDMT average z-score was (-0.78±0.9) with one patient showing cognitive impairment (z-score <-1.5 SD)(Figure 2(Table)).Lesions had 24±19 ml volume and showed higher T2* (dif.=22.8), lower F (dif.=-0.4), lower NDI (dif.=-0.09) than NAWM (all p-values≤0.01)(Figure 3(Table) and 4).High lesion T2* was correlated with low NDI in the lesions and cortical GM (both r=-0.9, p<0.0001) but not with F.Low SDMT scores correlated with high lesion volume (r=-0.9,p=0.001), high lesion T2*(r=-0.8,p=0.002), and low lesion NDI(r=0.8,p=0.003). Only lesion volume was related to EDSS (ρ=0.76, p=0.011). Histogram analysis revealed a positively skewed distribution for T2* (Figure 5) and normal distribution for NDI values in lesions. In lesions, we found a trend in the correlation between median T2* and 9HPT (ρ=0.59, p=0.09) and we found a trend in the correlation between median T2* and EDSS (ρ=0.64, p=0.045).DISCUSSION
PMS patients showed iron deposition in the lesions, a possible marker of innate immune activity. As high lesion T2* was related to low NDI but not to F, this may suggest the association of iron deposition with axonal loss. Interestingly, lesion T2* was also correlated with low NDI in the cortical GM, suggesting possible associations between innate immune system active and neurodegeneration.Our results showed a possible correlation with cognitive function. With ten patients, we could not adjust the correlations between lesion T2* and NDI and SDMT for lesion volume, which was related to SDMT itself. Future analysis will reveal if the amount of iron deposition and axonal loss have an independent role in disability accrual.Finally, histogram analysis revealed that patients had few voxels with high T2*. This is in line with the knowledge that MS patients can have lesion heterogeneity. The fact that the median T2*, which reflected the centre of the value distribution, but not the mean T2*, had borderline associations with disability that call for future investigations.CONCLUSION
Our multi-modal quantitative MRI protocol is clinically feasible and can give insights into PMS brain pathology in vivo.Acknowledgements
The UK MS Society and the UCL-UCLH Biomedical Research Centre for ongoing support. SC is funded by Rosetrees Trust. FP was a non-clinical Guarantors of the Brain fellow and has also received honoraria from Bioclinica Inc. AC has been Guarantors of the Brain fellow and is funded by UK MS Society. BK is supported by the National Institute of Health Research Biomedical Research Centre at University College London and University College London NHS Foundation Trust. FG is currently supported by the investigator-initiated PREdICT study at the Vall d'Hebron Institute of Oncology (Barcelona), funded by AstraZeneca. CT receives the support of a fellowship from ”la Caixa” Foundation (ID 100010434). The fellowship code is LCF/BQ/PI20/11760008. OC has received funding for travel or speaker honoraria from Novartis, Roche, and Merck; she is Associate Editor of Neurology and she serves on the Editorial Board of Multiple Sclerosis Journal; she receives research support from the NIHR UCLH/UCL Biomedical Research Centre, NIHR, MS Society of Great Britain and Northern Ireland, National MS Society, Rosetrees Trust. CGWK receives funding from the UK MS Society (#77), Wings for Life (#169111), Horizon2020 (CDS-QUAMRI, #634541), BRC (#BRC704/CAP/CGW). MB, MY and RS have nothing to disclose.
References
1. Kutzelnigg A, Lassmann H. Pathology of multiple sclerosis and related inflammatory demyelinating diseases. Handb Clin Neurol 2014; 122: 15–58.
2. Calvi A, Haider L, Prados F, et al. In vivo imaging of chronic active lesions in multiple sclerosis. Multiple Sclerosis Journal. Epub ahead of print 2020. DOI: 10.1177/1352458520958589.
3. Lassmann H. Review: The architecture of inflammatory demyelinating lesions: Implications for studies on pathogenesis. Neuropathology and Applied Neurobiology 2011; 37: 698–710.
4. Ghassaban K, Liu S, Jiang C, et al. Quantifying iron content in magnetic resonance imaging. Neuroimage 2019; 187: 77–92.
5. Zhang H, Schneider T, Wheeler-Kingshott CA, et al. NODDI: Practical in vivo neurite orientation dispersion and density imaging of the human brain. Neuroimage 2012; 61: 1000–1016.
6. Prados F, Cardoso MJ, Kanber B, et al. A multi-time-point modality-agnostic patch-based method for lesion filling in multiple sclerosis. Neuroimage 2016; 139: 376–384.
7. Cardoso MJ, Modat M, Wolz R, et al. Geodesic Information Flows: Spatially-Variant Graphs and Their Application to Segmentation and Fusion. IEEE Trans Med Imaging 2015; 34: 1976–1988.
8. Kurtzke JF. Rating neurologic impairment in multiple sclerosis: an expanded disability status scale (EDSS). Neurology 1983; 33: 1444–52.
9. Fischer JS, Rudick RA, Cutter GR, et al. The Multiple Sclerosis Functional Composite Measure (MSFC): An Integrated Approach to MS Clinical Outcome Assessment. National MS Society Clinical Outcomes Assessment Task Force. Mult Scler 1999; 5: 244–250.
10. Langdon DW, Amato MP, Boringa J, et al. Recommendations for a brief international cognitive assessment for multiple sclerosis (BICAMS). Mult Scler 2012; 18: 891–898.
Figures