2821
Sub-second Accurate Myelin Water Fraction Reconstruction with UNET1Stanford University, New York, NY, United States, 2Weill Cornell, New York, NY, United States
Synopsis
We developed UNET neural network for rapid, accurate and reproducible extraction of myelin water fraction map from FAST-T2 multi-echo T2 decay data. Testing results on 109 MS brains showed that UNET shortens post-processing time to less than a second and outperforms existing multi-layer perceptron algorithm.
INTRODUCTION
Myelin water fraction (MWF) is a histopathologically validated and clinically useful biomarker of myelin loss and repair in multiple sclerosis (MS) (1-5). Efficient whole brain MWF mapping in 4.5 min is feasible with Fast Acquisition with Spiral Trajectory and adiabatic T2prep (FAST-T2) sequence using geometric echo spacing (6). However, extracting MWF map from the multi-echo T2 decay data using a spatially regularized iterative non-linear least squares (NLLS) algorithm (6) is computationally intensive and may take up to 20 min per brain. Voxel-based deep learning algorithms such as multi-layer perceptron (MLP) have been developed to provide fast parametric fitting (7). We postulate that convolutional neural networks (CNN) can improve the prediction performance by learning the inherently rich spatial pattern in the multi-echo brain image data. The objective of this study was to develop a UNET architecture for fast and reliable MWF extraction and to compare it with MLP algorithm.METHODS
UNET Architecture. The CNN-based UNET consisted of an encoder which extracts characteristic features of the input image data and a decoder which reconstructs output parametric maps from these features (8). The encoder has four resolution steps, each consisting of a 3x3x1 convolution followed by a group normalization layer (GN) (9) and a parametrized rectified linear unit (PReLU). The decoder also has four steps, each consisting of a 2x2x2 upsampling layer followed by a 3x3x1 convolution and then a GN and a PReLU. The copy-concatenation connections from layers of equal resolution in the encoder path provided the necessary features for the decoder.FAST-T2 experiment. A retrospective dataset consisting of 184 FAST-T2 brain scans acquired in MS patients at 3T on Siemens Skyra scanners using a 20-channel head coil was used. Lesion masks were traced on FLAIR images. The three-pool data fitting was performed using the NLLS algorithm with L-BFGS solver to provide the ground truth labels for the six unknown model parameters (1). The dataset was split for training (50 brains), validation (25 brains), and testing (109 brains). The root mean squared error (RMSE) was used as the performance metric to compare UNET and MLP.
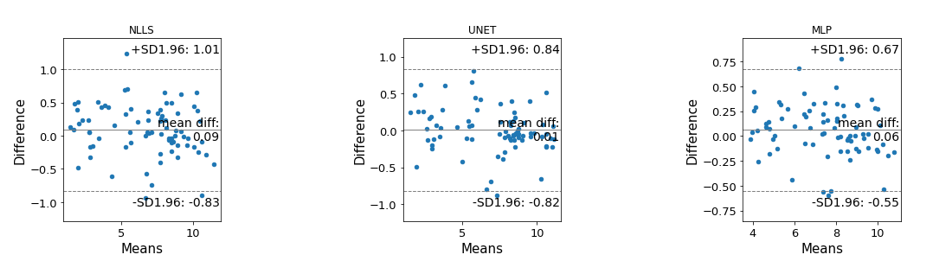
Reproducibility MRI experiment. To test the reproducibility of our algorithm, we collected 2 scans from 10 healthy volunteers using different scanner hardware (Siemens Prisma, 64-channel head coil). Region MWF values were obtained from eight regions of interests (ROI) provided by FreeSurfer parcellation: frontal lobe WM, parietal lobe WM, temporal lobe WM, occipital lobe WM, thalamus, caudate, putamen, and pallidum. Bland-Altman plots were used to assess the reproducibility of NLLS, UNET, and MLP algorithms.
RESULTS
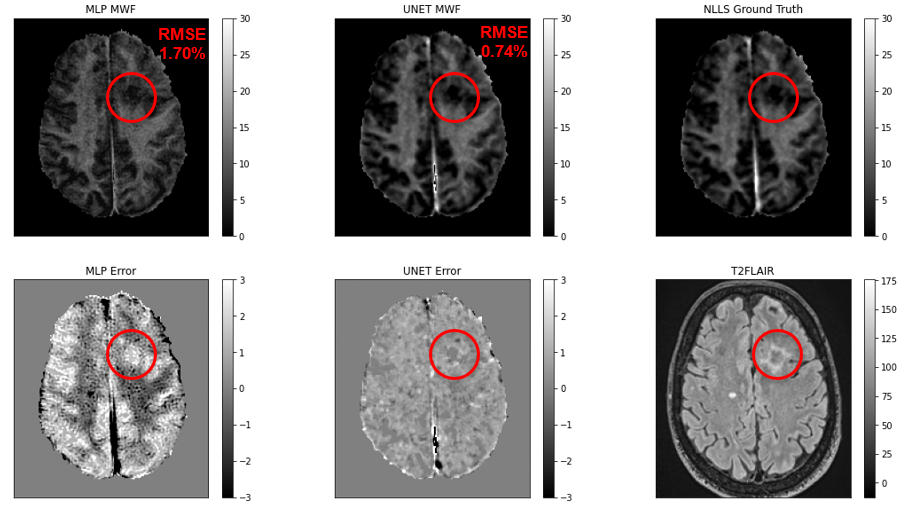
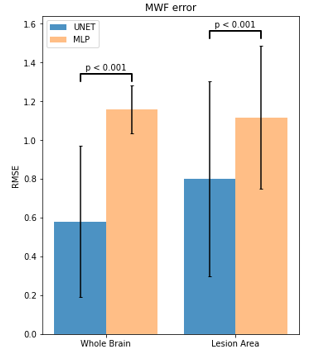
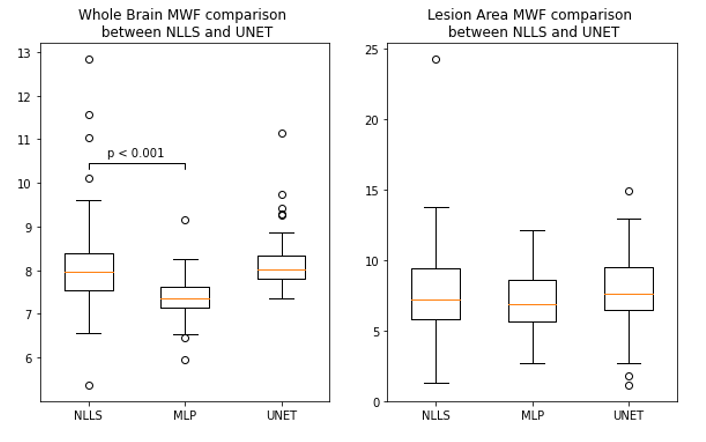
Figure 1 shows an example of predicted MWF maps obtained with MLP and UNET algorithms, demonstrating the supeior visual quality of UNET approach. In the test dataset, UNET significantly reduced RMSE by 50% over the entire brain and 28.4% in lesion voxels compared to MLP (p<0.001 for both comparisons) (Fig.2). Figure 3 shows that the mean MWF obtained by MLP was significantly different from that obtained by the reference NLLS method. UNET was found to be highly reproducible with a negligible bias (Fig.4). UNET processing took 0.64 sec per brain using GPU and 4.3 sec using CPU (including time to read/write image data) versus 0.74 sec using GPU and 2.7 sec using CPU by MLP.DISCUSSION
The proposed UNET reduces processing time by three orders of magnitude compared to the reference NLLS algorithm and produces more accurate myelin water fraction maps than the MLP algorithm. The superior performance of UNET can be attributed to its ability to learn rich spatiotemporal pattern in the multi-echo image data. The presented algorithm can be extended to the exponential fitting commonly encountered in T1, T2* and diffusion MRI.Acknowledgements
I would like to thank the Weill Cornell Radiology Lab and my family for their support.References
1. MacKay A, Whittall K, Adler J, et al. In vivo visualization of myelin water in brain by magnetic resonance. Magn Reson Med. 1994;31(6):673-7.
2. Laule C, Vavasour IM, Moore GR, et al. Water content and myelin water fraction in multiple sclerosis. A T2 relaxation study. J Neurol. 2004;251(3):284-93.
3. Laule C, Kozlowski P, Leung E, et al. Myelin water imaging of multiple sclerosis at 7 T: correlations with histopathology. NeuroImage. 2008;40(4):1575-80.
4. Kolind S, Matthews L, Johansen-Berg H, et al. Myelin water imaging reflects clinical variability in multiple sclerosis. NeuroImage 2012;60(1):263-70.
5. Nam Y, Lee J, Hwang D, et al. Improved estimation of myelin water fraction using complex model fitting. Neuroimage. 2015;116:214-21.
6. Nguyen TD, Deh K, Monohan E, et al. Feasibility and reproducibility of whole brain myelin water mapping in 4 minutes using Fast Acquisition with Spiral Trajectory and adiabatic T2prep (FAST-T2) at 3 Tesla. Magn Reson Med 2016;76(2):456-65.
7. Liu, H., Xiang, Q. S., Tam, R., Dvorak, A. V., MacKay, A. L., Kolind, S. H., Laule, C. (2020). Myelin water imaging data analysis in less than one minute. Neuroimage, 210, 116551. doi:10.1016/j.neuroimage.2020.116551 MedlinePlus. (2020, December 3, 2020). Myelin.
8. Çiçek, Ö., Abdulkadir, A., Lienkamp, S. S., Brox, T., & Ronneberger, O. (2016). 3D U-Net: Learning Dense Volumetric Segmentation from Sparse Annotation. arXiv e-prints, arXiv:1606.06650. Retrieved from https://ui.adsabs.harvard.edu/abs/2016arXiv160606650C
9. Wu, Y., &; He, K. (2018). Group Normalization. arXiv:1803.08494. Retrieved from https://ui.adsabs.harvard.edu/abs/2018arXiv180308494W
Figures