2820
Myelin Water Imaging Demonstrates Myelin Loss in Multiple Sclerosis Normal Appearing White Matter over Two Years1Radiology, University of British Columbia, Vancouver, BC, Canada, 2Neuroscience, University of British Columbia, Vancouver, BC, Canada, 3Medicine, University of British Columbia, Vancouver, BC, Canada, 4Physics and Astronomy, University of British Columbia, Vancouver, BC, Canada, 5Pathology and Laboratory Medicine, University of British Columbia, Vancouver, BC, Canada, 6International Collaboration on Repair Discoveries (ICORD), University of British Columbia, Vancouver, BC, Canada
Synopsis
Therapies that target remyelination are under development and a non-invasive specific and sensitive imaging biomarker to evaluate their efficacy within the timescale of a clinical trial is vital. Using myelin water imaging, we followed a group of relapsing-remitting and progressive multiple sclerosis (MS) participants and healthy controls over approximately 2 years to compare their rate of change in myelin water fraction. A significant decrease in mean myelin water fraction was found over 2 years in the normal-appearing white matter of participants with MS, with a larger decrease in relapsing-remitting MS than progressive MS.
Background
One of the pathologic hallmarks of multiple sclerosis (MS) is the presence of demyelinated lesions in the brain1. Histological studies also demonstrate myelin damage in the normal-appearing white matter (NAWM) of people with MS2, which is more severe in progressive forms of the disease3. Therapies that target remyelination are under development and a non-invasive specific and sensitive imaging biomarker to evaluate their efficacy within the timescale of a clinical trial is vital. One possible approach for in vivo assessment of changes in myelin is myelin water imaging (MWI), which evaluates the MRI signal contributions from the various water pools present within a voxel. In central nervous system tissue, these water pools consist of intra- and extra-cellular water, which relaxes slowly, and water trapped between the myelin bilayers, which relaxes quickly4. The fraction of water corresponding to the water trapped within the myelin sheath, the myelin water fraction (MWF), correlates strongly with gold-standard histopathological staining for myelin content5. A previous MWI study demonstrated decreases in the MWF of NAWM in a small group of relapsing remitting MS (RRMS) participants over 5 years6. However, for MWI to be useful for MS clinical trials, changes in MWF must be detectable within a shorter timeframe (such as 2 years).Objectives
To measure the MWF change over 2 years in NAWM of MS participants and to compare the rates of change in healthy controls, RRMS and progressive MS (PMS).Methods
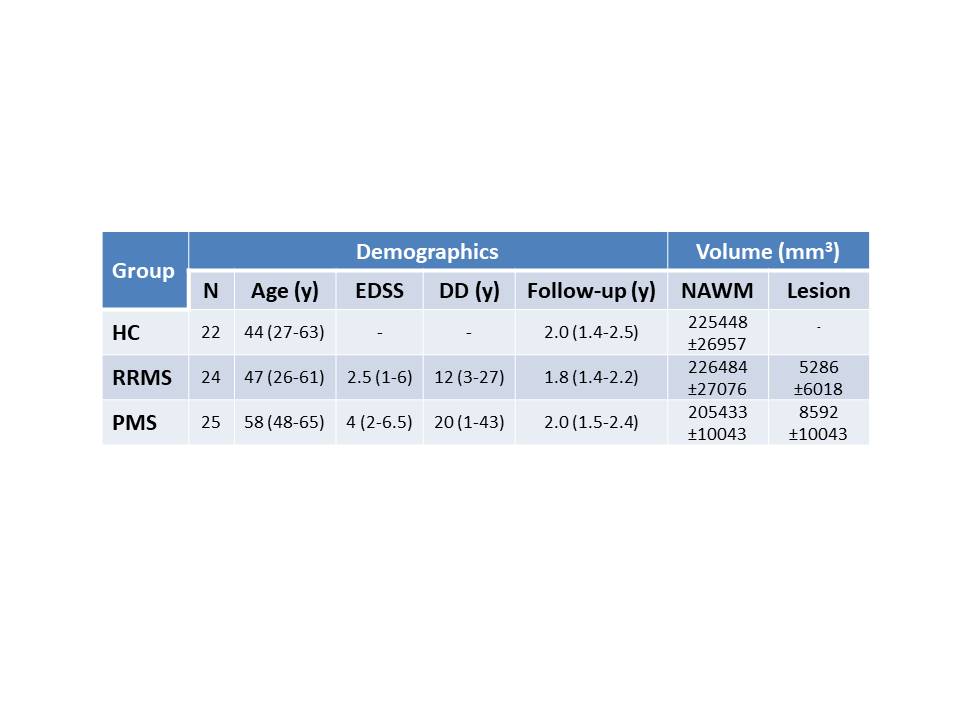
SubjectsSeventy one participants (22 controls, 24 RRMS, 25 PMS, demographics in Figure 1) were scanned at baseline and after approximately 2 years on a Philips 3T Achieva.
Data Acquisition
Scanning sequences included 48-echo GRASE T2 relaxation (TR=1073ms, TE=8ms, 1x1x2.5mm3, 40 slices, EPI factor=3)7 and 3D T1-MPRAGE (TR=3000ms, TE=8ms, TI=1072ms, 1x1x1mm3, 160 slices).
Analysis
Voxel-wise T2 distributions were calculated using a modified Extended Phase Graph algorithm combined with regularized non-negative least squares and flip angle optimization8,9. MWF was defined as the fraction of signal with T2<40ms. Baseline and Year 2 3DT1 and Year 2 GRASE images were registered to baseline GRASE images using FLIRT (FSL toolbox)10. NAWM masks were created using FAST10 on the baseline registered 3DT1. Masks were overlaid onto MWF maps to obtain mean measurements. Lesions were automatically segmented using seed points11.
Statistics
Comparisons of mean MWF over time were performed using a paired t-test. Rates of change between groups were compared with an ANOVA. Linear regressions were performed with change in mean MWF and baseline clinical variables (age, disease duration, EDSS). Significance was set to p ≤ 0.01 to account for multiple comparisons.
Results
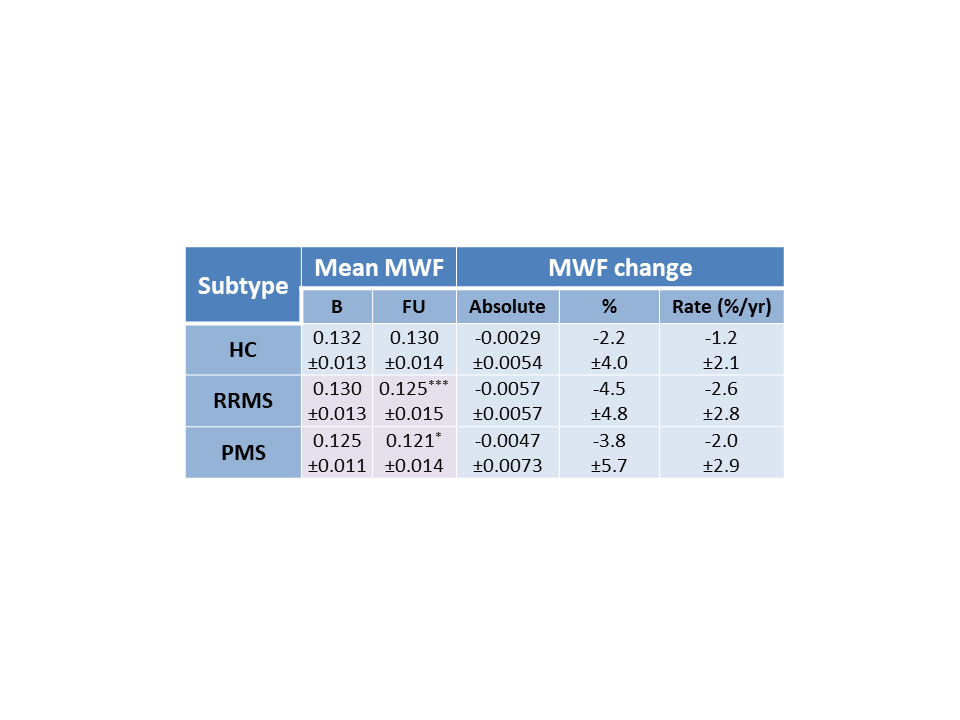
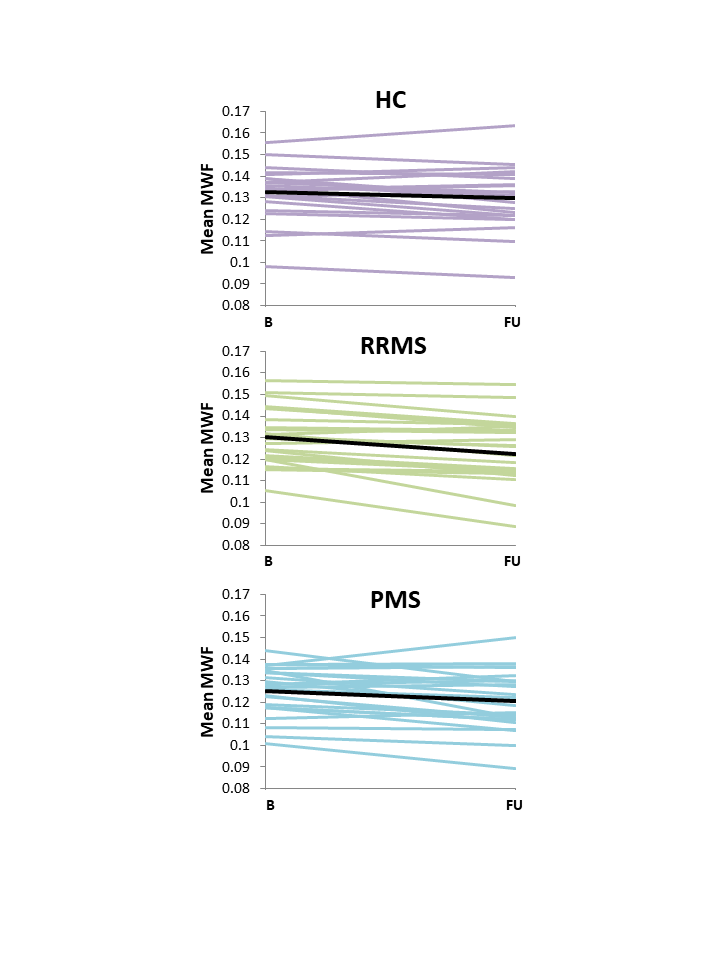
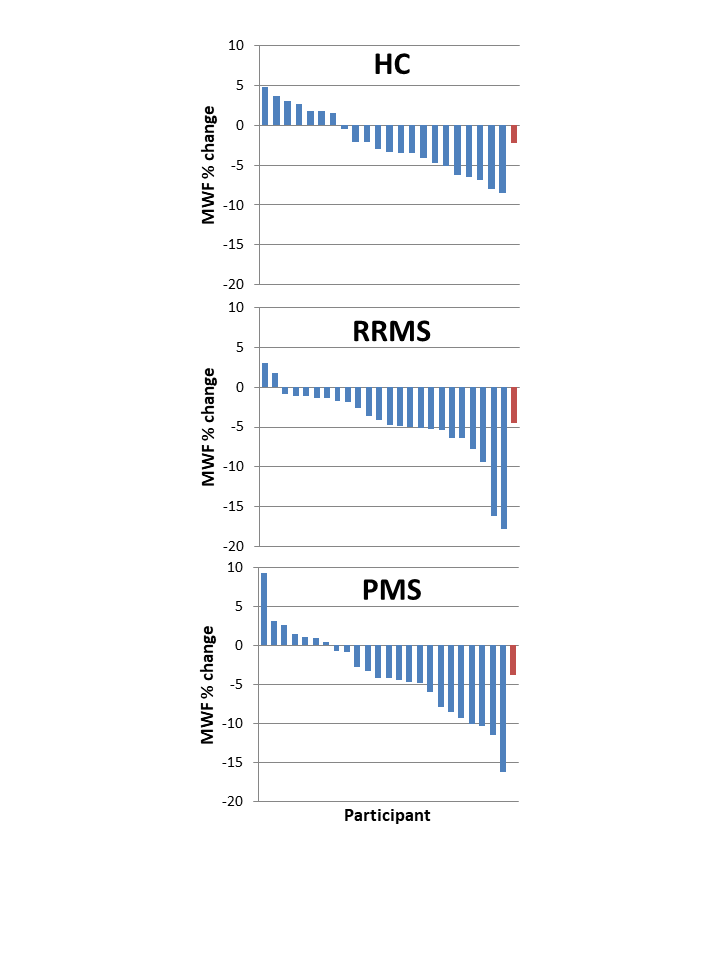
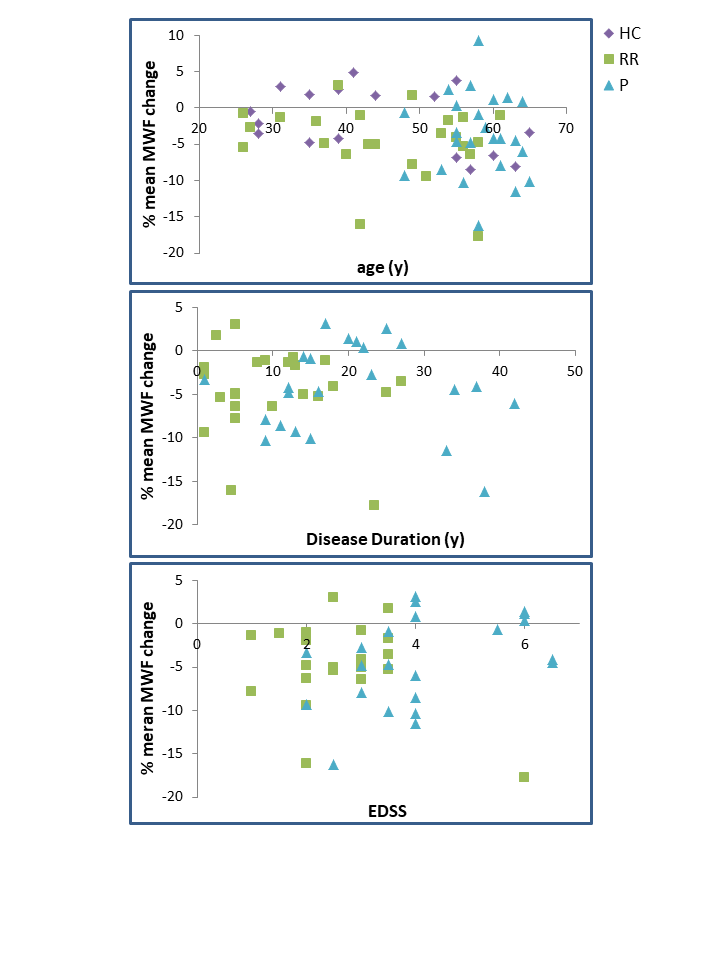
Mean MWF values at baseline and follow-up, absolute MWF change and annual rate of MWF percent change are listed in Figure 2. NAWM MWF decreased significantly over 2 years for RRMS (on average 5.8±8.7% decrease, p=0.002) and PMS (3.5±5.5% decrease, p=0.006). In controls, MWF trended toward a decrease (2.2%±4% decrease, p=0.02). Significant differences were found between NAWM volume of SPMS and controls (p=0.02) and RRMS (p=0.02) but no difference in lesion volume (p=0.17). No difference in rate of change (p=0.2) was found between the groups. The heterogeneity in MWF change within individual participants is illustrated in Figure 3 and 4. No significant correlations were found between change in MWF and baseline clinical variables (p>0.1) (Figure 5).Discussion
A significant decrease in mean MWF was found over 2 years in the NAWM of participants with MS, but not in healthy controls. RRMS showed a larger decrease than PMS. This larger decrease may be due to RRMS having more myelin to lose whereas PMS has already undergone years of subtle demyelination and therefore cannot decrease by as large a percentage. The MWF decrease in MS was not related to age, disease duration or EDSS but was larger than the decrease in controls. In the future, we plan to perform longer term clinical assessments to determine whether a change in MWF over 2 years can predict clinical progression, which often takes longer than 2 years to measure12.Acknowledgements
We sincerely thank all study participants, the staff at the UBC MS clinic and the MR technologists at the University of British Columbia MRI Research Centre. This work was funded by the Multiple Sclerosis Society of Canada.References
1. A Compston, and A Coles. Multiple sclerosis. Lancet. 2008; 372: 1502-17.
2. A Kutzelnigg, CF Lucchinetti, C Stadelmann, W Bruck, H Rauschka, M Bergmann, M Schmidbauer, JE Parisi, H Lassmann. Cortical demyelination and diffuse white matter injury in multiple sclerosis. Brain. 2005; 128: 2705-12.
3. H Lassmann. Pathogenic Mechanisms Associated With Different Clinical Courses of Multiple Sclerosis. Front Immunol. 2018; 9: 3116.
4. AL MacKay, KP Whittall, J Adler, DKB Li, DW Paty, D Graeb. In vivo visualization of myelin water in brain by magnetic resonance. Magn Reson Med. 1994; 31: 673-7.
5. C Laule, P Kozlowski, E Leung, DKB Li, AL Mackay, GRW Moore. Myelin water imaging of multiple sclerosis at 7 T: correlations with histopathology. Neuroimage. 2008; 40: 1575-80.
6. IM Vavasour, SC Huijskens, DKB Li, A Traboulsee, B Mädler, SH Kolind, A Rauscher, GRW Moore, AL MacKay, C Laule. Global loss of myelin water over 5 years in multiple sclerosis normal-appearing white matter. Mult Scler. 2018; 24:1557-68.
7. T Prasloski, A Rauscher, AL MacKay, M Hodgson, IM Vavasour, C Laule, B Mädler. Rapid whole cerebrum myelin water imaging using a 3D GRASE sequence. Neuroimage. 2012; 63: 533-9.
8. KP Whittall, AL MacKay. Quantitative interpretation of NMR relaxation data. Journal of Magnetic Resonance. 1989; 84: 134-152.
9. T Prasloski, B Mädler, QS Xiang, AL MacKay, C Jones. Applications of stimulated echo correction to multicomponent T2 analysis. Magn Reson Med. 2012; 67:1803-14.
10. M Jenkinson, CF Beckmann, TE Behrens, MW Woolrich, SM Smith. FSL. NeuroImage. 2012; 62: 782-90.
11. McAusland J, Tam RC, Wong E, et al. Optimizing the Use of Radiologist Seed Points for Improved Multiple Sclerosis Lesion Segmentation. IEEE Trans Biomed Eng. 2010;57:2689–2698.
12. VL Stevenson, DH Miller, SM Leary, M Rovaris, F Barkhof, B Brochet, V Dousset, M Filippi, R Hintzen, X Montalban, et al. One year follow up study of primary and transitional progressive multiple sclerosis. J Neurol Neurosurg Psychiatry. 2000; 68, 713-8.
Figures