2819
Brain Ultrashort T2 Component imaging using a STAIR Prepared Dual-Echo UTE Sequence with Complex Echo Subtraction1UC San Diego, San Diego, CA, United States, 2VA Health system, San Diego, CA, United States
Synopsis
We combine a Short TR Adiabatic Inversion Recovery preparation and dual-echo Ultrashort TE data collection with complex Echo Subtraction (ES) (STAIR-dUTE-ES) for both morphological and quantitative imaging of ultrashort T2 components in the whole brain. The 3D STAIR-dUTE-ES technique provides robust water suppression within the whole brain and allows accurate ultrashort T2 proton quantification. UltraShort T2 Proton Fraction (USPF) reduction in multiple sclerosis (MS) lesions suggests that the STAIR-dUTE-ES technique has potential for evaluation of demyelination and remyelination in the diagnosis and treatment of patients with MS.
Introduction
Direct imaging of ultrashort T2 components in brain may improve the specificity of MRI for the assessment and quantification of demyelination (1-6). Most recently, a Short TR Adiabatic Inversion Recovery prepared UTE (STAIR-UTE) sequence has been used to suppress water components with different T1s in brain and thus provide selectively imaging of the ultrashort T2 components contained within it (6). However, accurate imaging and quantification of ultrashort T2 components are much more challenging in gray matter (GM) than in white matter (WM) because GM has a much lower myelin proton density. Any residual water signals may particularly affect the efficacy of ultrashort T2 imaging in GM. In addition, the TR used in STAIR-UTE sequence may not be sufficiently short to allow the STAIR preparation to completely suppress all the water signals due to specific absorption rate (SAR) limitations on clinical MR scanners (6).In this study, we combine the STAIR preparation and dual-echo Ultrashort TE data collection with complex Echo Subtraction (ES) (STAIR-dUTE-ES) for both morphological and quantitative imaging of ultrashort T2 components in the whole brain. Dual-echo acquisition is employed with each spoke of the STAIR-dUTE sequence. The complex ES algorithm provides much better suppression of residual water components after the STAIR preparation with STAIR-dUTE-ES imaging. In vivo healthy volunteer and multiple sclerosis (MS) patient studies were conducted to assess the feasibility of the STAIR-dUTE-ES technique for robust imaging of ultrashort T2 components in the whole brain. Quantitative UltraShort T2 Proton Fraction (USPF) maps were also generated to compare ultrashort T2s seen in lesions in MS patients with those seen in Normal White Matter (NWM) in healthy volunteers.
Method
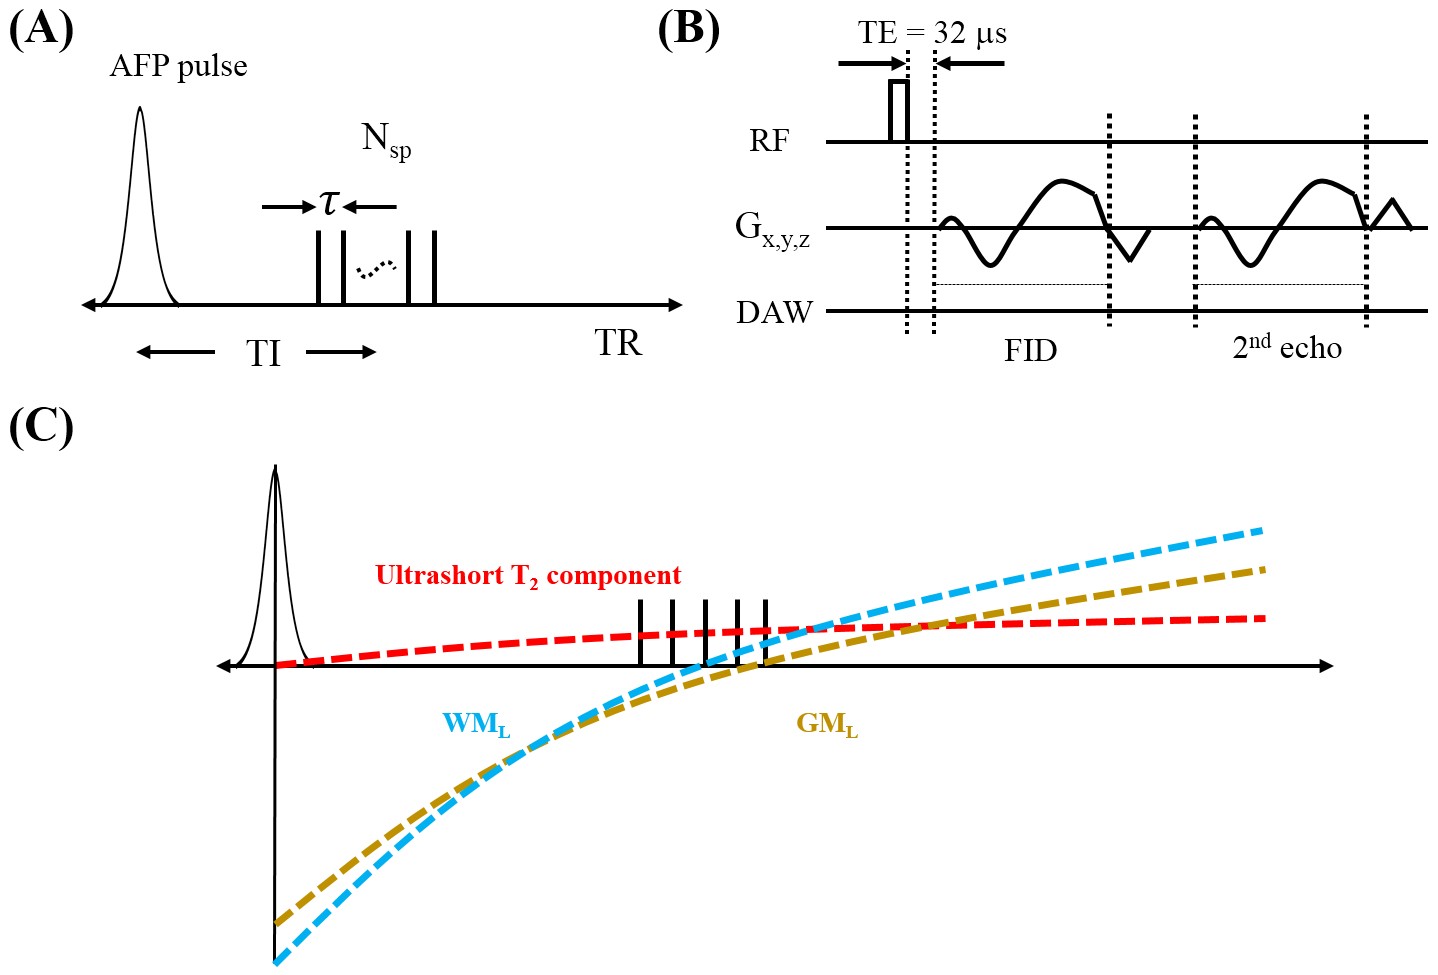
Figure 1 shows key features of the 3D STAIR-dUTE sequence (6). Following an AFP inversion pulse, a series of UTE k-space spokes (Nsp) with identical time separation is used for fast data acquisition. After 3D spiral trajectories using conical view ordering (Figure 1B) dual-echo acquisition is performed (7). Figure 1C shows the contrast mechanism for ultrashort T2 component imaging with the STAIR-dUTE sequence.In this study, complex subtraction of the second echo (S2) from the first one (S1) was utilized to further reduce water signal contamination. B0 inhomogeneity map Δ can be measured before the complex ES, and be used to calculate the ultrashort T2 signal intensity given by the following equation: Sm = S1 – S2*exp(-iγΔB0ΔTE) [1]. Magnitude dual-echo subtraction is also be determined for comparison.
USPF is defined as the ratio of the transverse magnetization of the ultrashort T2 component to the total transverse magnetization of the brain. The ultrashort T2 signal is given by Eq. [1] and the total image signal including both signals from ultrashort T2 components and water can be obtained with a proton density weighted UTE (PDw-UTE) scan. Moreover, considering the spin evolution difference between the STAIR-dUTE and UTE sequences, their signal equations should be utilized to calibrate them and extract the equilibrium state magnetization.
The 3D STAIR-dUTE sequence was implemented on a 3T GE MR750 scanner. Four healthy volunteers and four patients with MS were recruited for this feasibility study. Informed consent was obtained from all subjects in accordance with guidelines from the local Institutional Review Board.
The STAIR-dUTE sequence parameters used for the in vivo brain study were: 1) the 3D STAIR-dUTE sequence: FOV=22×22×30 cm3, matrix=140×140×60, TR/TI=140/62 ms, TE=0.032/2.2 ms, Nsp=5, τ=5.7 ms, flip angle=32°, bandwidth=125 kHz, oversampling factor=2.4, scan time=10 min.
Results and Discussion
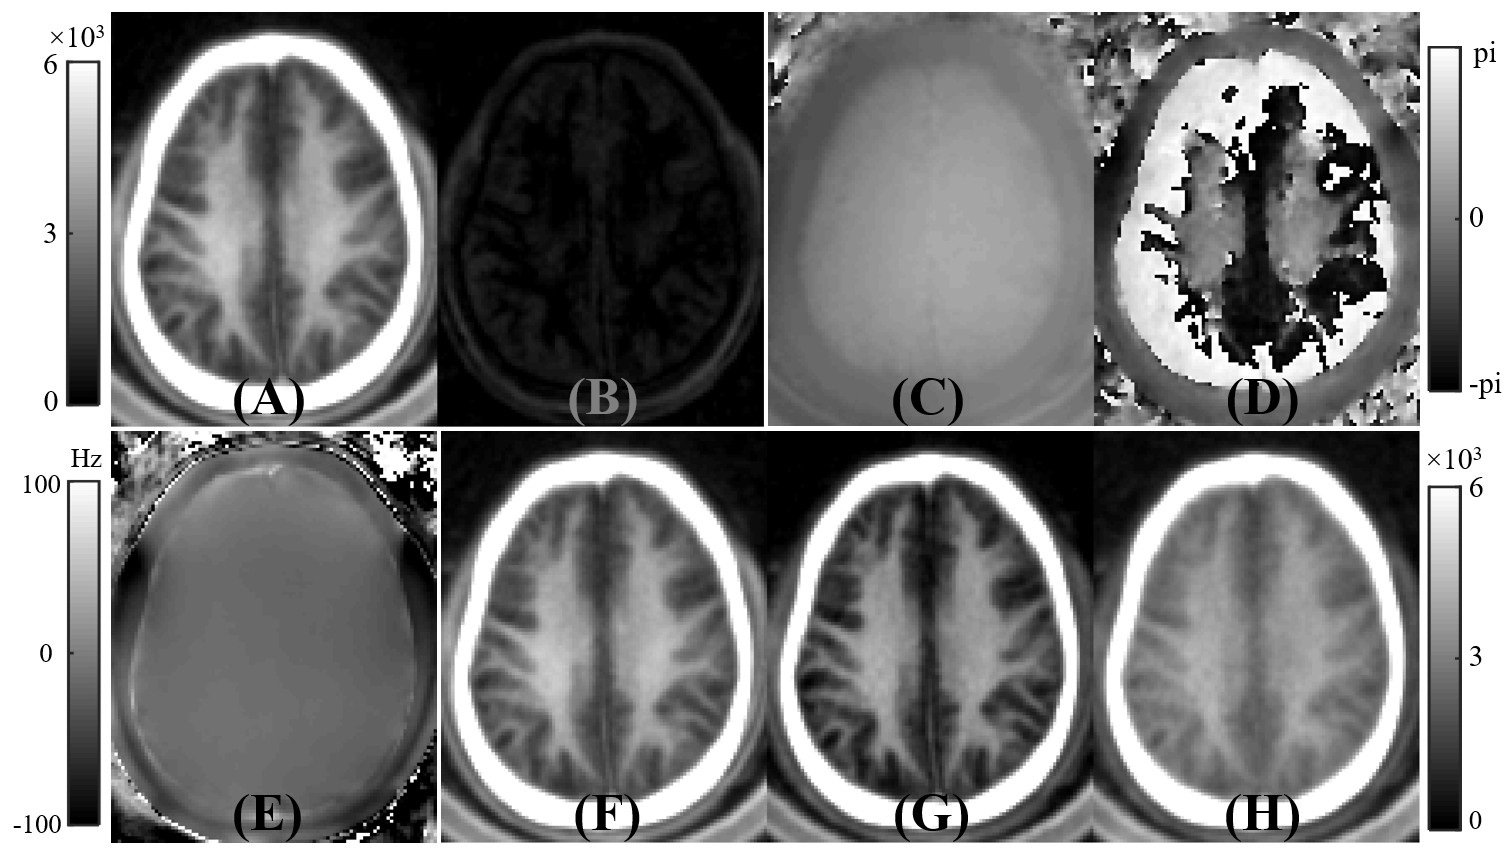
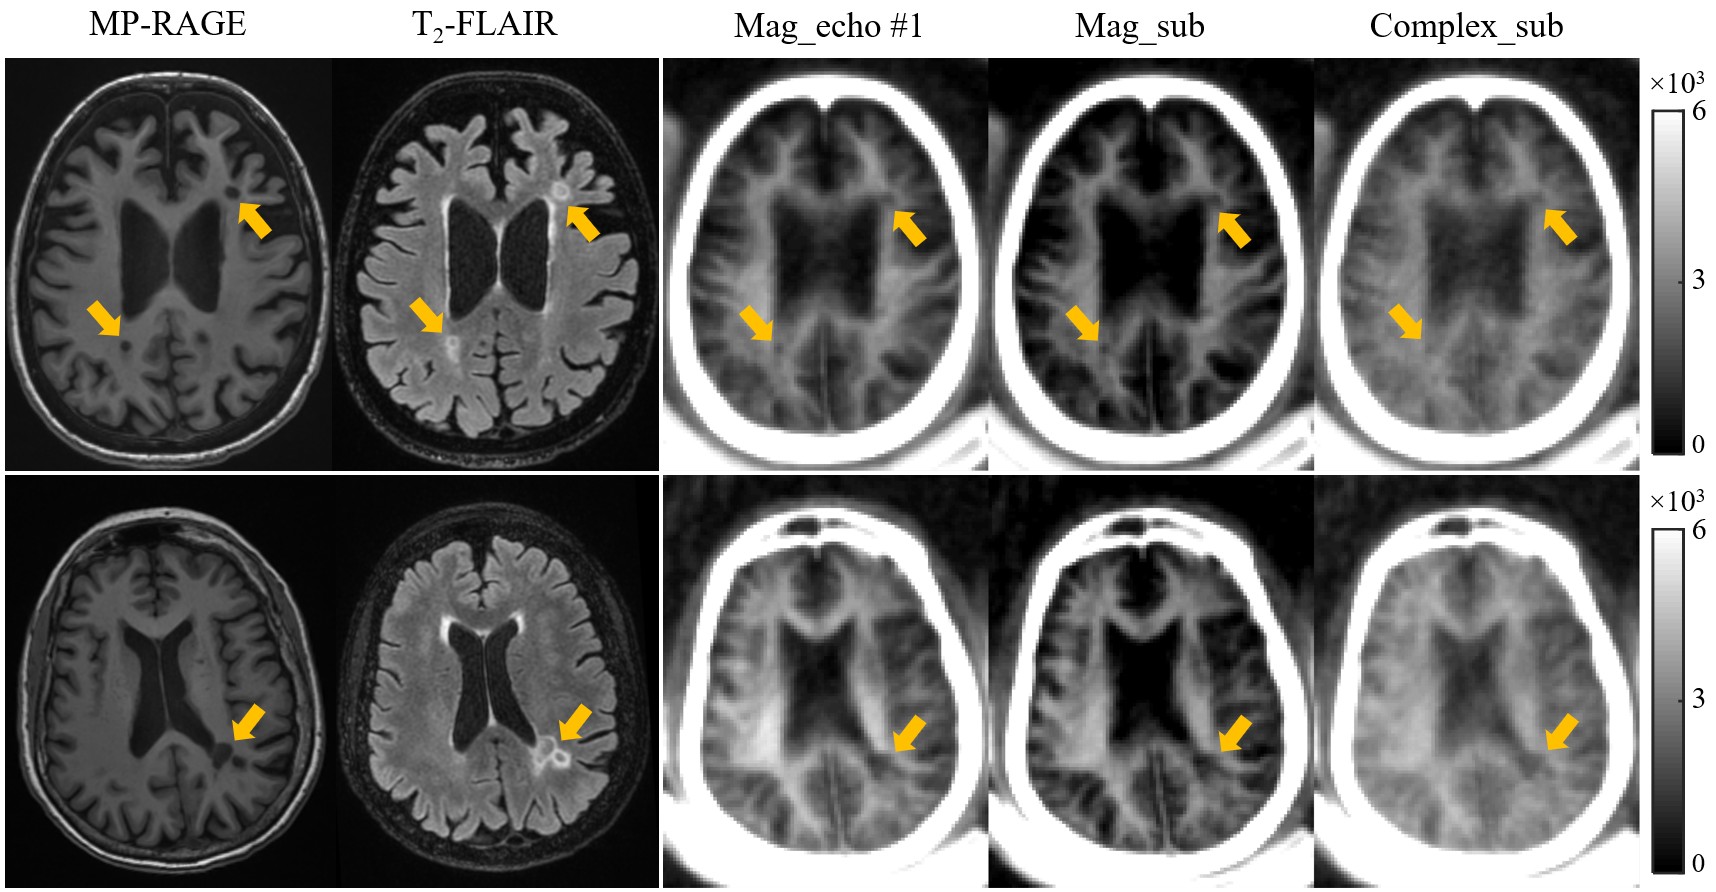
Figure 2 shows a volunteer study with the images used to generate ultrashort T2 signals employing the methods described above. In the white matter region, the first echo image shows a high ultrashort T2 signal. This signal almost completely disappears on the second echo image, consistent with effective water suppression and selective imaging of ultrashort T2 component. However, there are still some residual GM signals on the second echo image and these signals are negative as evidenced by the π difference between GM and WM on the second echo phase image. The magnitude of the first echo, magnitude echo subtracted, and complex echo subtracted images using the STAIR-dUTE sequence are shown in panels F to H respectively.Figure 3 shows STAIR-dUTE results from two MS patients. MP-RAGE and T2-FLAIR images are shown for comparison. Lesions detected with the two clinical sequences show signal loss on the three groups of STAIR-dUTE images. Both GM and MS lesions show higher contrast on the magnitude first echo and the magnitude echo subtracted images as compared with the complex echo subtracted images.
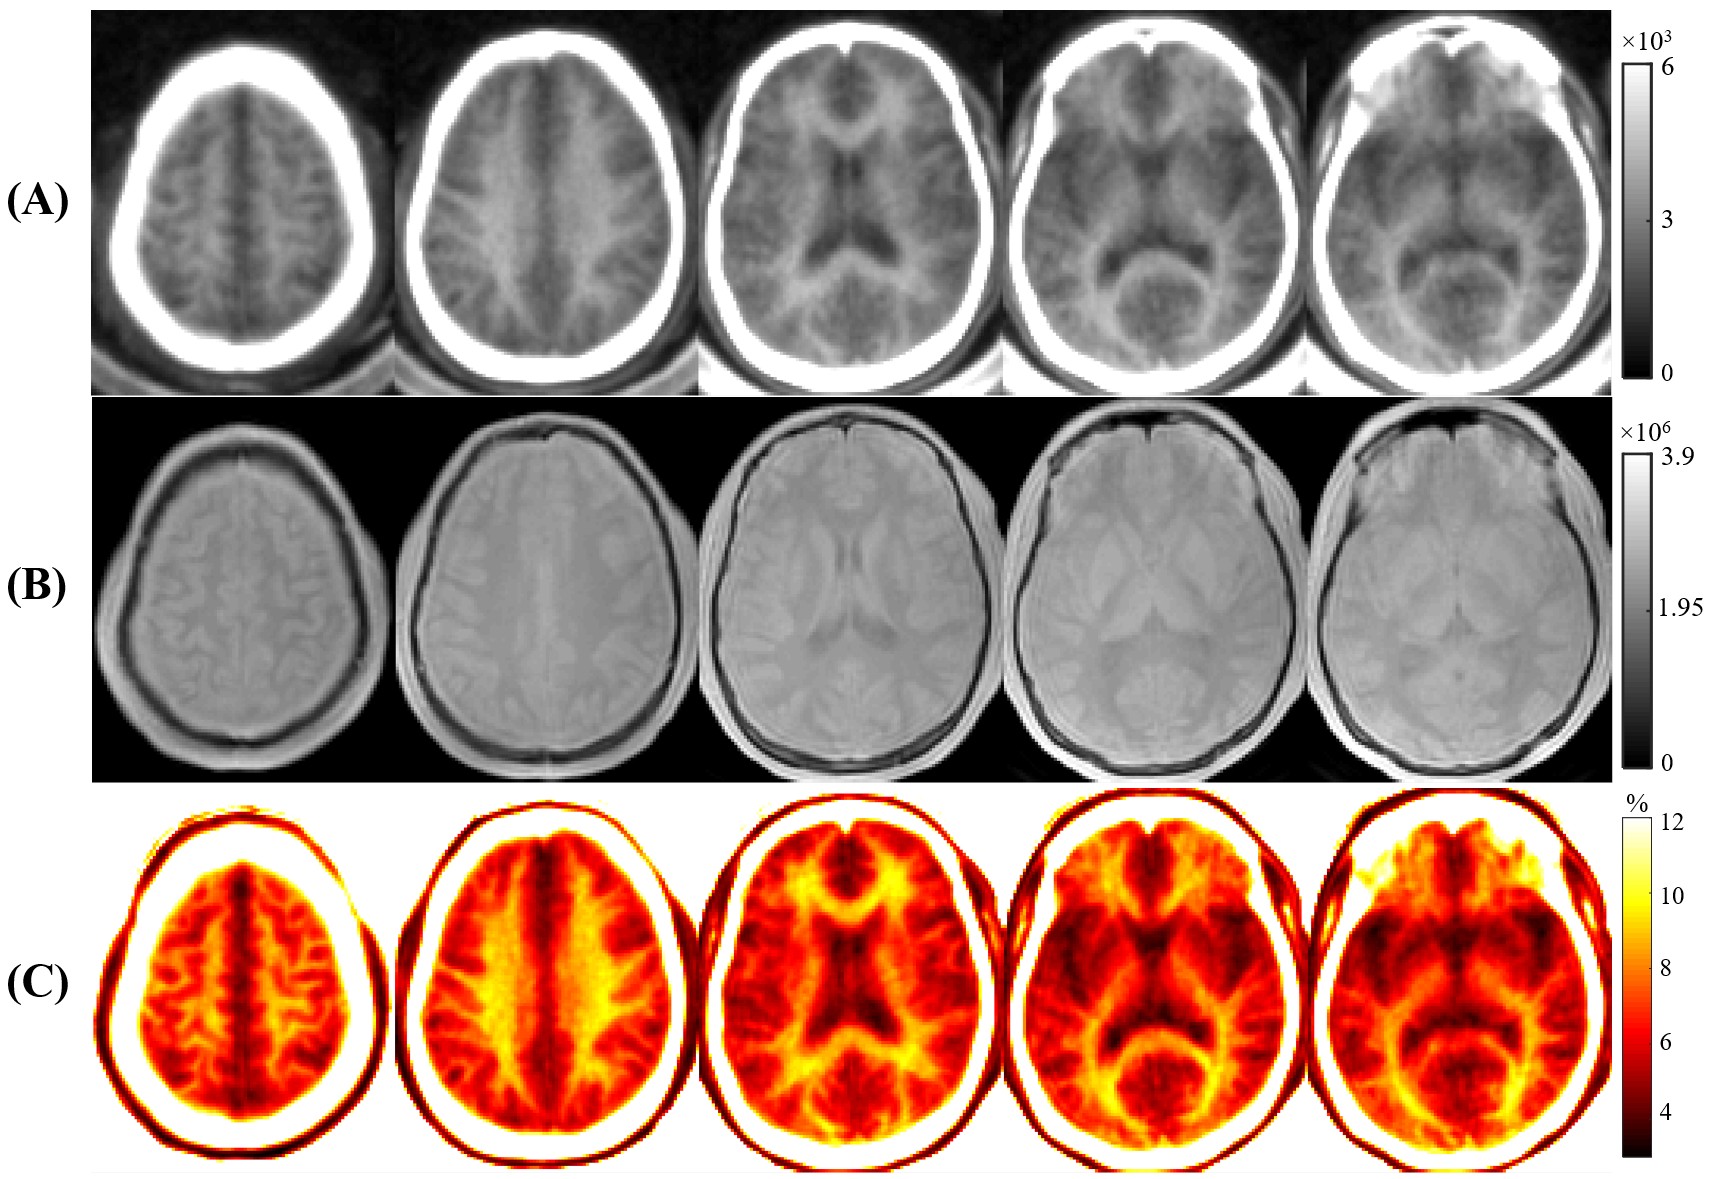
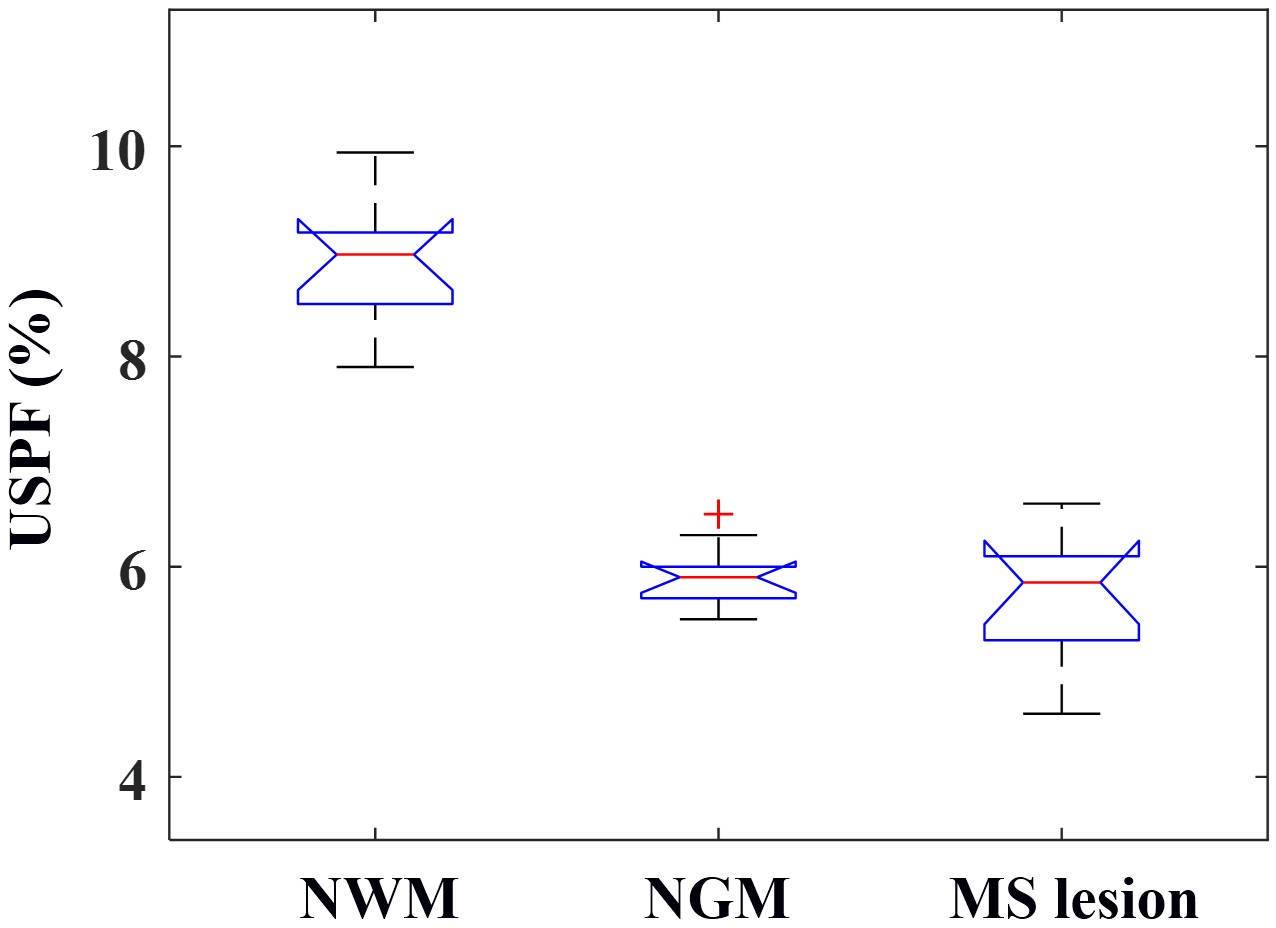
As can be seen in Figure 4, higher contrast is seen on the USPF maps compared to the STAIR-dUTE-ES images. The lesions in MS patients showed a lower mean USPF value (5.7±0.7%) compared with that of NWM (8.9±0.6%) in healthy volunteers, as is shown in Figure 5. Normal GM (NGM) had a USPF value of 5.9±0.3%. These results show that STAIR-dUTE-ES measurement of USPF may be a useful as a biomarker for determining the ultrashort T2 content in MS lesions for diagnosis and monitoring therapy.
Conclusion
The 3D STAIR-dUTE-ES technique has potential for evaluation of demyelination and remyelination in the diagnosis and treatment of patients with MS.Acknowledgements
The authors acknowledge grant support from the NIH (R01NS092650, R01AR075825 and R21AR075851), Veterans Affairs (I01RX002604 and I01CX001388), and GE Healthcare.References
[1] R.A. Horch, J.C. Gore, M.D. Does, Origins of the Ultrashort-T21H NMR Signals in Myelinated Nerve: A Direct Measure of Myelin Content?, Magn. Reson. Med. 66 (2011) 24–31. https://doi.org/10.1002/mrm.22980.
[2] M.J. Wilhelm, H.H. Ong, S.L. Wehrli, C. Li, P.-H. Tsai, D.B. Hackney, F.W. Wehrli, Direct magnetic resonance detection of myelin and prospects for quantitative imaging of myelin density, Proc. Natl. Acad. Sci. 109 (2012) 9605–9610.
[3] J. Du, G. Ma, S. Li, M. Carl, N.M. Szeverenyi, S. VandenBerg, J. Corey-Bloom, G.M. Bydder, Ultrashort echo time (UTE) magnetic resonance imaging of the short T2 components in white matter of the brain using a clinical 3T scanner, NeuroImage. 87 (2014) 32–41.
[4] T. Boucneau, P. Cao, S. Tang, M. Han, D. Xu, R.G. Henry, P.E.Z. Larson, In vivo characterization of brain ultrashort-T2 components, Magn. Reson. Med. 80 (2018) 726–735.
[5] Y.-J. Ma, A.C. Searleman, H. Jang, J. Wong, E.Y. Chang, J. Corey-Bloom, G.M. Bydder, J. Du, Whole-Brain Myelin Imaging Using 3D Double-Echo Sliding Inversion Recovery Ultrashort Echo Time (DESIRE UTE) MRI, Radiology. 294 (2020) 362–374.
[6] Y.-J. Ma, H. Jang, Z. Wei, Z. Cai, Y. Xue, R.R. Lee, E.Y. Chang, G.M. Bydder, J. Corey-Bloom, J. Du, Myelin Imaging in Human Brain Using a Short Repetition Time Adiabatic Inversion Recovery Prepared Ultrashort Echo Time (STAIR-UTE) MRI Sequence in Multiple Sclerosis, Radiology. (2020) 200425.
[7] M. Carl, G.M. Bydder, J. Du, UTE imaging with simultaneous water and fat signal suppression using a time-efficient multispoke inversion recovery pulse sequence, Magn. Reson. Med. 76 (2016) 577–582.
Figures