2818
High-b Diffusivity of MS Lesion in Cervical Spinal Cord using Ultrahigh-b DWI (UHb-DWI)
Kyle Jeong1, Lubdha Shah2, You-Jung Lee1, Bijaya Thapa1, Nabraj Sapkota1, Erica Bisson3, Noel Carlson4, Eun-Kee Jeong2, and John Rose5
1Utah Center for Advanced Imaging Research, University of Utah, Salt Lake City, UT, United States, 2Radiology and Imaging Sciences, University of Utah, Salt Lake City, UT, United States, 3Neurosurgery, University of Utah, Salt Lake City, UT, United States, 4GRECC, Veterans Affairs, Salt Lake City, UT, United States, 5Neuroimmunology and Neurovirology Division, University of Utah, Salt Lake City, UT, United States
1Utah Center for Advanced Imaging Research, University of Utah, Salt Lake City, UT, United States, 2Radiology and Imaging Sciences, University of Utah, Salt Lake City, UT, United States, 3Neurosurgery, University of Utah, Salt Lake City, UT, United States, 4GRECC, Veterans Affairs, Salt Lake City, UT, United States, 5Neuroimmunology and Neurovirology Division, University of Utah, Salt Lake City, UT, United States
Synopsis
Ultrahigh-b radial DWI (UHb-rDWI) is a technique that can quantitatively evaluate MS lesions with respect to degrees of demyelination and axonal damage and/or loss. Currently, there is a lack of sensitive diagnostic technique to quantitatively and non-invasively grade cervical spinal cord (CSC) injury and repair. Our UHb-rDWI can potentially be a powerful tool to quantitatively observe disease progression and monitor treatment responses in MS CSC. Therefore, the main objective of this study was to investigate UHb-rDWI signal in white matter tracts of the CSC and compare quantitative values between healthy control WM with both MS NAWM and WM lesions.
Introduction
Spinal cord injury in multiple sclerosis (MS), due to varying degrees of demyelination and/or axonal damage, is an important cause of disability 1. Magnetic resonance imaging (MRI) provides superb contrast and spatial resolution of the spinal cord and, therefore, is fundamental in the evaluation and monitoring of MS. Unfortunately, the lack of strong clinical and imaging prognostic indicators contributes to poorly defined treatment pathways with outcomes that are not readily predictable. Current conventional MRI sequences have limited ability to detect MS with high specificity 2. Among these techniques, DTI is considered the most mature and promising for quantitative evaluation of white matter (WM) 3. Our UHb-rDWI expands upon DTI to study the water diffusivity in intra-/extra-axonal (IA/EA) spaces in CSC WM of MS patients. In our previous studies, UHb-rDWI provided great insight into CSC pathology in distinguishing demyelination, inflammation, and axonal damage 4,5. With Monte Carlo Simulation (MCS), we studied the behavior of UHb-rDWI signal with respect to b-values in CSC tracts with recently-active or chronic MS lesions. In this study, we present our UHb-rDWI as a powerful tool for linear characterization, monitoring disease, and measurement of therapeutic outcomes for MS to optimize patient care.Methods
MCS was used to numerically simulate UHb-rDWI signal-b for WM geometry with demyelination and axonal loss of various fractions using our own MCS software based on our previous report 4. Five RRMS and two 2PMS patients and seven healthy controls were selected and consented to participate in this IRB approved study. RRMS patients had relapses, corticosteroid therapy, and clinical MRI scans of the cervical spinal cord demonstrating contrast-enhancing lesions correlating with the symptoms of the relapse. In this abstract, only two patient data will be presented. One patient (MS1: 48y/M) had a lesion in right lateral column at the C3-C4. MS2 had a lesion at the C2-C3 level. The control group data included four healthy normal subjects (27/F, 56/F, 34/M, 39/M, 28/F, 27/F, 31/F). All MRI data were acquired using clinical 3T MRI system. To minimize geometric distortion, advanced shimming was performed. UHb-rDWI experiment was conducted using the 2D ss-DWSTEPI-rFOV pulse sequence and an 8-channel CSC dedicated array coil with the following imaging parameters: TR/TE = 3 s/64 ms, 128x44 mm2 imaging FOV, 8 averages, 21 slices with 1.0x1.0x4.0 mm3 voxel dimension, constant duration δ = 12 ms and amplitude GD = 38 mT/m of the diffusion gradient, and 7 b-values (142 ~ 7348 s/m2) along the left-right direction, which was varied via mixing time (time interval between the 2nd and 3rd 90° RF pulses). The data acquisition time for UHb-rDWI was about 7 min.Results
Fig. 1 compares lesion and NAWM of MS1 to the healthy subjects (HS) using UHb-rDWWI signal-b curves and high-b diffusion doefficient, DH. Signal-b curves of the lesion and NAWM of MS1, as well as that of the HS, at the aforementioned ROIs are shown in Fig. 1c. Signal-b of the lesion shows a prominent decaying pattern compared to that of the NAWM, supported by the MCS. The MCS data indicate ~30 % demyelination in the lesion. NAWM signal-b visually resembles that of the HS but still has ~15 % demyelination according to MCS. The measured DH values are 0.597 x 10⁻³ mm2/s, 0.126 x 10⁻³ mm2/s, and 0.056 x 10⁻³ mm2/s for the lesion, NAWM, and the averaged signal-b curves at the corticospinal tract of healthy CSCs, respectively. In Fig. 2(b, c), DWIs of b = 1700 ~ 7350 s/mm2 of the lesion slice and NAWM slice, 1.5 cm below the lesion away from the brain show a lesion (Fig. 2b) with rapidly decaying signal. DWI signal at the lesion is almost suppressed down to noise level at b = 5090 s/mm2, as indicated in Fig. 2c, while those remain high on NAWM tracts in the lesion slice and other slice, 1.5 cm below. Fig. 2e illustrates the distinctively different signal-b curve behavior of the MS2 lesion compared to that of the HS. The UHb-rDWI signal of the NAWM is plotted with the open red circle for reference. MCS finding indicates approximately 40 % and greater than 15 % demyelination in the MS2 lesion and NAWM, respectively. The measured DH values (Fig. 2f) are 0.856 x 10⁻³, 0.092 x 10⁻³, and 0.035 x 10⁻³ mm /s for the lesion, NAWM, and the averaged healthy CSCs, respectively.Conclusion
The reliability of UHb-rDWI in quantitating degree of demyelination is demonstrated by the abnormal quantitative diffusion values in the MS patients relative to the healthy subjects. In all MS patients, DH was greatly elevated an order go magnitude compared to that of the healthy cords. Our MCS suggests this phenomenon is due to demyelination with increased water exchange between the IA and EA spaces. Hence, DH may possibly serve as a reliable biomarker to evaluate the degree of demyelination in MS spinal cord. This will allow UHb-rDWI to become a powerful method to evaluate active and chronic MS lesions.Acknowledgements
Our investigations were funded by NMSS RG 5233-A-2 and NIH R56R01 NS106097-01A1 (EKJ) and the coil development was funded by VA merit review grant (JWR). The investigators greatly appreciate support for this study from Alice and Kevin Steiner.References
- Kremenchutzky, M., Rice, G. P. A., Baskerville, J., Wingerchuk, D. M. & Ebers, G. C. The natural history of multiple sclerosis: A geographically based study 9: Observations on the progressive phase of the disease. Brain 129, 584–594 (2006).
- Bot, J. C. & Barkhof, F. Spinal-Cord MRI in Multiple Sclerosis: Conventional and Nonconventional MR Techniques. Neuroimaging Clin. N. Am. 19, 81–99 (2009).
- Martin, A. R. et al. Translating state-of-the-art spinal cord MRI techniques to clinical use: A systematic review of clinical studies utilizing DTI, MT, MWF, MRS, and fMRI. NeuroImage: Clinical (2016).
- Sapkota, N. et al. Characterization of spinal cord white matter by suppressing signal from hindered space. A Monte Carlo simulation and an ex vivo ultrahigh-b diffusion-weighted imaging study. J. Magn. Reson. 272, 53–59 (2016).
- Thapa, B. et al. Ultra-high-b radial diffusion-weighted imaging (UHb-rDWI) of human cervical spinal cord. J. Magn. Reson. Imaging 49, 204–211 (2018).
Figures
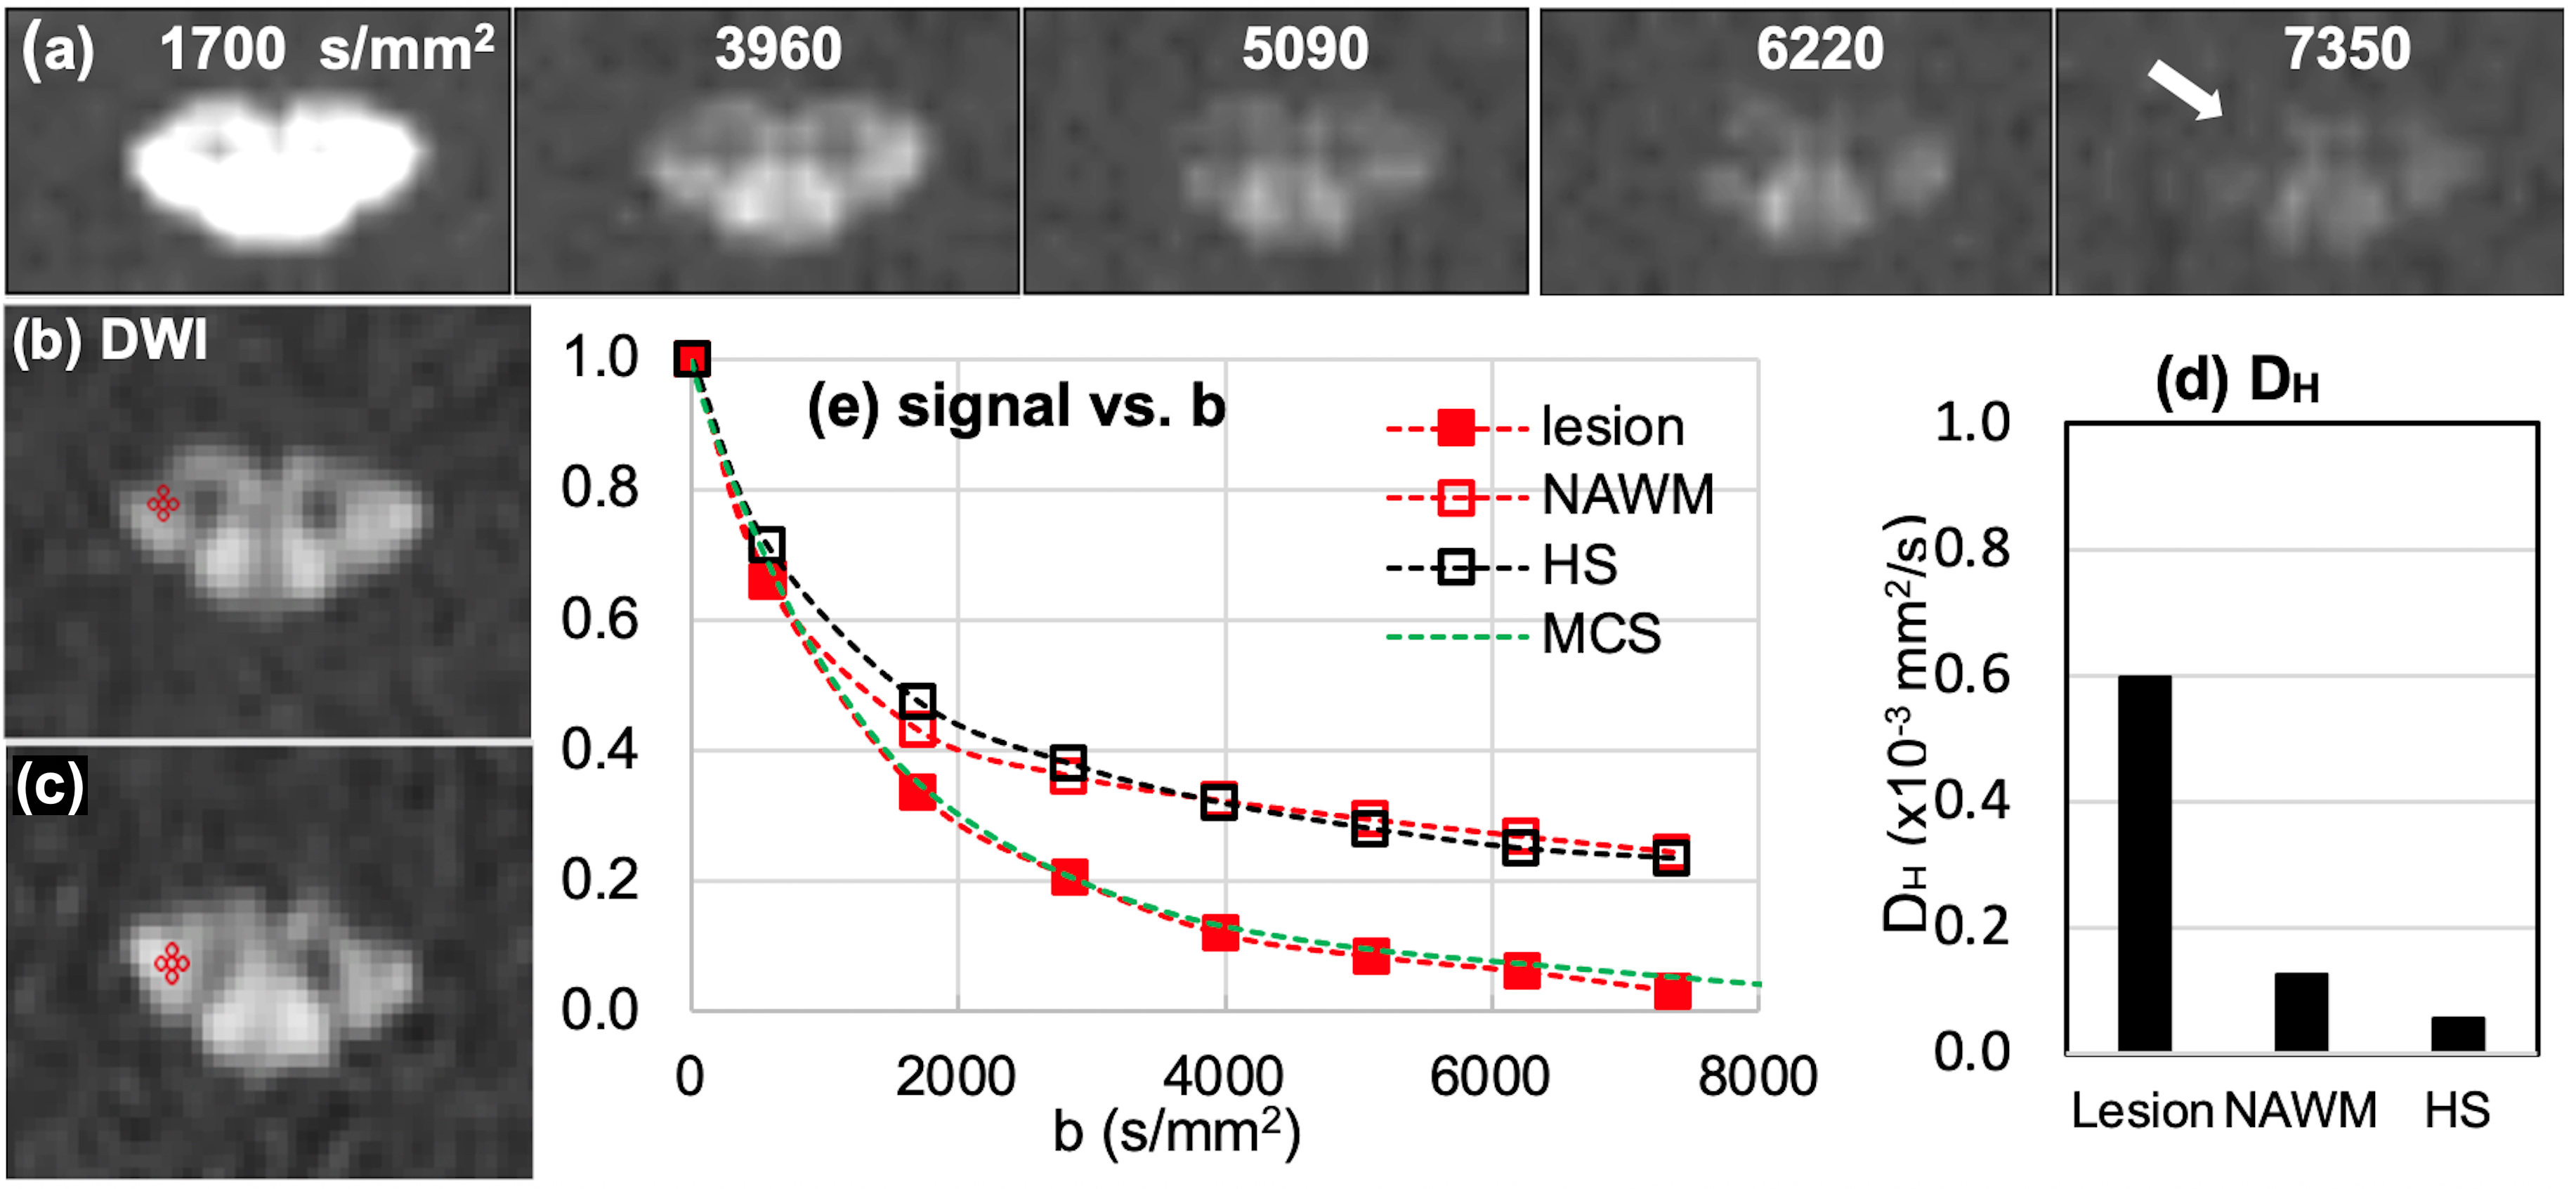
Fig. 1. MS1: (a) DWIs of b = 1700 ~ 7350 s/mm2 of the lesion slice and (b) ROIs at lesion and NAWM slice, 1.5 cm above the lesion toward the brain, and (c) signal-b curves of the recently-active lesion (red square) and NAWM (red circle), and averaged data (hollow square) at the corticospinal tract of seven healthy subjects, and (d) mean values of high-b diffusion coefficient DH at the lesion, NAWM, and the healthy CSCs at the corticospinal tract. Green dotted line in (b) indicates the MCS data with 30 % demyelination in lesion.
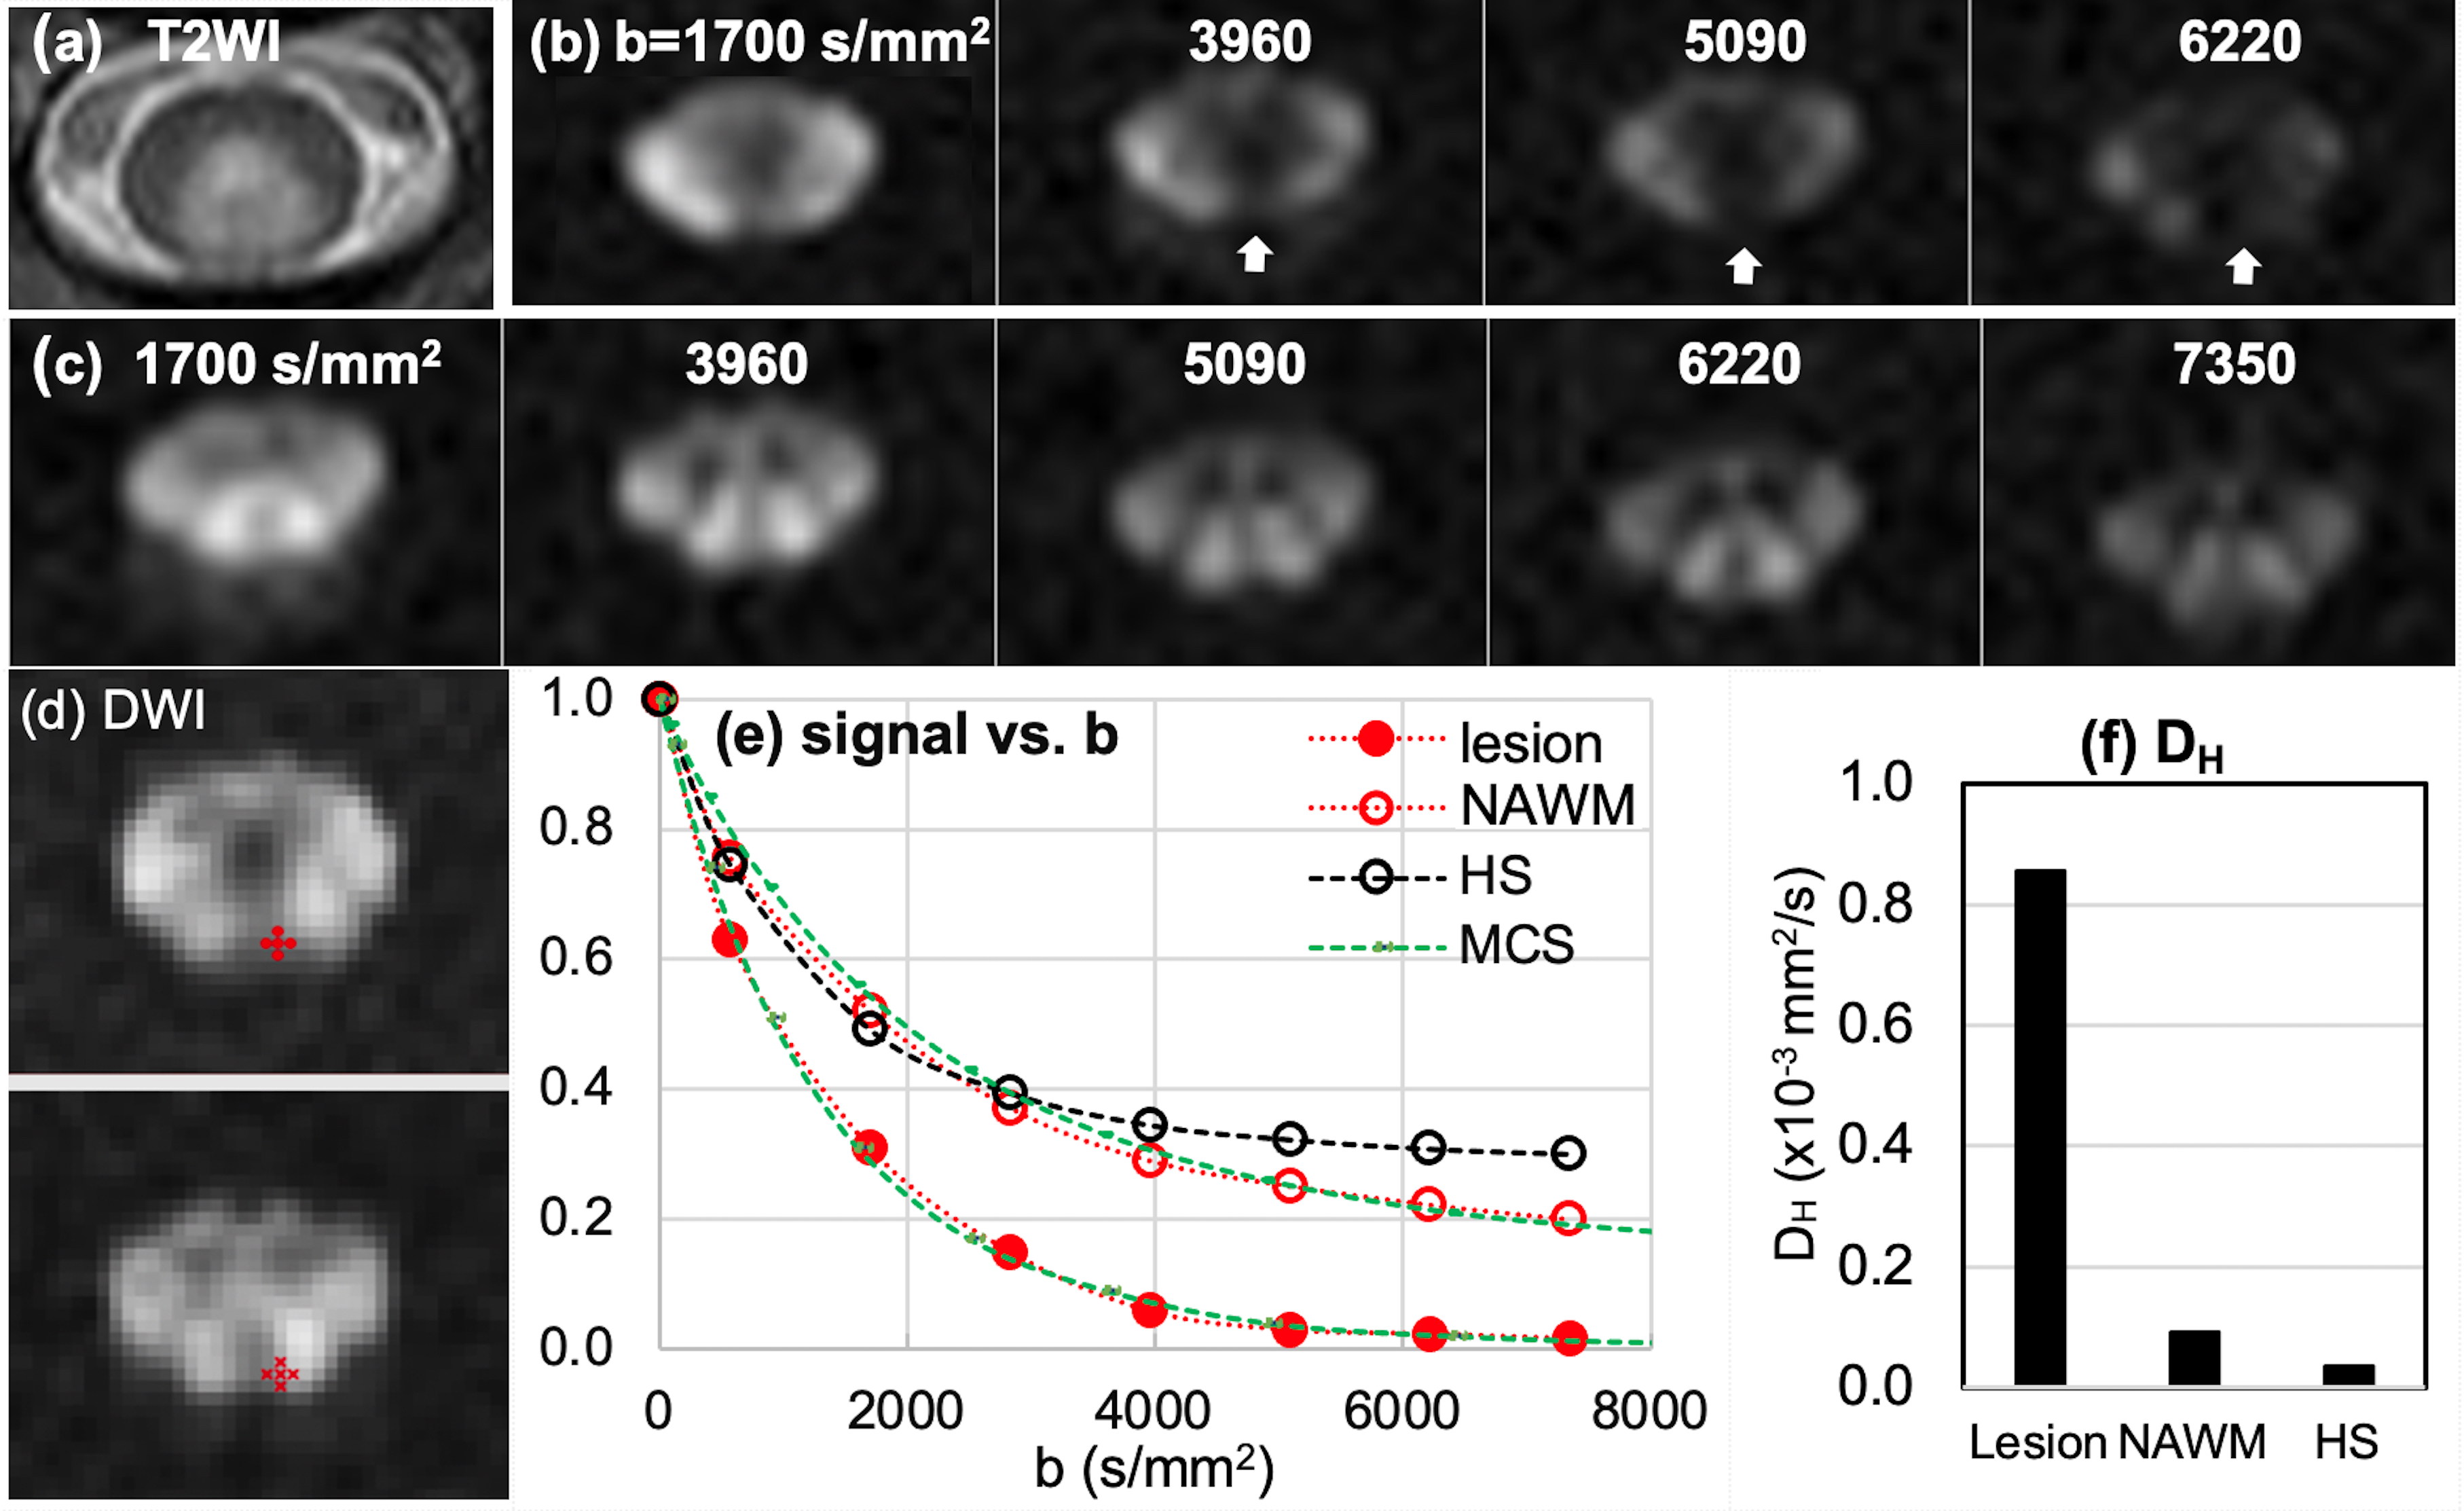
Fig. 2. MS2: (a) T2WI, (b, c) DWIs of b = 1700 ~ 7350 s/mm2 of the lesion slice and NAWM slice, 1.5 cm below the lesion away from the brain, (d) ROIs on lesion (top) and NAWM (bottom), (e) signal-b curves of the recently-active lesion, NAWM, and averaged data at the posterior column of 7 HS, and (f) mean values of high-b diffusion coefficient DH at the lesion, NAWM, and the healthy CSCs at the corticospinal tract. White vertical arrows in (a) indicate lesion with rapidly decaying signal. Green dotted lines in (e) indicate the MCS data with 40 % and 15 % demyelination in lesion and NAWM, respectively.