2817
Application of an exponential recovery model to multiparametric 3D MRI to characterize the evolution of active lesions in Multiple Sclerosis1Aix Marseille Univ, CNRS, CRMBM, Marseille, France, 2APHM, Hôpital Universitaire Timone, CEMEREM, Marseille, France, 3APHM, Hôpital Universitaire Timone, Service de neurologie, Marseille, France, 4Division of MR Research, Radiology, Beth Israel Deaconess Medical Center, Harvard Medical School, Boston, MA, United States
Synopsis
Active lesions in Multiple Sclerosis (MS) present successive phases, from formation through their chronic stage. Characterizing these phases may help us better comprehend the disease evolution. In this work, multiparametric MRI was performed in a 12-month longitudinal study of MS patients presenting new active lesions. An exponential recovery model was proposed to characterize the evolution of MR metrics in these lesions, allowing derivation of the recovery rates of inhomogeneous MTR, conventional MTR, DTI and T1-weighted images. Results show that recovery capacities are patient-dependent and that metrics differ in performance, presumably due to their respective sensitivity to the underlying MS mechanisms.
Introduction
Multiple sclerosis (MS) is a chronic inflammatory and demyelinating disease of the central nervous system, characterized by focal areas of tissue damage. These lesions present singular phases from their formation to their chronic stage, characterized by several features such as blood-brain barrier disruption, microglial activation, edema and inflammation, axonal loss, demyelination and remyelination1. From the acute active phase to stabilization, it is expected that lesion myelination and inflammatory characteristics should vary in a positive manner2, and that this evolution can be assessed in MR imaging.The inhomogeneous magnetization transfer (ihMT) technique3 whose contrast relies on its capacity to isolate dipolar order effects4,5, was previously proposed as an imaging technique sensitive and highly specific to myelination6, demyelination and remyelination7. The ihMT ratio (ihMTR) also demonstrated a sensitivity to the MS pathology8.
In this work, we investigate the contribution of the ihMTR for monitoring and characterizing the dynamic evolution of active MS lesions over a 12-month period starting at detection. A comparison with conventional MTR, radial diffusivity (RD) and the T1-weighted (T1w) signal intensity from an MPRAGE sequence was performed.
Methods
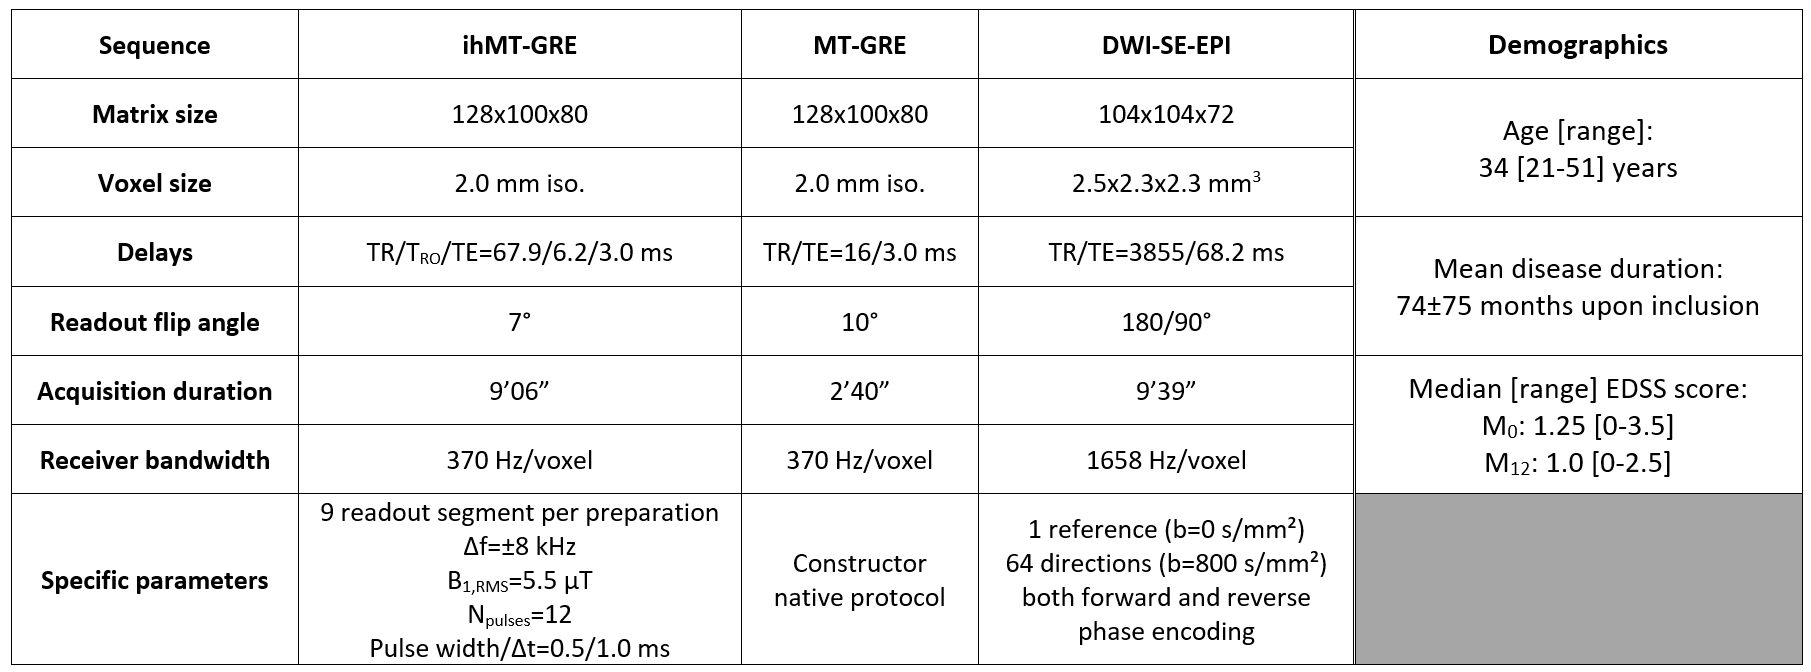
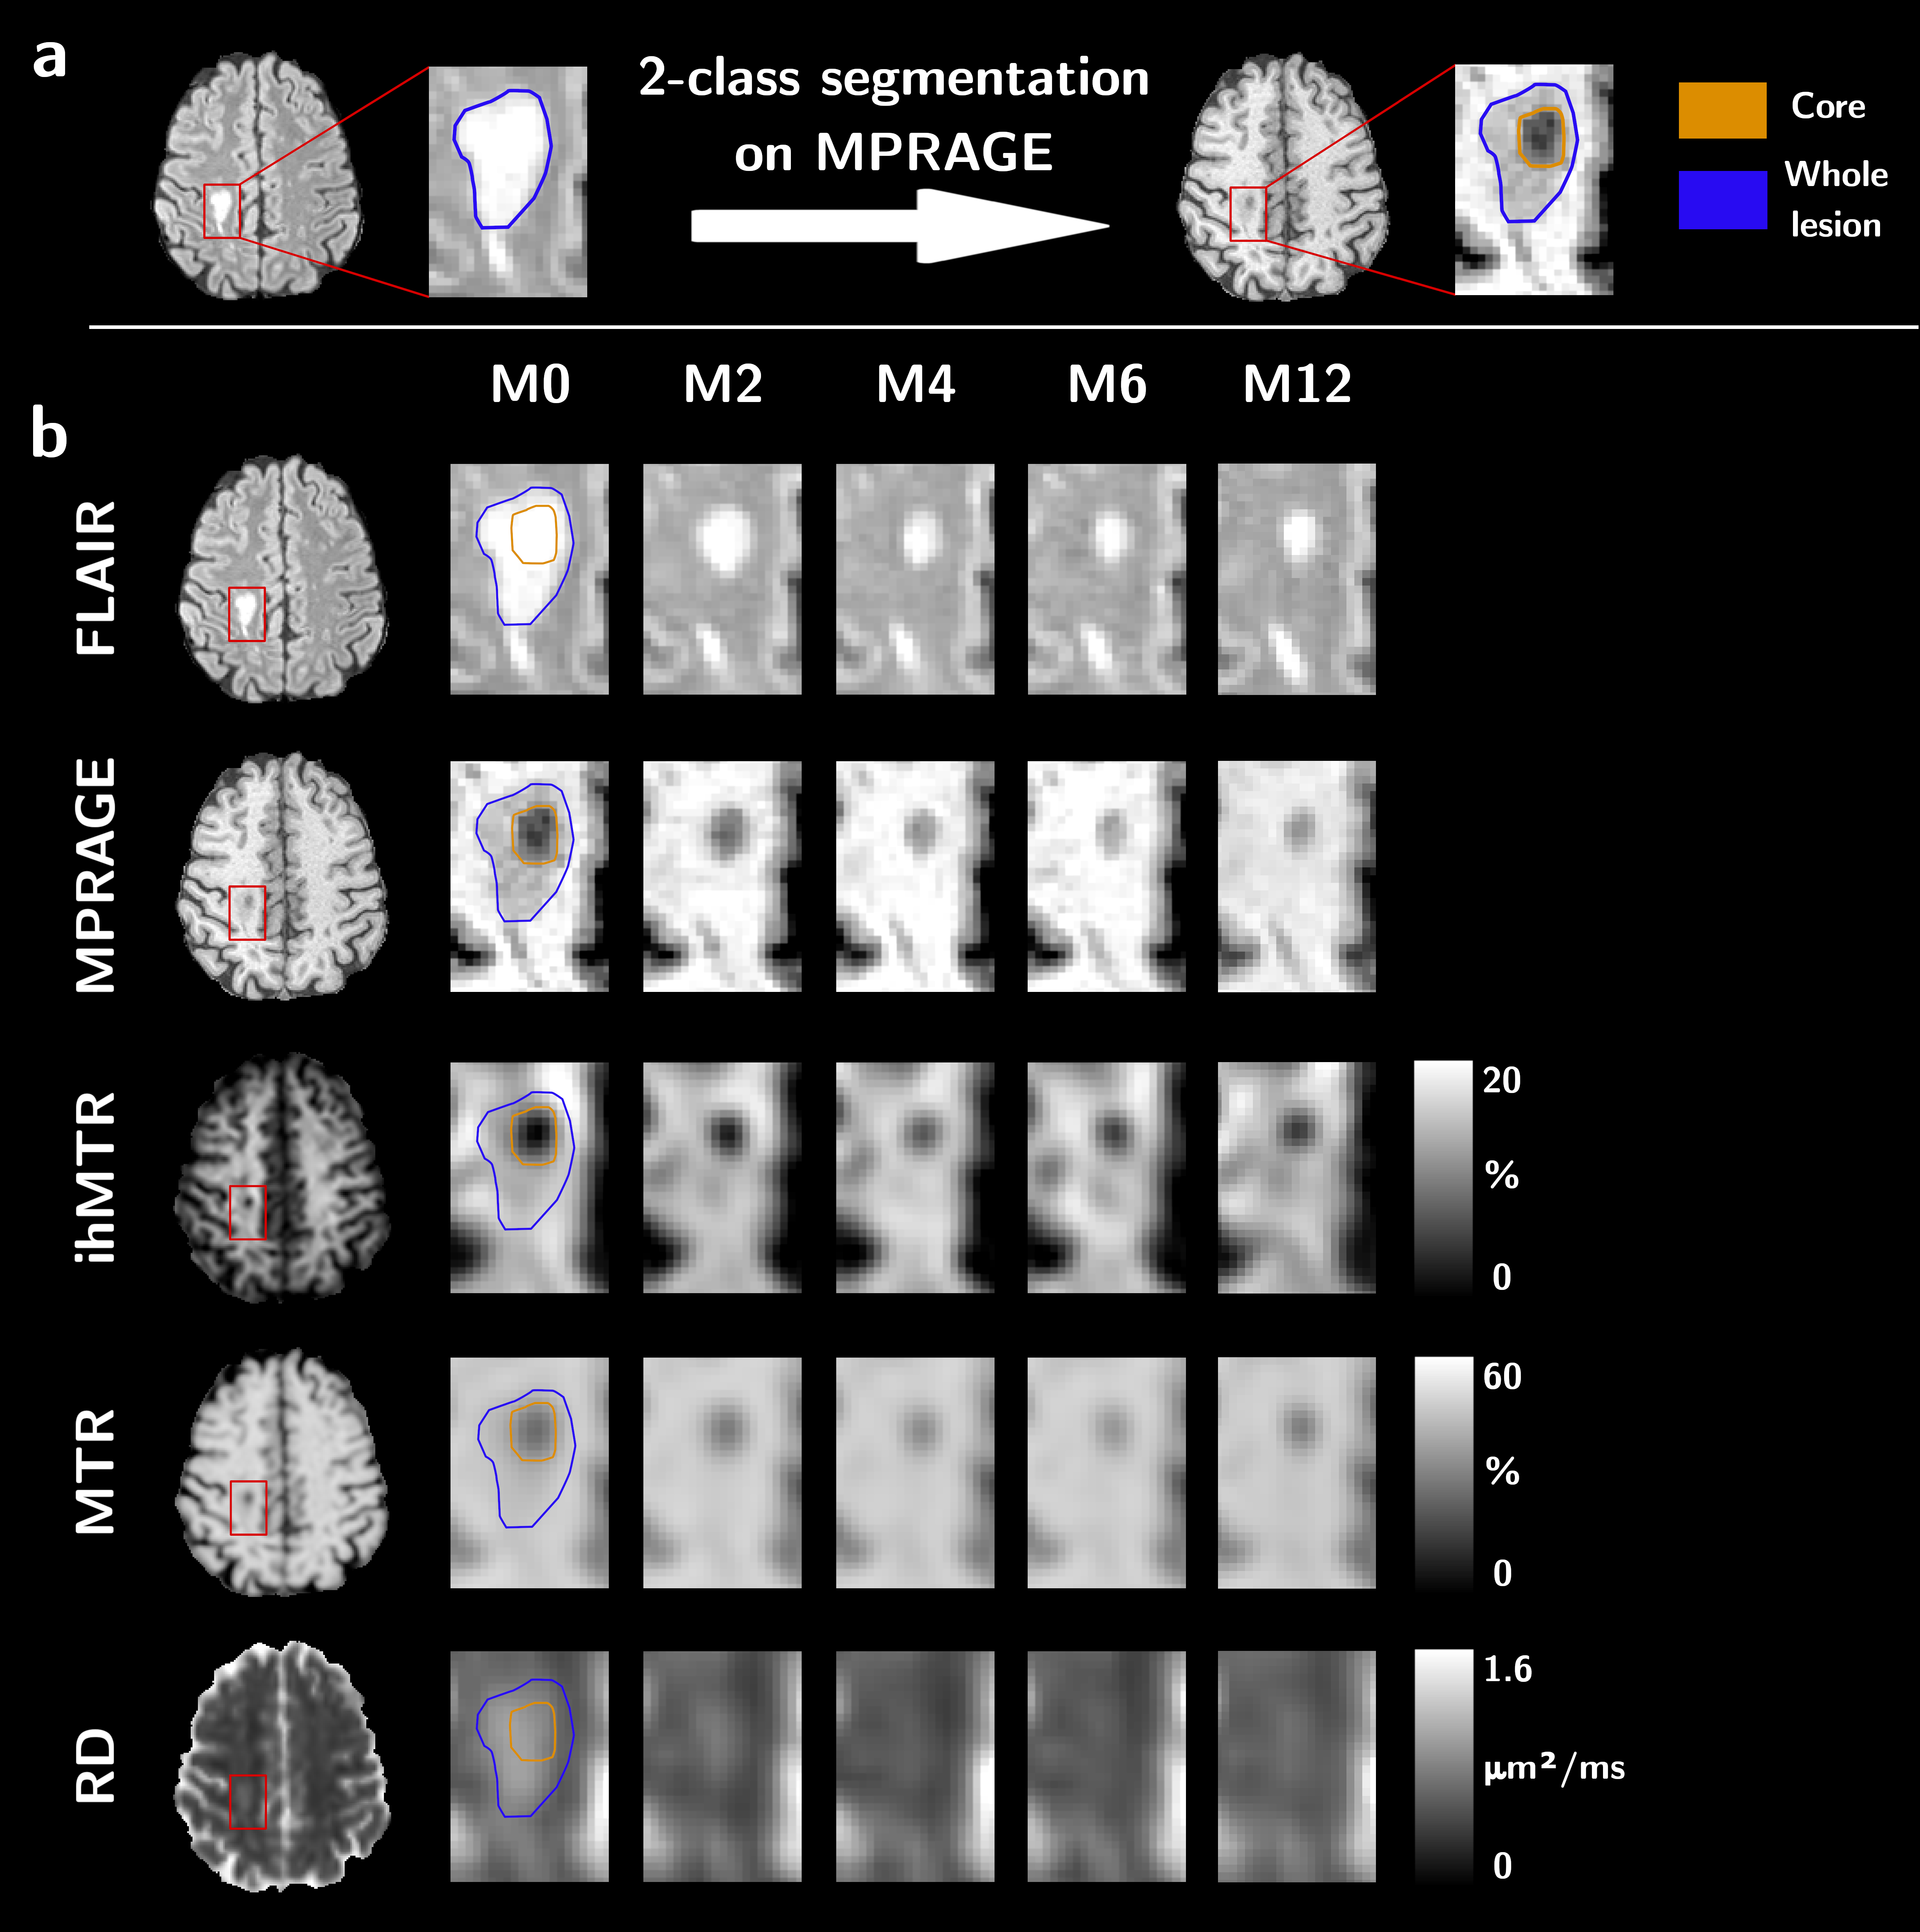
Eleven relapsing-remitting MS patients presenting new active lesions received follow-up scans with a 3D MRI protocol five times over twelve months (M0, M2, M4, M6 and M12) on a 1.5T MRI system (Avanto, Siemens Healthineers, Erlangen, Germany) with body coil transmission and a 32-channel receive-only head coil. The protocol included a T1w-MPRAGE, T2w-FLAIR and multiparametric imaging (Table 1). MS patients (demographics in Table 1) were included based on the occurrence of brain active lesions at baseline from T1w contrast-enhancement post Gadolinium injection.For each subject, all images were rigidly co-registered onto their respective anatomic T1w-MPRAGE volume using the Advanced Normalization Tools (ANTs)9. Active and non-active lesions’ masks were manually segmented on the FLAIR image. Active lesions were further segmented into two clusters using Atropos10 based on the MPRAGE signal at baseline11: the lesion's core is defined as the cluster with the highest contrast with respect to the normal-appearing white matter (NAWM), and the lesion’s edge as the other cluster (Figure 1). NAWM masks were computed from the MPRAGE image using FreeSurfer12, excluding all lesions. Lesions’ edge was discarded from the analyses to focus on the seemingly most affected core region on a T1w basis.
Twenty-three active lesions were selected for the analysis. The time evolution of ihMTR, MTR, RD and MPRAGE signals was investigated by calculating the Relative Variation to a Contralateral region (RVtoC), chosen in NAWM:
$$\text{RVtoC}(t_i)=\frac{P_i-P_i^C}{P_i^C}~~~~\text{(1)}$$
where $$$P_i$$$ and $$$P_i^C$$$ are the average metric values at a given timepoint $$$t_i$$$ calculated over the lesions’ core and over the corresponding contralateral region, respectively.
An exponential recovery model was proposed to fit the time evolution of all MR metrics:
$$\text{RVtoC}(t)=(\text{RVtoC}(t_0)-A)\times e^{-R(t-t_0)}+A~~~~\text{(2)}$$
where $$$A$$$ is the long-time RVtoC asymptotic value and $$$R$$$ denotes the recovery rate of the metric. Only lesions for which the coefficient of determination (ρ²) was higher than 0.75 for all metrics were considered for analysis.
Results
Figure 2 shows boxplots of MR metrics in the core of lesions at different time points. At baseline, ihMTR presented the highest median relative variation to contralateral NAWM (RVtoC=-38.6%) compared to RD (RVtoC=-32.6%), MTR (RVtoC=-28.3%) and MPRAGE (RVtoC=-26.3%). Significant differences in RVtoC values were found between M0 and M4, M6 and M12 for all metrics (Kruskal-Wallis; corrected p<0.05), whereas no difference was found between M0 and M2 except for the MPRAGE signal.Figure 3 shows an example of RVtoC values fitted to the exponential model for ihMTR (3a) and barplots of recovery rates derived from all metrics and averaged across lesions for each patient (3b). ihMTR yielded the most uniform values across patients, spanning from 0.12 to 1.26 month-1, whereas conventional MTR and RD showed much wider dispersion spanning from 0.17 to 4.18 and 0.28 to 12.80 month-1, respectively. No correlation (Pearson) was found between recovery rates derived from MPRAGE and ihMTR. Conversely, significantly low correlations were found between MPRAGE and MTR (r²=0.27, p<0.05) and MPRAGE and RD (r²=0.44, p<0.05). Of interest, patient P07 presented the highest recovery rate for ihMTR, but the lowest one for MTR.
Discussion and conclusion
Among all metrics, ihMTR showed the most uniform recovery rates across patients. In light of improved specificity of ihMTR for myelin content6, it could be postulated that ihMTR describes a myelin recovery dynamics, and that the variability of other investigated contrasts could be explained by additional sensitivity to other physiopathological mechanisms.Overall, the presented recovery rate methodology can be employed for MS lesion characterization of both inflammation/edema and demyelination/remyelination processes, and these promising results could be further validated in vivo by use of myelin-specific PET markers such as the Pittsburgh compound B13.
Acknowledgements
This work was supported by the SATT Sud-Est (France), the French Association pour la Recherche sur la Sclérose En Plaques (ARSEP), Roche Research Foundation (Switzerland) and French National Research Agency, ANR [ANR‐17‐CE18‐0030].References
1. Filippi M, Brück W, Chard D, et al. Association between pathological and MRI findings in multiple sclerosis. Lancet Neurol. 2019;18:198–210 doi: 10.1016/S1474-4422(18)30451-4 SMASH.
2. He J, Grossman RI, Ge Y, Mannon LJ. Enhancing patterns in multiple sclerosis: Evolution and persistence. Am. J. Neuroradiol. 2001;22:664–669.
3. Girard OM, Prevost VH, Varma G, Cozzone PJ, Alsop DC, Duhamel G. Magnetization transfer from inhomogeneously broadened lines (ihMT): Experimental optimization of saturation parameters for human brain imaging at 1.5 Tesla. Magn. Reson. Med. 2015;73:2111–2121 doi: 10.1002/mrm.25330 SMASH.
4. Swanson SD, Malyarenko DI, Fabiilli ML, Welsh RC, Nielsen J-F, Srinivasan A. Molecular, dynamic, and structural origin of inhomogeneous magnetization transfer in lipid membranes. Magn. Reson. Med. 2017;77:1318–1328 doi: 10.1002/mrm.26210 SMASH.
5. Varma G, Girard OM, Prevost VH, Grant AK, Duhamel G, Alsop DC. Interpretation of magnetization transfer from inhomogeneously broadened lines (ihMT) in tissues as a dipolar order effect within motion restricted molecules. J. Magn. Reson. 2015;260:67–76 doi: 10.1016/j.jmr.2015.08.024 SMASH.
6. Duhamel G, Prevost VH, Cayre M, et al. Validating the sensitivity of inhomogeneous magnetization transfer (ihMT) MRI to myelin with fluorescence microscopy. Neuroimage 2019;199:289–303 doi: 10.1016/j.neuroimage.2019.05.061 SMASH.
7. Hertanu A, Soustelle L, Le Troter A, et al. Multi-T1D weighting ihMT imaging in the Cuprizone mouse model. In: Proceedings 28th Scientific Meeting, International Society for Magnetic Resonance in Medicine. ; 2020. p. 175.
8. Van Obberghen E, Mchinda S, le Troter A, et al. Evaluation of the Sensitivity of Inhomogeneous Magnetization Transfer (ihMT) MRI for Multiple Sclerosis. Am. J. Neuroradiol. 2018;39:634–641 doi: 10.3174/ajnr.A5563 SMASH.
9. Avants BB, Tustison N, Song G. Advanced Normalization Tools (ANTS). Insight J. 2 2009:1–35.
10. Avants BB, Tustison NJ, Wu J, Cook PA, Gee JC. An Open Source Multivariate Framework for n-Tissue Segmentation with Evaluation on Public Data. Neuroinformatics 2011;9:381–400 doi: 10.1007/s12021-011-9109-y SMASH.
11. Thaler C, Faizy T, Sedlacik J, et al. T1- Thresholds in Black Holes Increase Clinical-Radiological Correlation in Multiple Sclerosis Patients. PLoS One 2015;10:e0144693 doi: 10.1371/journal.pone.0144693 SMASH.
12. Dale AM, Fischl B, Sereno MI. Cortical Surface-Based Analysis. Neuroimage 1999;9:179–194 doi: 10.1006/nimg.1998.0395 SMASH.
13. Bodini B, Veronese M, García-Lorenzo D, et al. Dynamic Imaging of Individual Remyelination Profiles in Multiple Sclerosis. Ann. Neurol. 2016;79:726–738 doi: 10.1002/ana.24620 SMASH.
Figures