2816
Beyond the Mean: Myelin Heterogeneity Index as a Sensitive Metric for Assessing Myelin Damage in Multiple Sclerosis1Medicine, University of British Columbia, Vancouver, BC, Canada, 2Radiology, University of British Columbia, Vancouver, BC, Canada, 3University of British Columbia, Vancouver, BC, Canada, 4Radiology, Physics and Astronomy, Pathology, University of British Columbia, Vancouver, BC, Canada, 5Medicine, Physics & Astronomy, University of British Columbia, Vancouver, BC, Canada
Synopsis
Myelin water imaging is a quantitative MRI technique that has been used to investigate myelin content in multiple sclerosis (MS). Three metrics derived from myelin water imaging were compared in the normal appearing white matter of different MS subtypes and correlations with disability were investigated. The myelin heterogeneity index was best able to distinguish between MS subtypes and demonstrated the strongest correlation with disability.
Background
Multiple sclerosis (MS) is a progressive degenerative disease of the central nervous system characterized by demyelinating lesions1. The degree of disability in MS is measured clinically by the Expanded Disability Status Scale (EDSS), which ranges from 0 (neurologically normal) to 10(death due to MS)2. There exists a clinico-radiological paradox where the lesion count and volume are not strongly correlated with the degree of disability seen in MS3. Demyelination in the non-lesional normal appearing white matter (NAWM) contributes to disability, thus a sensitive measure of diffuse myelin changes may help improve clinical relevance of imaging markers and be useful for monitoring progressive pathological changes.Myelin water imaging (MWI) evaluates myelin content in the brain by measuring the water trapped between myelin bilayers (myelin water fraction (MWF))4. Within a region of interest (ROI), recent studies have quantified myelin content in MS with not only the mean MWF, reflecting the average myelin content, but also the standard deviation and the coefficient of variation of MWF within the ROI5,6. The MWF standard deviation, a measure of the amount of MWF variation within a region, represents myelin heterogeneity which would increase when there is diffuse demyelination within the ROI. The myelin heterogeneity index (MHI) is defined as the coefficient of variation (MWF standard deviation/mean MWF). MHI has been suggested to be a more sensitive measure of myelin damage, reflecting both the mean and standard deviation within an ROI and capturing changes in myelin content and variability simultaneously5.
How these 3 myelin water imaging metrics compare in detecting MS group differences and correlating with disability is not known. Our objective was to: 1) compare mean MWF, MWF standard deviation and MHI between relapsing remitting MS (RRMS), primary progressive MS (PPMS) and secondary progressive MS (SPMS) and 2) investigate which of these 3 metrics best correlates with EDSS.
Methods
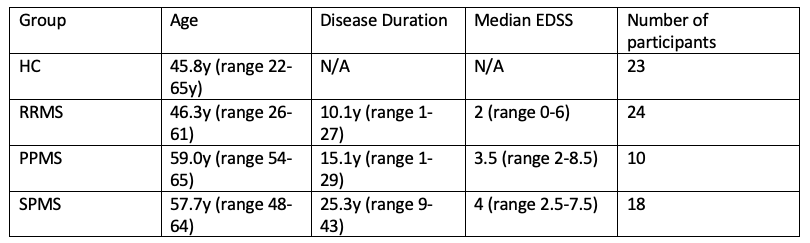
Subjects: 52 MS participants (24 RRMS, 10 PPMS, 18 SPMS) and 23 matched healthy controls (HC) were recruited (demographics in Figure 1).Data acquisition: Imaging was acquired on a 3T scanner (Achieva, Philips Medical Systems). MWI imaging was performed using a GRAdient and Spin Echo (GRASE) sequence (48 echoes, TE = 8ms, TR = 1073ms, 20 slices acquired at 1 × 2 × 5 mm reconstructed to 40 slices at 1 × 1 × 2.5 mm). A 3DT1 (whole-brain 3D magnetization-prepared rapid gradient-echo, TR = 3000 ms, TI = 1072 ms, 1 × 1 × 1 mm voxel, 160 slices) anatomical scan was acquired for reference and a FLAIR (FLuid Attenuated Inversion Recovery) sequence was collected for lesion segmentation.
Data processing: GRASE was analyzed using a regularized non-negative least-squares fitting algorithm with stimulated echo correction 7,8. MWF was characterized as the fraction of the T2 signal under 40ms 7.
Analysis: Registrations of 3DT1 and FLAIR to GRASE space were performed using FLIRT (FSL toolbox). Tissue segmentation was performed using FAST (FSL toolbox) on the 3DT1 images, and lesions (identified from the FLAIR images by a trained observer) were subtracted to create NAWM masks9–11. MWF mean, MWF standard deviation, and MHI were calculated in NAWM. Group differences were calculated using one-way ANOVA with Tukey correction and correlations with EDSS for the entire group were assessed with a Pearson correlation.
Results
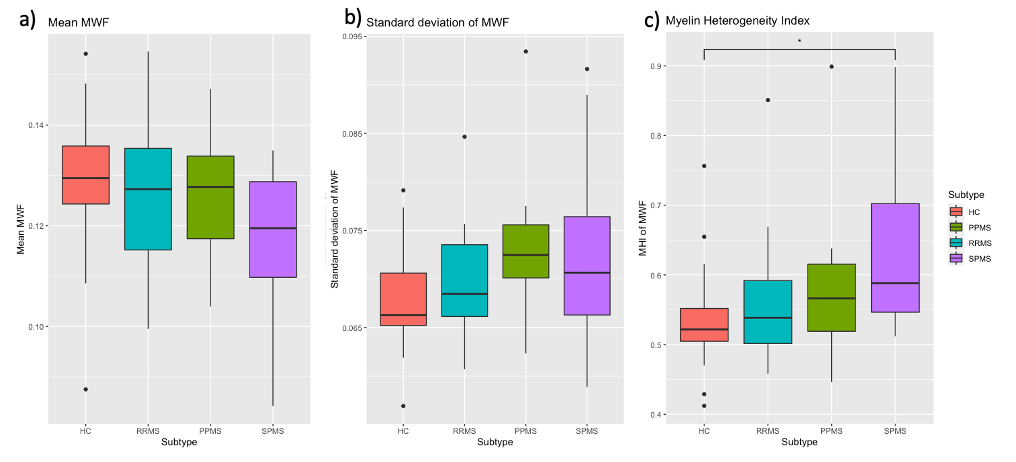
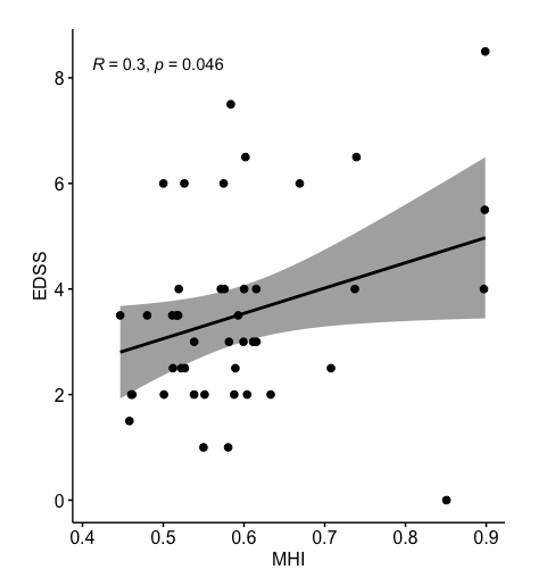
MWF mean and standard deviation were not significantly different between the 4 groups. MHI was 19% higher in SPMS (0.63 ± 0.1) relative to HC (0.53 ± 0.07, p=0.01) and trended towards being increased (13% higher) (0.56 ± 0.09, p=0.065) relative to RRMS (Figure 2). Mean MWF of all MS patients (p = 0.08, R = -0.3) and MWF standard deviation (p = 0.2, R = 0.2) were not significantly correlated to EDSS. MHI was correlated with EDSS (p = 0.046, R = 0.3) (Figure 3).Discussion
While Figure 1 suggests trends toward lower MWF mean and higher standard deviation for MS compared to HC, the between-group comparison did not significantly differentiate between groups with either of these metrics. This is likely due to the relatively small group sizes and natural variations in myelin content between healthy controls12. Conversely, MHI provided a distinction between HC and SPMS (p=0.01) and a trend towards differentiating RRMS and SPMS (p=0.065) (Figure 2). A larger range of participants would be necessary to elicit more significant differences, but it appears the MHI has the strongest potential of detecting differences in myelin damage between groups.MHI was the only MWI metric correlated with EDSS, illustrating that MHI was able to demonstrate a link between myelin damage and disability (Figure 3).Conclusion
MHI was better able to discriminate MS subtypes from controls than mean MWF and MWF standard deviation, suggesting it may be a more sensitive measure of myelin damage in MS. MHI was also correlated with EDSS, supporting the hypothesis that NAWM damage influences disability in MS, and may be an important confounding factor in the clinico-radiological mismatch observed in MS.Acknowledgements
The authors would like to thank the research participants as well as the MRI technologists. The authors would also like to thank the MS Society of Canada for funding this study.References
1. Breij ECW, Brink BP, Veerhuis R, et al. Homogeneity of active demyelinating lesions in established multiple sclerosis. Ann Neurol. 2008;63(1):16-25. doi:10.1002/ana.21311
2. Kurtzke JF. Rating neurologic impairment in multiple sclerosis: An expanded disability status scale (EDSS). Neurology. 1983;33(11):1444-1452. doi:10.1212/wnl.33.11.1444
3. Chard D, Trip SA. Resolving the clinico-radiological paradox in multiple sclerosis. F1000Research. 2017;6. doi:10.12688/f1000research.11932.1
4. Laule C, Vavasour IM, Kolind SH, et al. Magnetic Resonance Imaging of Myelin.
5. Abel S, Vavasour I, Lee LE, et al. Associations Between Findings From Myelin Water Imaging and Cognitive Performance Among Individuals With Multiple Sclerosis. JAMA Netw open. 2020;3(9):e2014220. doi:10.1001/jamanetworkopen.2020.14220
6. Lee LE, Vavasour IM, Dvorak A, et al. Cervical cord myelin abnormality is associated with clinical disability in multiple sclerosis. Mult Scler J.
7. Prasloski T, Rauscher A, MacKay AL, et al. Rapid whole cerebrum myelin water imaging using a 3D GRASE sequence. Neuroimage. 2012;63(1):533-539. doi:10.1016/j.neuroimage.2012.06.064
8. Prasloski T, Mädler B, Xiang QS, MacKay A, Jones C. Applications of stimulated echo correction to multicomponent T2 analysis. Magn Reson Med. 2012;67(6):1803-1814. doi:10.1002/mrm.23157
9. Jenkinson M, Bannister P, Brady M, Smith S. Improved optimization for the robust and accurate linear registration and motion correction of brain images. Neuroimage. 2002;17(2):825-841. doi:10.1016/S1053-8119(02)91132-8
10. Smith SM, Jenkinson M, Woolrich MW, et al. Advances in functional and structural MR image analysis and implementation as FSL. In: NeuroImage. Vol 23. Neuroimage; 2004. doi:10.1016/j.neuroimage.2004.07.051
11. Andersson JLR, Jenkinson M, Smith S. Non-Linear Registration Aka Spatial Normalisation FMRIB Technial Report TR07JA2.; 2007.
12. Dvorak A, Liu H, Ljungberg E, et al. Multivariate template creation of a myelin water brain atlas with GRASE and mcDESPOT. In: ISMRM. ; 2019:Abstract #0424.
Figures