2814
Longitudinal automated assessment of paramagnetic rim lesions in multiple sclerosis using RimNet
Maxence Wynen1, Francesco La Rosa2,3,4, Amina Sellimi5, Germán Barquero2,3,4, Gaetano Perrotta6, Valentina Lolli7, Vincent Van Pesch5, Cristina Granziera8,9, Tobias Kober10, Pascal Sati11,12, Benoît Macq13, Daniel S. Reich11, Martina Absinta11,14, Meritxell Bach Cuadra2,3,4, and Pietro Maggi5,15
1Ecole Polytechnique de Louvain, Université Catholique de Louvain, Louvain-la-Neuve, Belgium, 2Signal Processing Laboratory (LTS5), École Polytechnique Fédérale de Lausanne, Lausanne, Switzerland, 3Medical Image Analysis Laboratory, Center for Biomedical Imaging (CIBM), University of Lausanne, Lausanne, Switzerland, 4Radiology Department, Lausanne University Hospital and University of Lausanne, Lausanne, Switzerland, 5Department of Neurology, Cliniques Universitaires Saint-Luc, Université Catholique de Louvain, Brussels, Belgium, 6Department of Neurology, Erasme University Hospital, Université Libre de Bruxelles, Brussels, Belgium, 7Department of Radiology, Erasme University Hospital, Université Libre de Bruxelles, Brussels, Belgium, 8Neurologic Clinic and Policlinic, Departments of Medicine, Clinical Research and Biomedical Engineering, University Hospital Basel and University of Basel, Basel, Switzerland, 9Translational Imaging in Neurology (ThINk) Basel, Department of Medicine and Biomedical Engineering, University Hospital Basel and University of Basel, Basel, Switzerland, 10Advanced Clinical Imaging Technology, Siemens Healthcare AG, Lausanne, Switzerland, 11Translational Neuroradiology Section, National Institute of Neurological Disorders and Stroke, National Institutes of Health, Bethesda, MD, United States, 12Department of Neurology, Cedars-Sinai Medical Center, Los Angeles, CA, United States, 13ICTEAM Institute, Université catholique de Louvain, Louvain-la-Neuve, Belgium, 14Department of Neurology, Johns Hopkins University, Baltimore, MD, United States, 15Department of Neurology, Lausanne University Hospital and University of Lausanne, Lausanne, Switzerland
1Ecole Polytechnique de Louvain, Université Catholique de Louvain, Louvain-la-Neuve, Belgium, 2Signal Processing Laboratory (LTS5), École Polytechnique Fédérale de Lausanne, Lausanne, Switzerland, 3Medical Image Analysis Laboratory, Center for Biomedical Imaging (CIBM), University of Lausanne, Lausanne, Switzerland, 4Radiology Department, Lausanne University Hospital and University of Lausanne, Lausanne, Switzerland, 5Department of Neurology, Cliniques Universitaires Saint-Luc, Université Catholique de Louvain, Brussels, Belgium, 6Department of Neurology, Erasme University Hospital, Université Libre de Bruxelles, Brussels, Belgium, 7Department of Radiology, Erasme University Hospital, Université Libre de Bruxelles, Brussels, Belgium, 8Neurologic Clinic and Policlinic, Departments of Medicine, Clinical Research and Biomedical Engineering, University Hospital Basel and University of Basel, Basel, Switzerland, 9Translational Imaging in Neurology (ThINk) Basel, Department of Medicine and Biomedical Engineering, University Hospital Basel and University of Basel, Basel, Switzerland, 10Advanced Clinical Imaging Technology, Siemens Healthcare AG, Lausanne, Switzerland, 11Translational Neuroradiology Section, National Institute of Neurological Disorders and Stroke, National Institutes of Health, Bethesda, MD, United States, 12Department of Neurology, Cedars-Sinai Medical Center, Los Angeles, CA, United States, 13ICTEAM Institute, Université catholique de Louvain, Louvain-la-Neuve, Belgium, 14Department of Neurology, Johns Hopkins University, Baltimore, MD, United States, 15Department of Neurology, Lausanne University Hospital and University of Lausanne, Lausanne, Switzerland
Synopsis
The automatic assessment of paramagnetic rim lesions in multiple sclerosis is important, and a deep learning-based algorithm called RimNet has recently been proposed. This work evaluates the generalizability of RimNet and its longitudinal performance on MRI data acquired at different clinical centers. We found that RimNet’s performance was nearly as good on totally unseen data as in the original paper (receiver-operating-characteristic area-under-the-curve (AUC) 0.88 vs. 0.94, precision-recall AUC 0.69 vs. 0.70), and it made consistent predictions on longitudinal data (binary consistency 82%, probability consistency 93%).
INTRODUCTION
In multiple sclerosis (MS), some brain white matter lesions are more destructive and feature an edge of chronic/smoldering inflammation, which corresponds to a paramagnetic rim on susceptibility-based MRI.1 Higher paramagnetic rim lesion (PRL) burden is associated with more aggressive disease course,2,3 however the longitudinal effect of available MS disease modifying treatments (DMT) on PRL is still largely unknown. Considering that manual rim classification is tedious and associated with inter-observer variability, a multimodal convolutional neural network for automated detection (RimNet) has been recently developed4. In this work, we tested RimNet (i) on data acquired in two centers using MRI scanners from two different vendors (including one not used for training in the original paper); and (ii) longitudinally on MRI data acquired in primary and secondary progressive MS patients (PMS) before and after DMT.METHODS
Two sets of MRI images were acquired from 13 PMS patients [mean ± SD age: 44 ± 10; female/male: 4/9; median EDSS (range): 4.5 (3.0–6.5)] who started a DMT (ocrelizumab or siponimod) at 2 different hospitals. The first dataset (baseline) was acquired before DMT administration, and the second at a median time of 13 months (range: 6–18) after DMT administration (follow-up). The protocol included 3D Fluid Attenuated Inversion Recovery (FLAIR) and 3D T2*-weighted echo planar imaging (T2*-EPI), providing T2* magnitude and phase images (which we simply refer to as T2* and phase, respectively). FLAIR* images were generated by voxel-wise multiplication of the FLAIR and T2*-EPI images, as previously described.5 The scanners and acquisition parameters are reported in Table 1.Two experts manually annotated the PRL by examining phase images by consensus. The first pre-processing step consisted of motion-correction of the FLAIR images using Freesurfer6, and then automated lesion segmentation using SAMSEG,7 yielding a total of 704 lesions. The next steps consisted of rigid registration of the FLAIR and lesion mask to the T2*-EPI space using ANTs,8 manual correction of the lesion mask (including splitting of confluent lesions), and rigid coregistration of baseline and follow-up images for all subjects. Next, all images were skull-stripped using FSL,9 and the intensities of FLAIR and T2* images were normalized using histogram matching10 to two reference images (T2* and FLAIR) used during the training. Finally, 3D patches of size 28x28x28 voxels were extracted for all lesions.4 The resulting lesions were then tested using two bimodal networks of RimNet4 pre-trained on different datasets. The first model, trained with phase and FLAIR (phase+FLAIR model), was tested with the same images. The other model, which was trained using phase and T2*-EPI, was tested on two image sets: one including phase and T2*-EPI (phase+T2*) and the other phase and FLAIR* (phase+FLAIR*). We evaluated PRL classification performance after fixing a false positive rate (FPR) of 0.10. In addition to commonly used metrics (accuracy, F1-score, receiver-operating-characteristic (ROC) and precision-recall (PR) curves per session), we also calculated a consistency measure “c” to evaluate the similarity between the baseline and follow-up predictions. This was computed for each PRL using the following formula: $$c = 1-(|p1-p2|)$$ where p1 and p2 are, respectively, the binary or probability predictions of RimNet for the baseline (p1) and follow-up (p2) sessions. For the consistency analysis, we tested RimNet using the baseline PRL patch as lesion mask in both sessions in order to eliminate possible differences due to the lesion segmentation method.
RESULTS
After experts’ consensus, 54 PRL were found in each session (Figure 1). RimNet achieved an overall accuracy for phase+FLAIR*, phase+T2*, and phase+FLAIR of 87%, 85%, and 82%, respectively. The complete metrics for each separate session are shown in Table 2. The ROC and PR curve, and the relative AUC for the various models, are reported in Figure 2. The phase+FLAIR* model (AUC=0.88) clearly outperformed phase+T2* (AUC=0.83) and phase+FLAIR (AUC=0.72). Of 54 PRL, the phase+FLAIR* model gave the same binary prediction in both sessions for 44 (binary consistency 82%) and a probability consistency (before applying threshold) of 93%. The detailed results per patient of this analysis can be found in Figure 3.DISCUSSION & CONCLUSION
In this work, we not only evaluated RimNet’s generalizability on images acquired on a scanner from a different vendor (compared to the original training4) but also its consistency to make predictions on longitudinal PRL detection. Interestingly, the model trained on phase+T2* but tested on phase+FLAIR* outperformed the model trained and tested on phase+T2* (AUC=0.88 vs AUC=0.83), possibly because of a higher signal-to-noise ratio of FLAIR* vs. T2* images in the testing dataset. The overall results for the best model (phase+FLAIR*) had lower ROC AUC than reported in the original RimNet paper (0.88 vs. 0.94), but a similar PR AUC (0.69 vs. 0.70). This slight underperformance can be explained by the different scanners and acquisition parameters used, but RimNet’s ability to generalize well to an unseen dataset is nevertheless promising. In the longitudinal assessment, the relatively high binary and probability base consistency of >80% and >90%, respectively, indicates that RimNet makes consistent predictions on longitudinal data, at least for two consecutive timepoints. Experts found high PRL consistency, despite the intervening change of DMT. Future work should confirm these hypotheses by studying a larger cohort of patients at more timepoints.Acknowledgements
No acknowledgement found.References
- Absinta M, Sati P, Schindler M, et al. Persistent 7-tesla phase rim predicts poor outcome in new multiple sclerosis patient lesions. J Clin Invest. 2016;126(7):2597-2609. doi:10.1172/JCI86198
- Maggi P, Sati P, Nair G, et al. Paramagnetic Rim Lesions are Specific to Multiple Sclerosis: An International Multicenter 3T MRI Study. Ann Neurol. 2020;88(5):1034-1042. doi:10.1002/ana.25877
- Absinta M, Sati P, Masuzzo F, et al. Association of Chronic Active Multiple Sclerosis Lesions With Disability In Vivo. JAMA Neurol. 2019;76(12):1474. doi:10.1001/jamaneurol.2019.2399
- Barquero G, La Rosa F, Kebiri H, et al. RimNet: A deep 3D multimodal MRI architecture for paramagnetic rim lesion assessment in multiple sclerosis. NeuroImage Clin. 2020;28:102412. doi:10.1016/j.nicl.2020.102412
- Sati P, George IC, Shea CD, Gaitán MI, Reich DS. FLAIR*: A Combined MR Contrast Technique for Visualizing White Matter Lesions and Parenchymal Veins. Radiology. 2012;265(3):926-932. doi:10.1148/radiol.12120208
- Fischl B. FreeSurfer. NeuroImage. 2012;62(2):774-781. doi:10.1016/j.neuroimage.2012.01.021
- Cerri S, Puonti O, Meier DS, et al. A contrast-adaptive method for simultaneous whole-brain and lesion segmentation in multiple sclerosis. NeuroImage. 2021;225:117471. doi:10.1016/j.neuroimage.2020.117471
- Avants B, Epstein C, Grossman M, Gee J. Symmetric diffeomorphic image registration with cross-correlation: Evaluating automated labeling of elderly and neurodegenerative brain. Med Image Anal. 2008;12(1):26-41. doi:10.1016/j.media.2007.06.004
- Smith SM. Fast robust automated brain extraction. Hum Brain Mapp. 2002;17(3):143-155. doi:10.1002/hbm.10062
- van der Walt S, Schönberger JL, Nunez-Iglesias J, et al. scikit-image: image processing in Python. PeerJ. 2014;2:e453. doi:10.7717/peerj.453
Figures
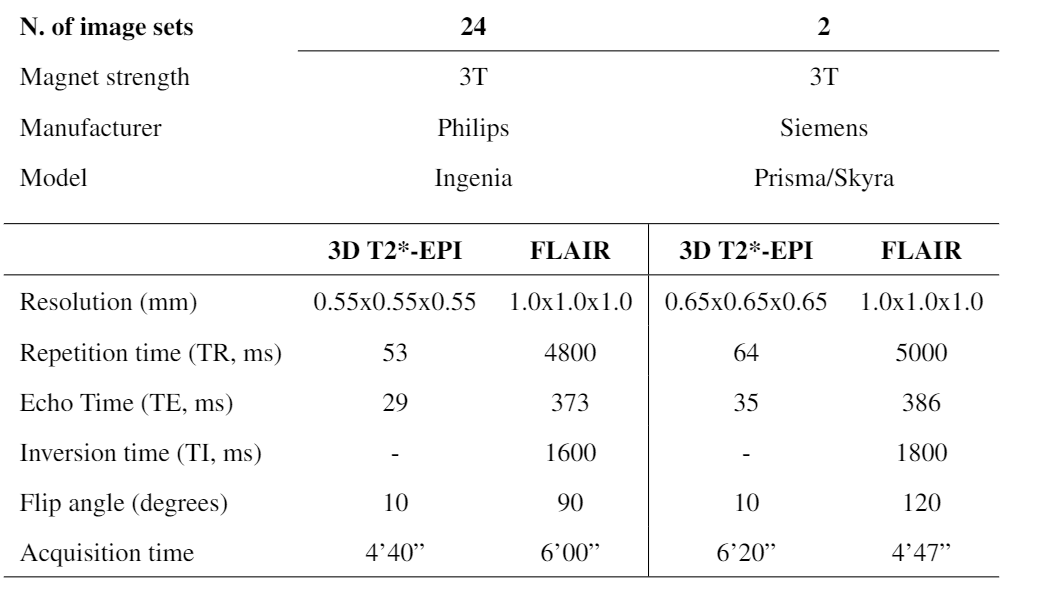
Table 1: MRI
acquisition parameters of the protocol used.
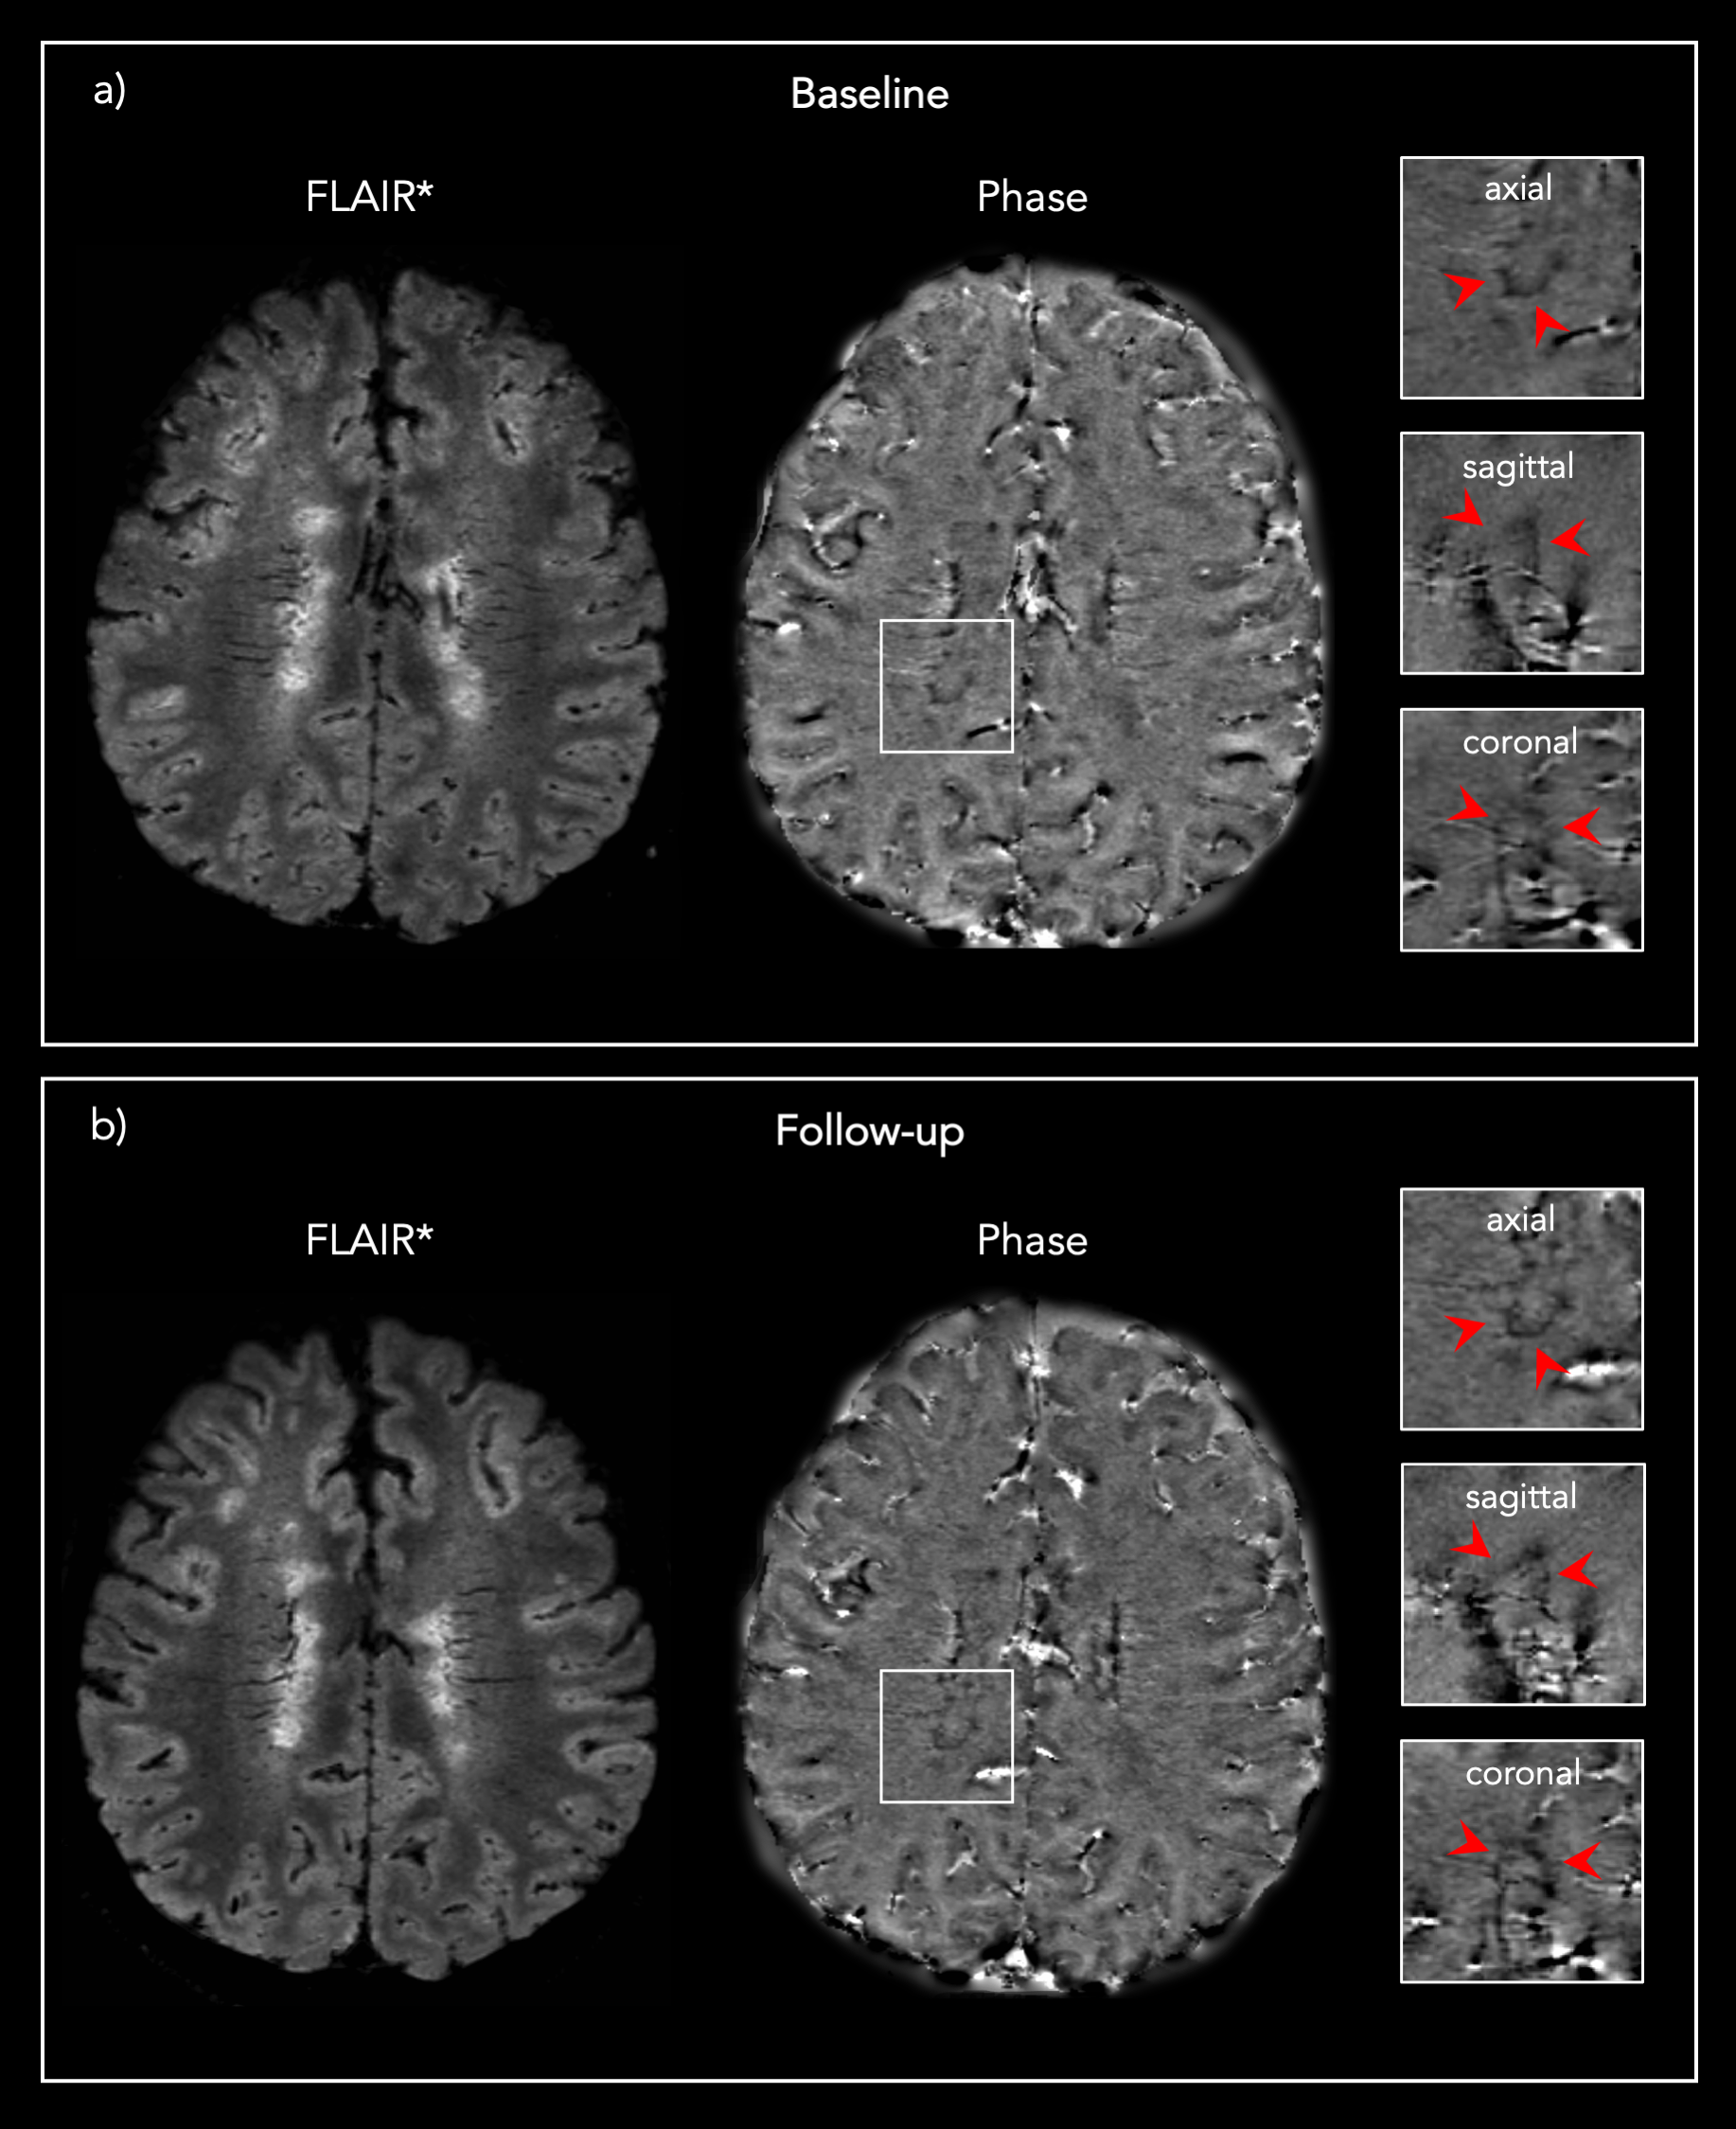
Figure 1: Representative 3D FLAIR* and Phase images from one
PMS patient showing the same PRL a) at baseline and b) at the 13 months post-DMT
follow-up.
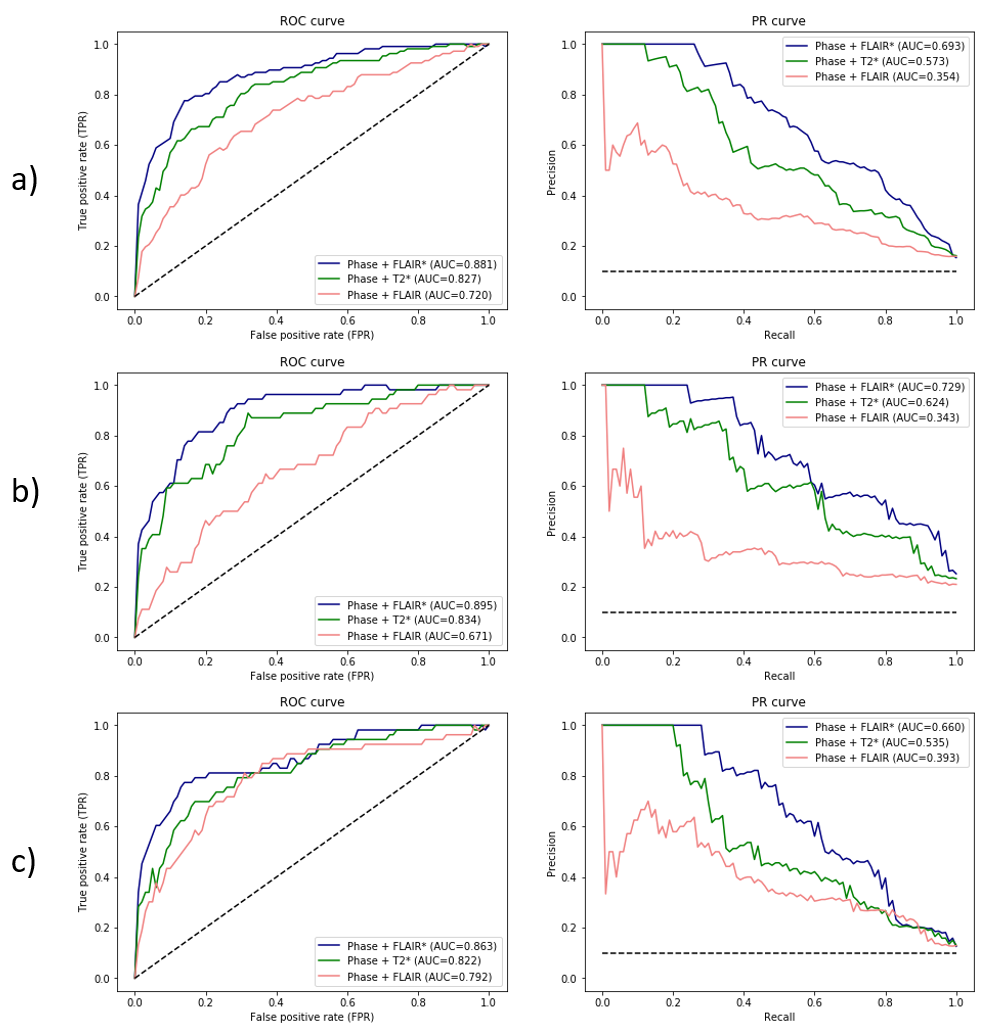
Figure 2: Combined
(Figure 2a) and session-based (baseline Figure 2b and follow-up Figure 2c) receiver-operating
characteristic (ROC) and precision-recall (PR) curves per model tested. AUC: area
under the curve.
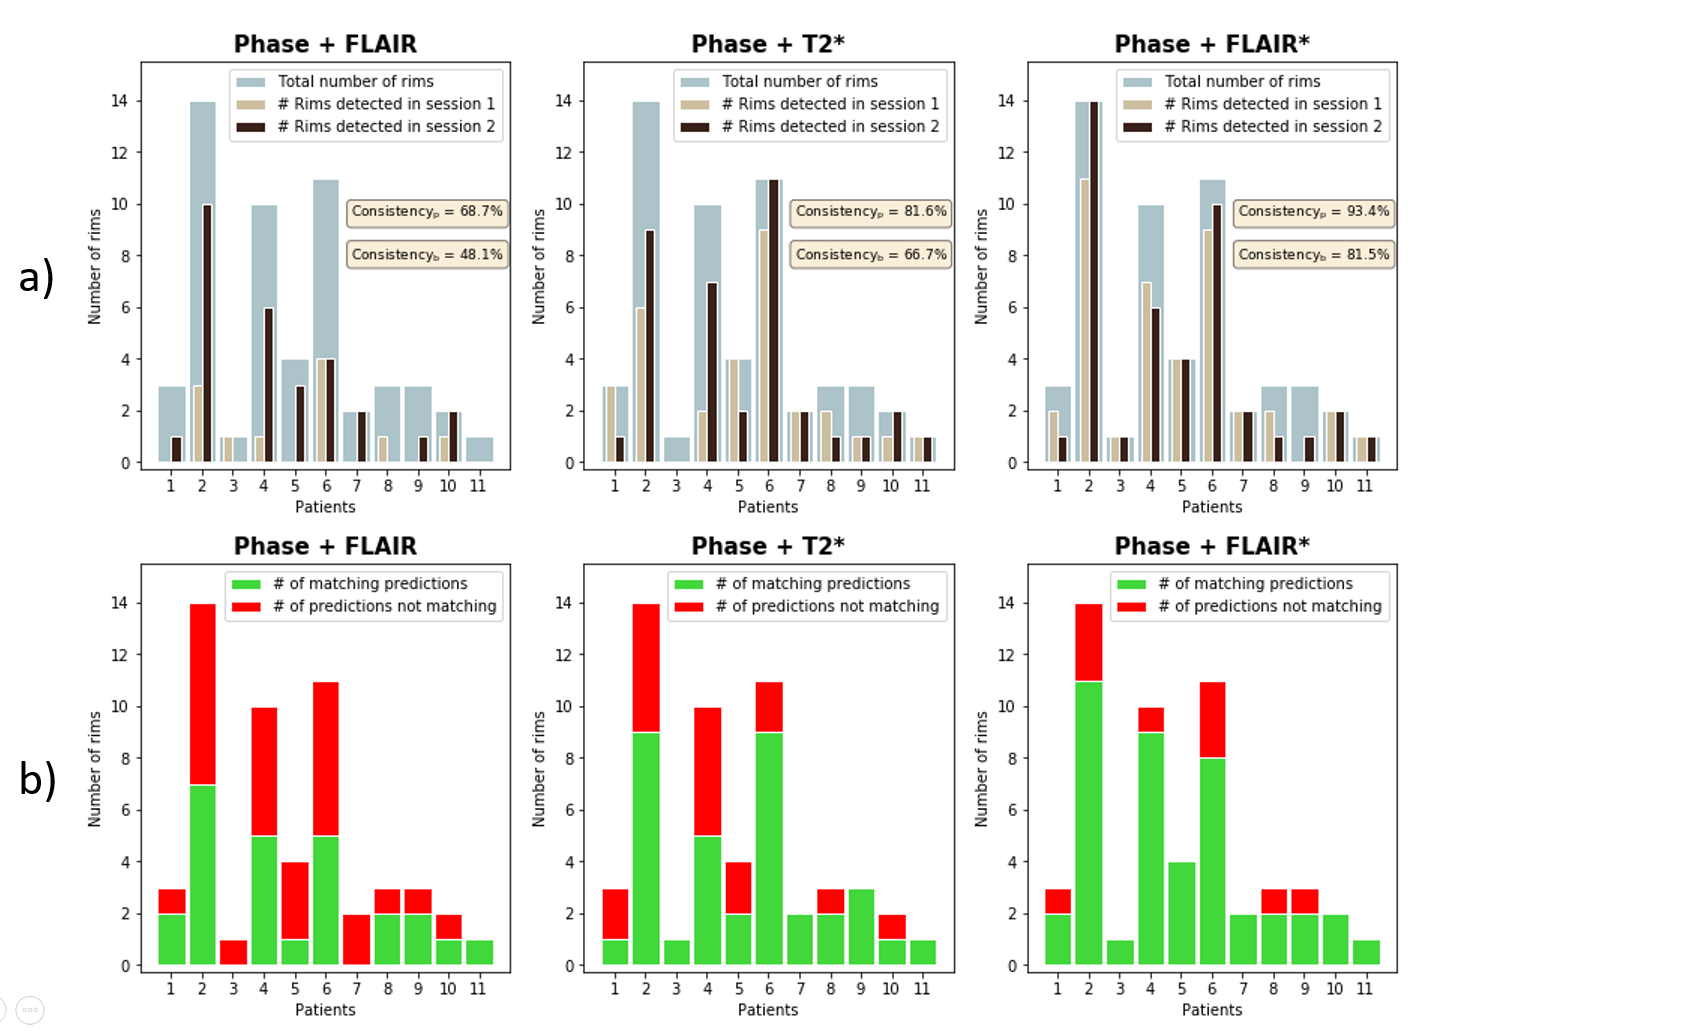
Figure 3: Summary of the lesion-wise results for each patient with paramagnetic rim lesions (n=11 of 13 total patients studied, 85%). a) Number of rims detected in session 1 (baseline) and session 2 (follow-up) for each patient, overlaid on the total number of rims adjudicated in the consensus manual reading. b) Number of matching predictions between baseline and follow-up. Abbreviations: Consistencyp, probability-based consistency; Consistencyb, binary-based consistency.
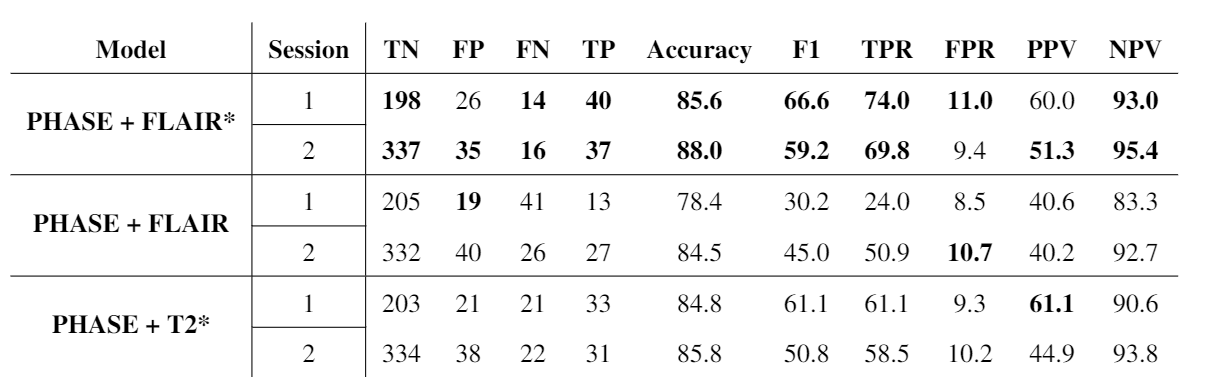
Table 2: Complete
metrics per session for each model tested. Abbreviations: TN, True Negatives;
FP, False Positives; FN, False Negatives; TP, True Positives; TPR, True
Positive Rate; FPR, False Positive Rate; PPV, Positive Predictive Value; NPV,
Negative Predictive Value.