2813
MRI reveals inflammation-mediated demyelination in a cuprizone toxin model of multiple sclerosis1Neuroscience, Genentech, South San Francisco, CA, United States, 2Biomedical Imaging, Genentech, South San Francisco, CA, United States
Synopsis
Multiple sclerosis (MS) is the most common disease of the CNS that causes neurodegeneration and demyelination. MRI can track changes in MS lesions, but how imaging monitors inflammatory cell response or myelin content is not well characterized. In this study, we use a cuprizone toxin mouse model to determine how T2 relaxation time, myelin water fraction (MWF), diffusion tensor imaging (DTI), and gRatio MRI relate to changes with microglia, astrocytes, oligodendrocytes, and myelin. Using longitudinally imaging, MRI was able to detect inflammation-mediated demyelination. T2 reflected changes in inflammation (microglia and astrocytes) while MWF and gRatio suggested demyelination.
Introduction
Multiple sclerosis (MS) is the most common autoimmune disease of the CNS, affecting over 2 million people worldwide. Therapeutic drugs exist to treat MS, yet there remains an unmet medical need to prevent neurodegeneration through promoting myelin repair (1). In vivo MRI can track changes in MS lesions, thus allowing development and evaluation of therapies that promote myelin repair (2). However, studies have been limited in directly and quantitatively comparing imaging with histological endpoints across the whole brain to understand how MRI relates to inflammation and changes in myelin. In this study, we use a cuprizone toxin mouse model of MS to determine how T2 relaxation time, myelin water fraction (MWF), diffusion tensor imaging (DTI), and gRatio MRI relate to changes with microglia, astrocytes, oligodendrocytes, and myelin.Methods
Animal model: Animal procedures were approved by the institutional AAALAC-accredited review board. MRI employed C57Bl/6 male mice (n=12) longitudinally over 3 time points: 1) baseline; 2) 4-week cuprizone; 3) 10-day withdrawal. Histology employed the following groups of C57Bl/6 male mice: 1) chow only as control (n=8); 2) 4-week cuprizone (n=8); 3) 10-day withdrawal following longitudinal MRI (n=12).MRI and image analysis: During imaging, animals were anaesthetized with ~2% isoflurane and maintained at 37°C. Imaging was performed on a Bruker 7T (Billerica, MA) with an 86-mm volume transmit coil and a 4-channel cryogenic surface receive coil. A custom in vivo holder was constructed with 3D printing (Stratasys Dimension) to provide secure positioning of the animal. A T2 map covering the whole brain was generated with a multi-slice multi-echo sequence: TR=4s, TE1/spacing/TE12=6.5/6.5/78ms (12 echoes), matrix=256×256×56, and resolution=75×75×300μm3. Locally shimmed DTI with single-shot EPI readout was acquired: TR=4s, TE=42ms, gradient directions=20, matrix=128×128×56, and resolution=150×150×300μm3. DTI was used to compute fractional anisotropy (FA) and apparent diffusion coefficient (ADC) maps. The multiecho T2 images were processed to compute MWF (3). Axon-to-fiber gRatio (4) was determined from MWF and fiber volume fraction (FVF) using the following equations:
FVF=0.883×FA2-0.082×FA+0.074 (Eq. 1)
gRatio=√(1-MWF/FVF) (Eq. 2)
Absolute gRatio was calibrated with a correction factor of 0.3 to achieve a mean of ~0.7 in white matter of healthy control animals (5). Registration and voxel-based analysis (6) were performed individually on T2 and DTI datasets to identify demyelinating lesions for analysis.
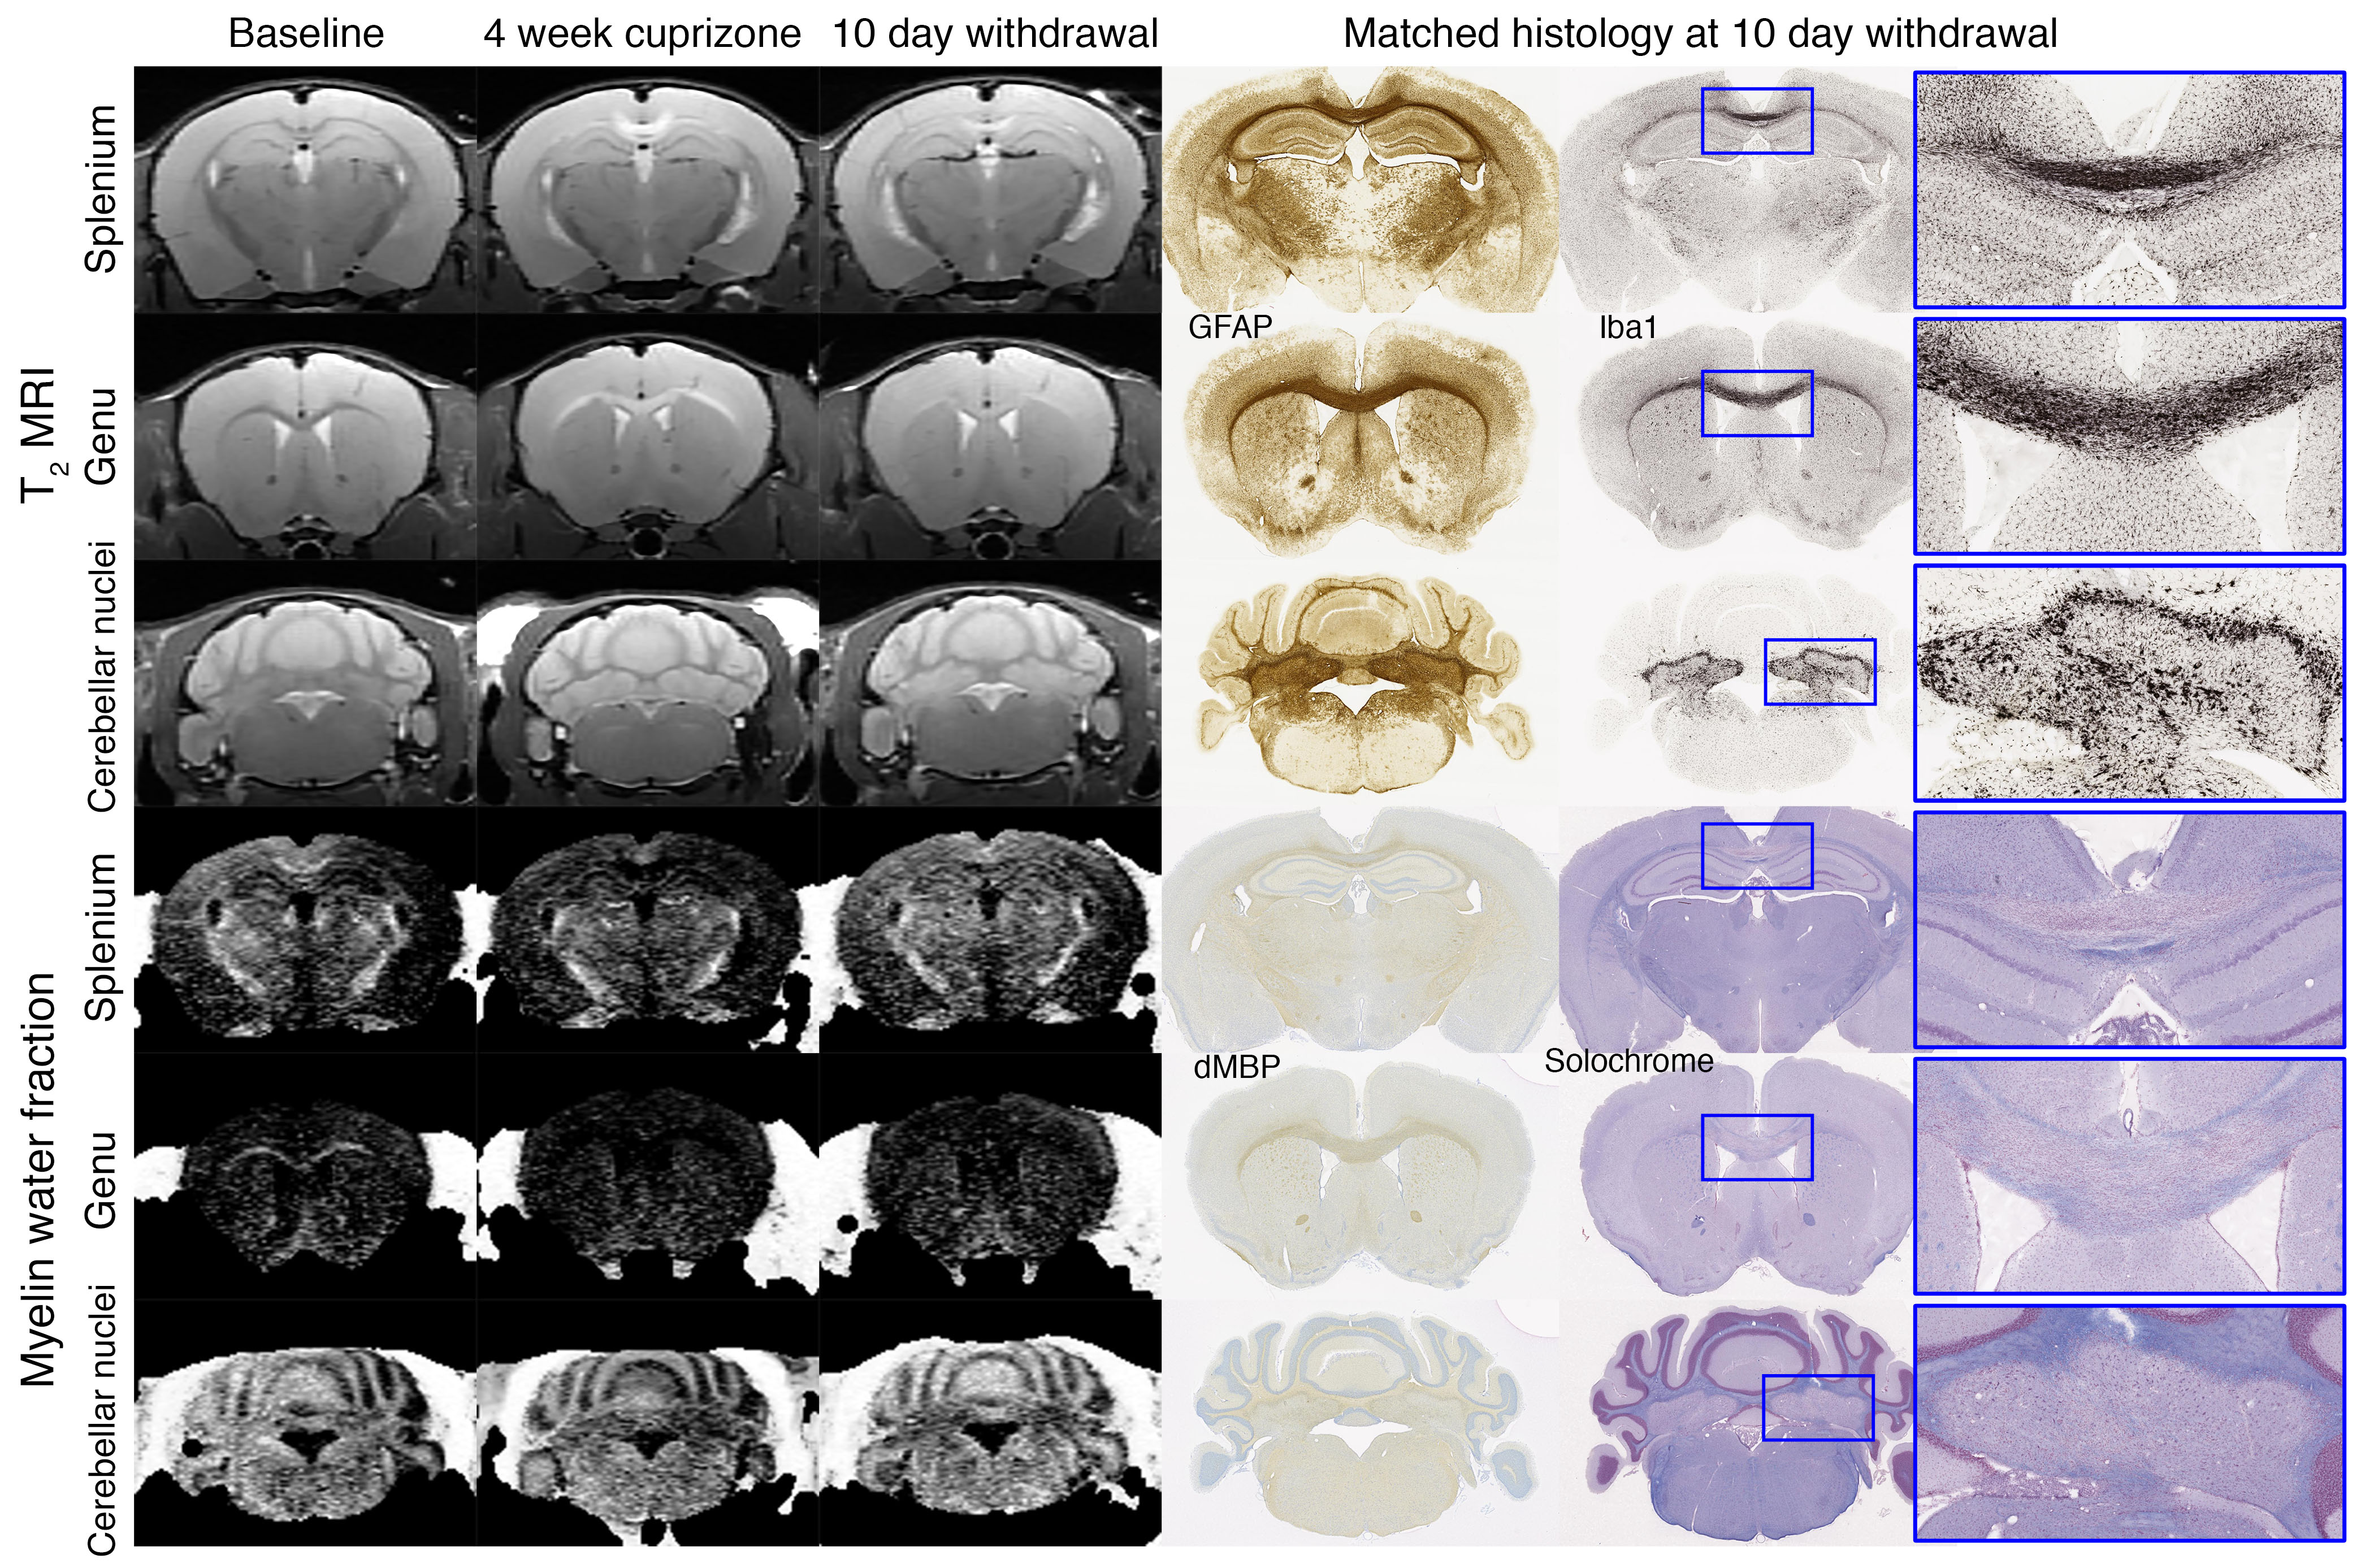
Histology: Following the 10-day withdrawal from cuprizone, animals were perfusion fixed immediately after or the day after imaging. Brain specimens were sectioned and prepared for histological stains: 1) Iba1 for microglia, 2) CD68 for microglia, 3) GFAP for astrocytes, 4) Solochrome for myelin, 5) Oligo2 for oligodendrocytes, and 6) dMBP for denatured myelin basic protein. Histology lesions were quantified by the optical density per unit area within manually defined ROIs.
Results
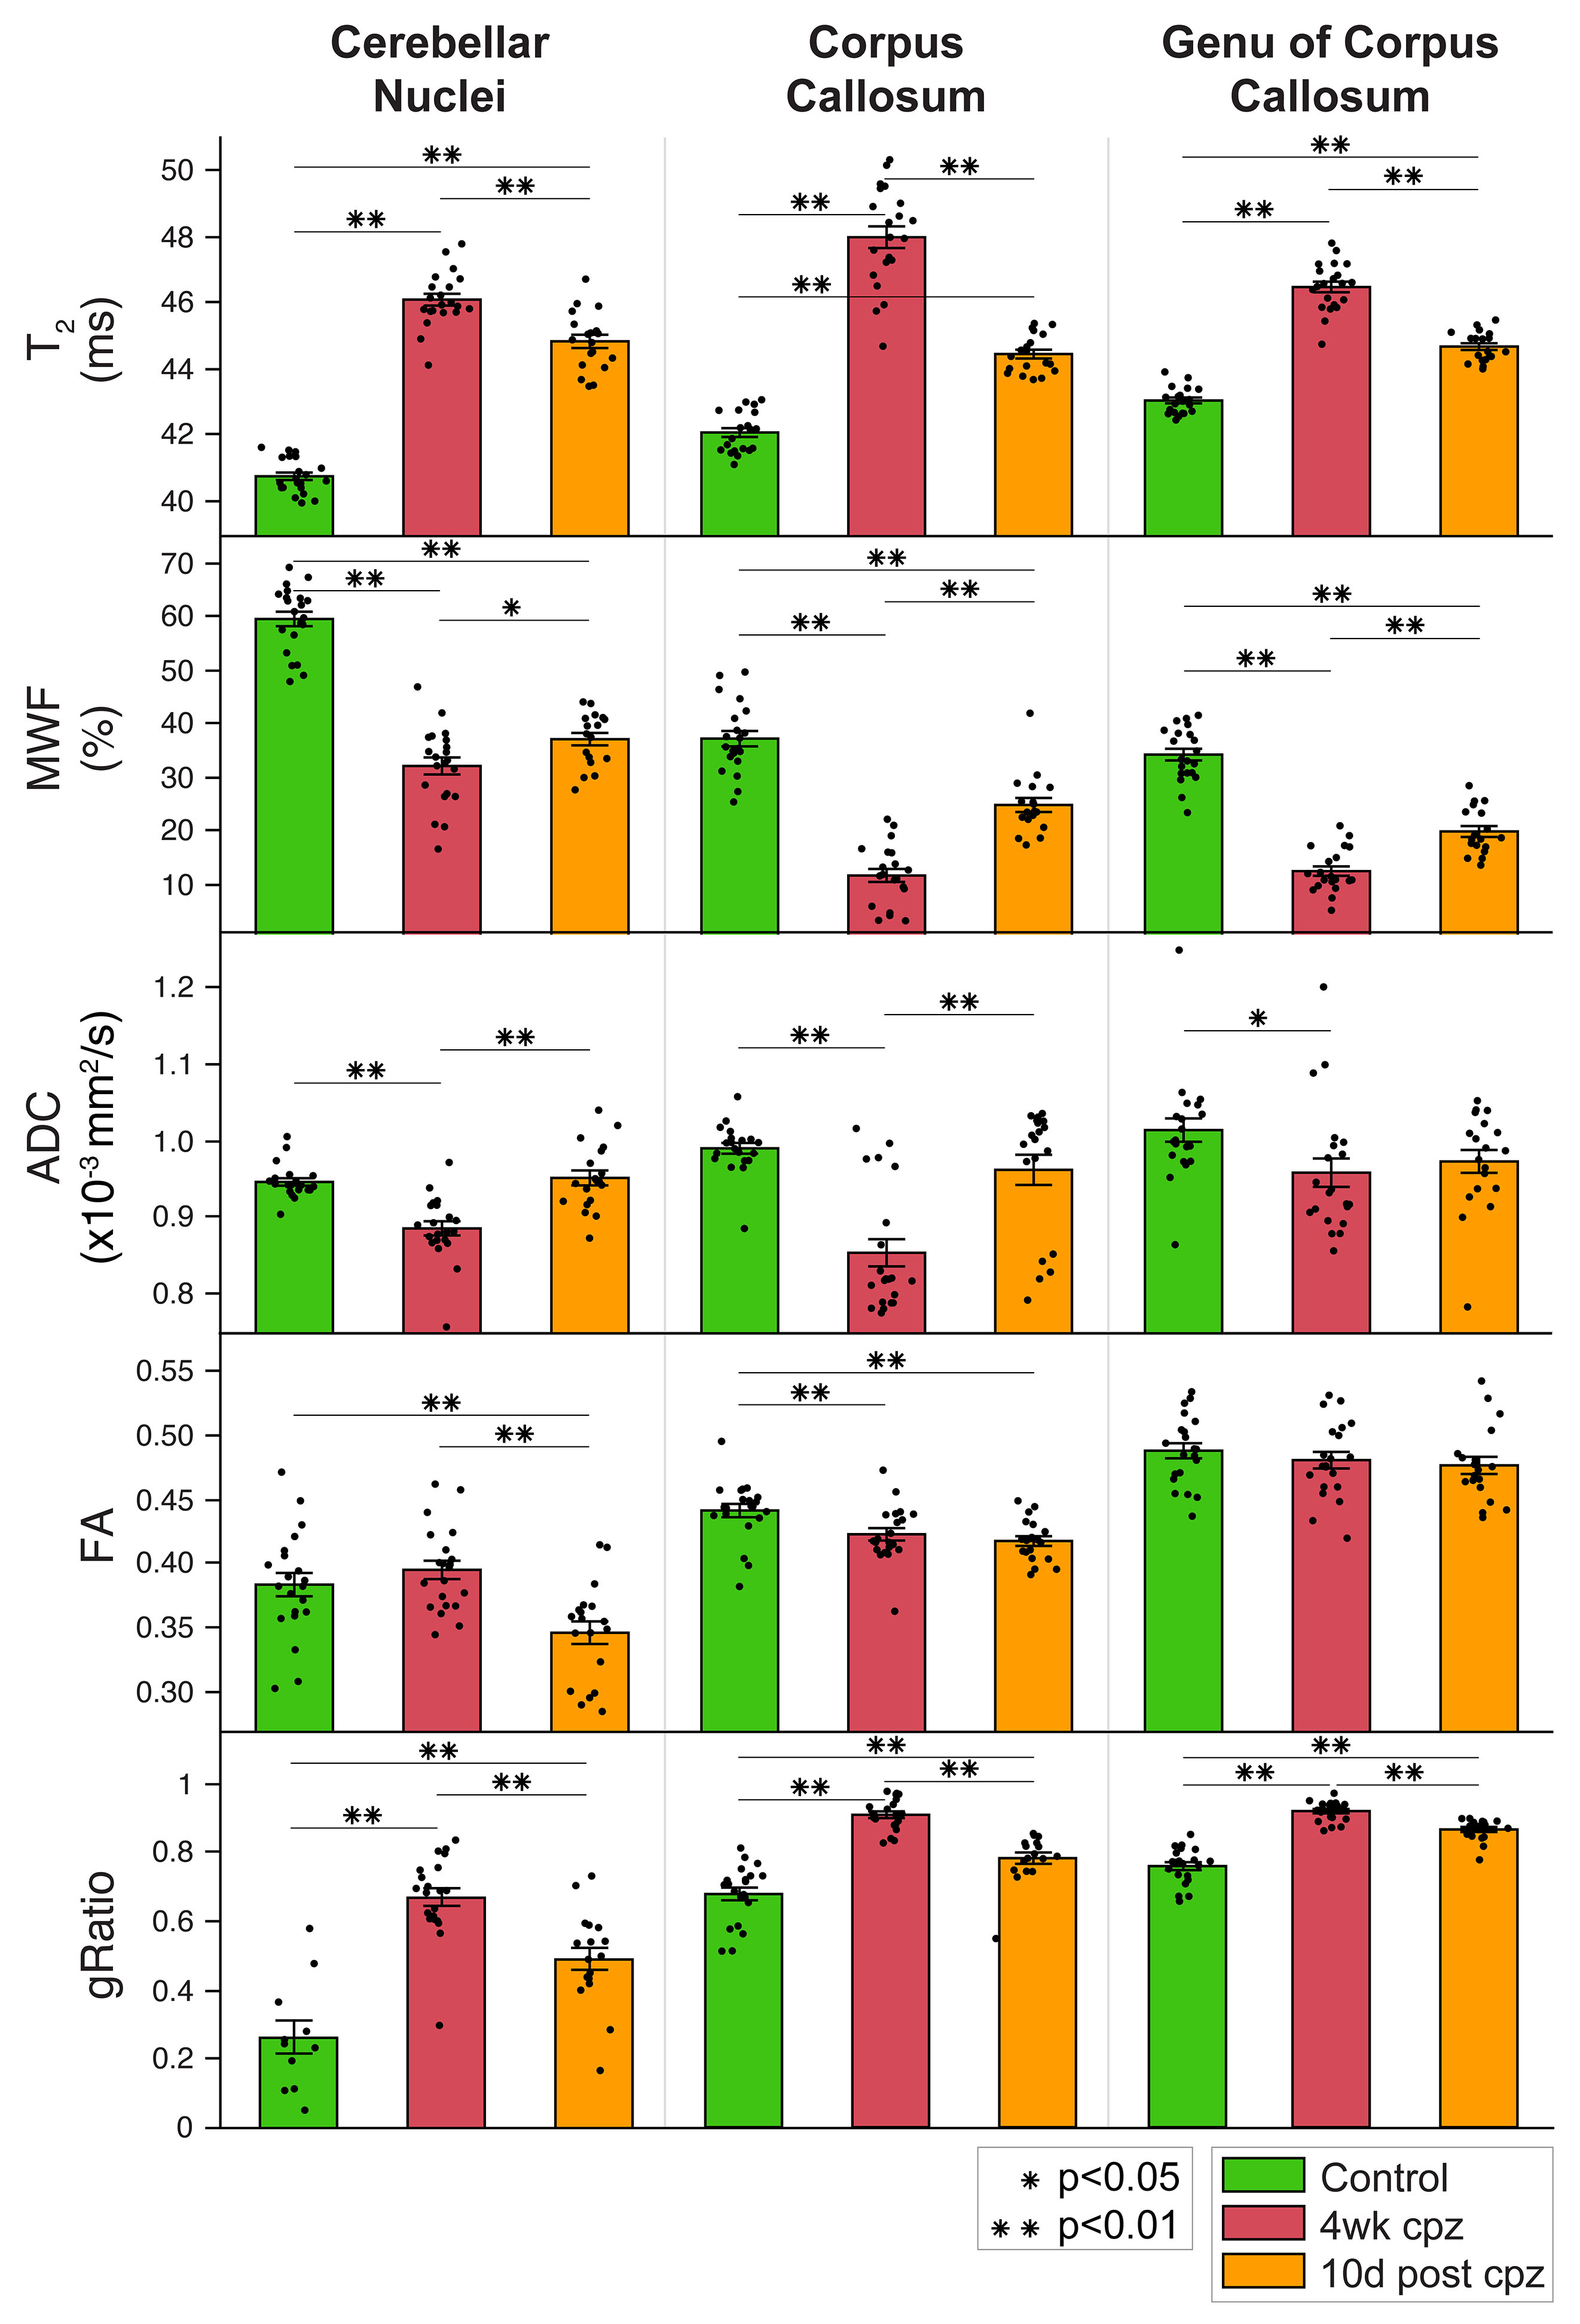
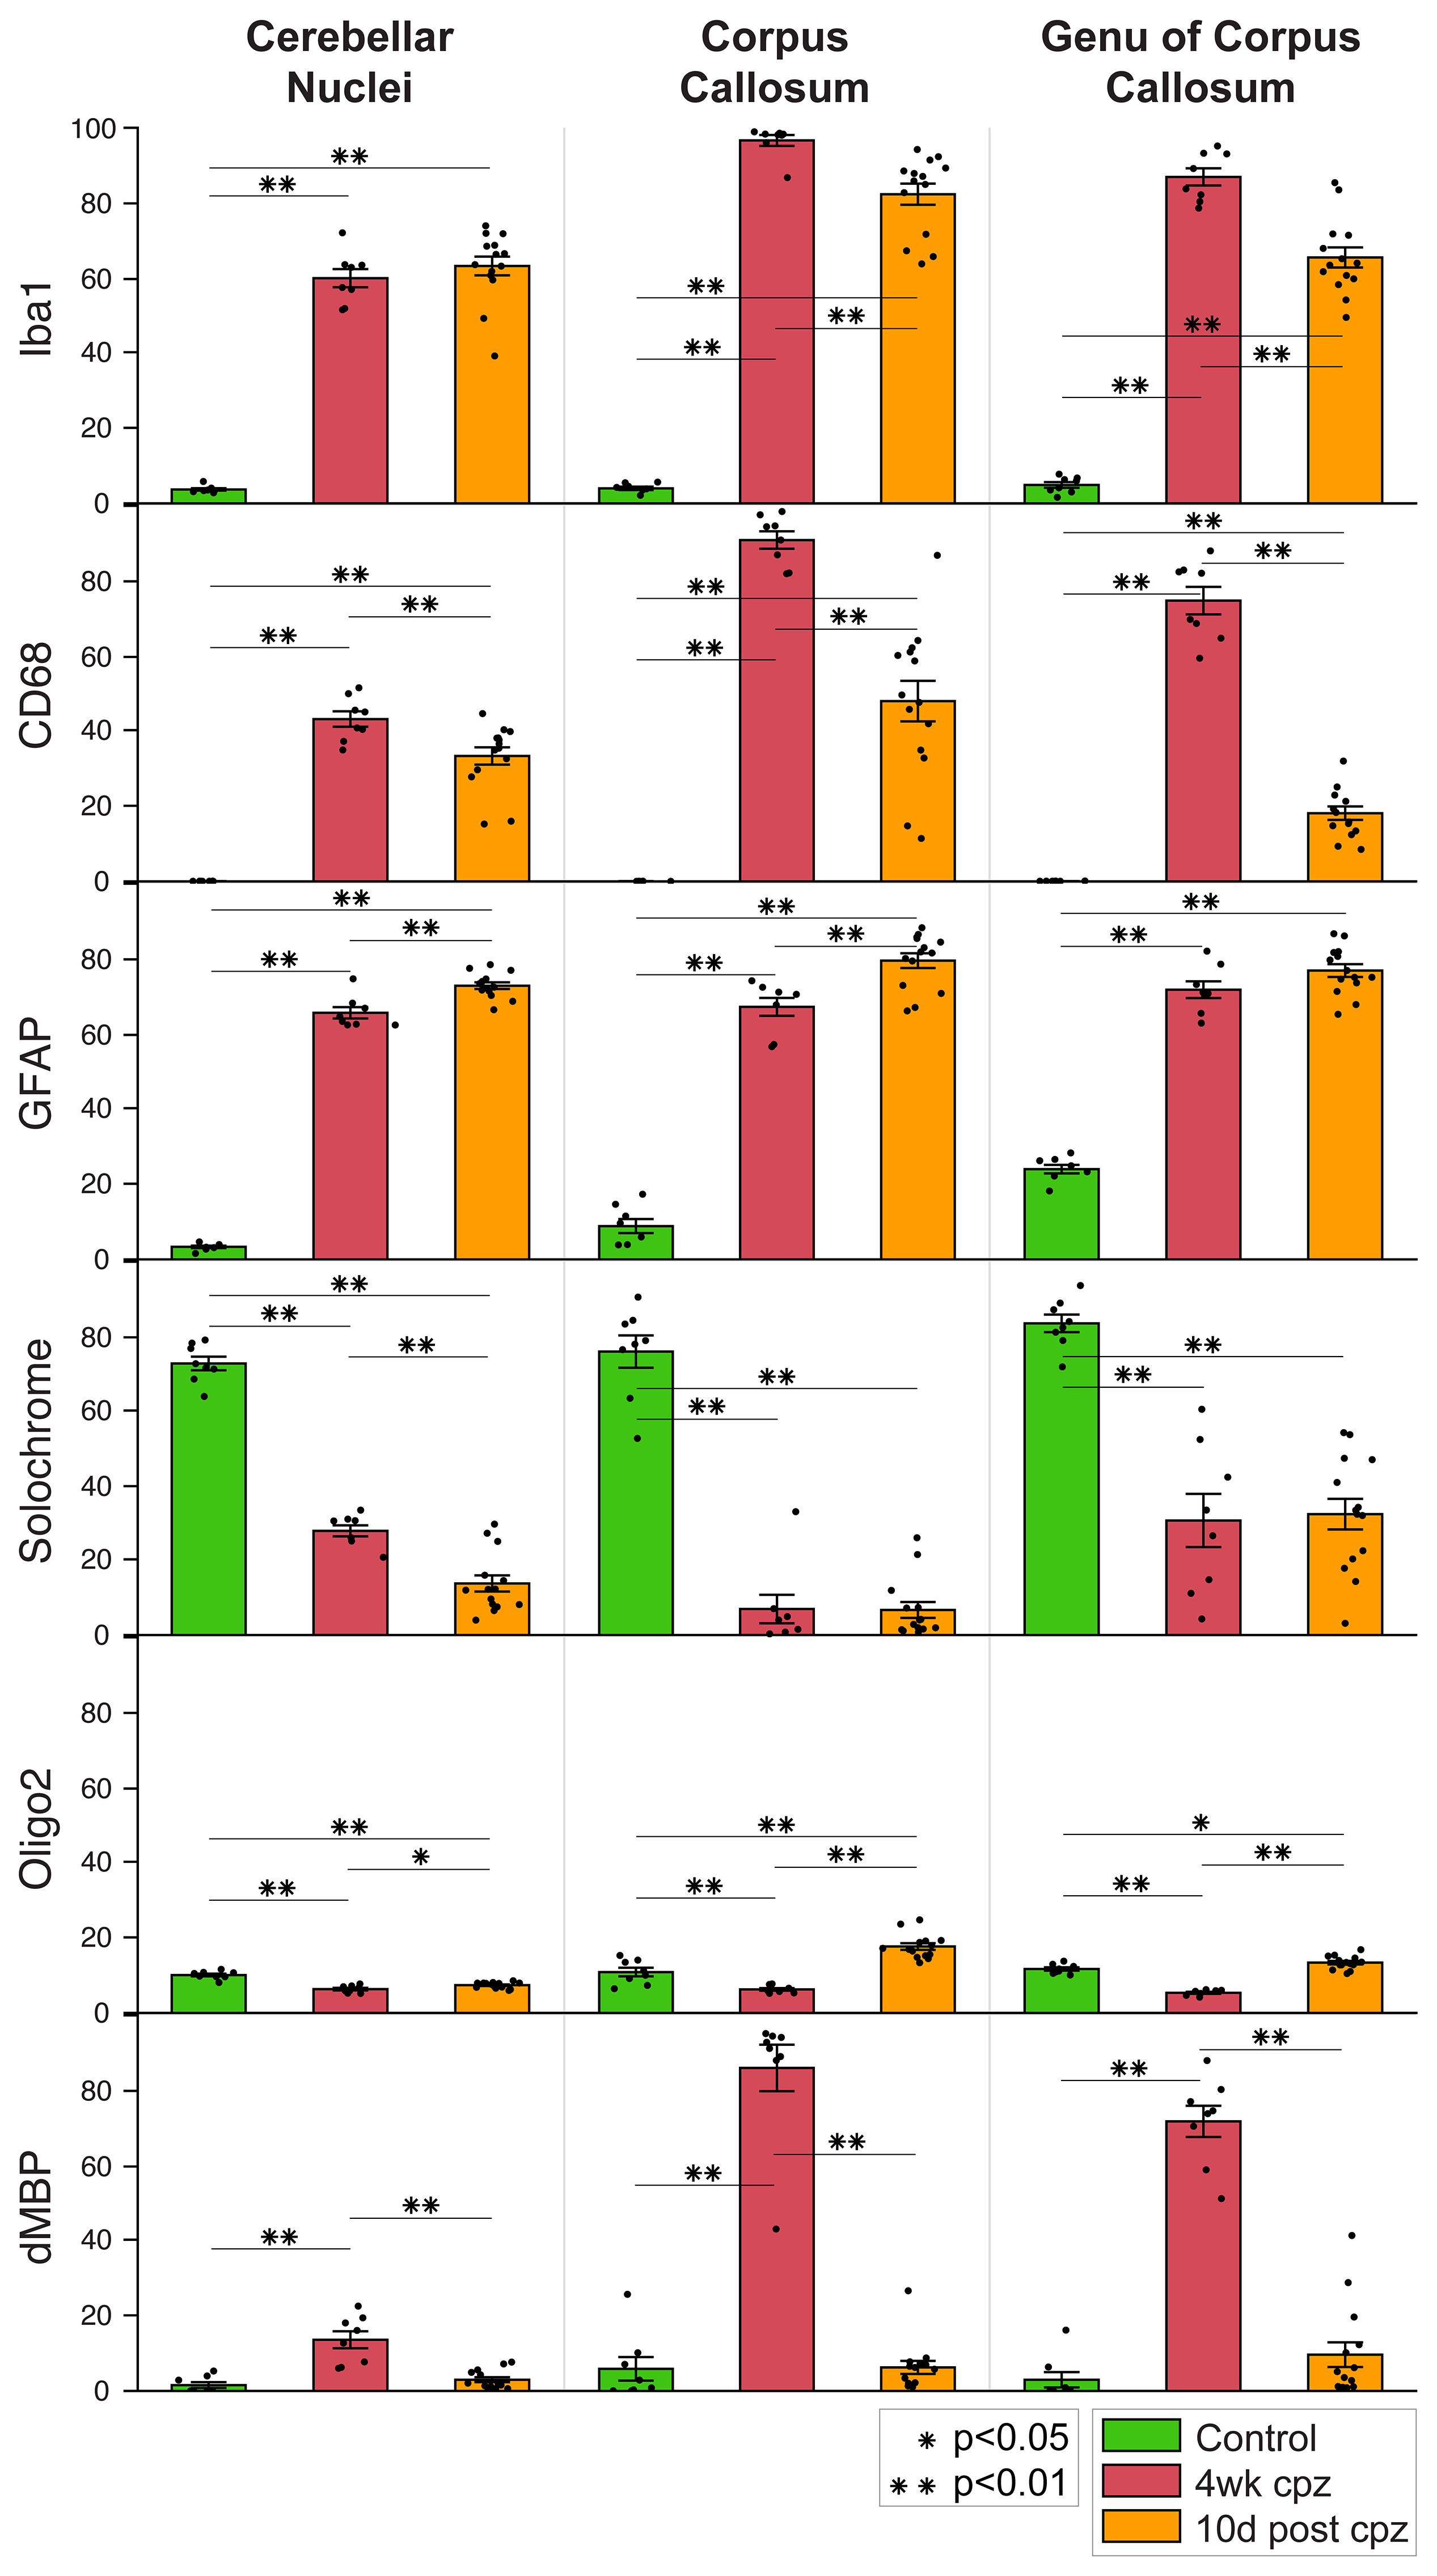
Voxel-based analysis revealed significant lesions in the medial splenium of the corpus callosum, the lateral genu, and the two cerebellar nuclei (Fig. 1). Lesion ROIs were defined by significant increase in T2 and decrease in MWF from baseline to 4-weeks of cuprizone (family-wise error corrected p<0.05). Lesions persisted after 10 days of withdrawal. Across the three time points, T2 and gRatio increased and then decreased (Fig. 2). MWF and ADC tended to decrease and then increase. FA stayed the same or had a modest decrease over time. Generally, CD68, Iba1, and dMBP increased and decreased (Fig. 3). Solochrome tended to decrease and remained low after the 10-day withdrawal. GFAP increased and remained elevated. Oligo2 decreased and recovered over time. These results show a significant inflammation-mediated demyelination. During the 10-day recovery period, the cerebellar nuclei continued to exhibit demyelination. While inflammation did decrease, lesions did not show significant remyelination.Discussion and Conclusion
In this study, we demonstrated that MRI can detect inflammation-mediated demyelination in a cuprizone model. The simultaneous changes across several different metrics suggest there are many biological processes occurring at the same time. Nonetheless from the longitudinal data, T2 reflected changes in inflammation (microglia and astrocytes) better than changes in myelin (solochrome). MWF and gRatio suggest remyelination after withdrawal, however the solochrome stain does not show any remyelination, which indicates that the cellular infiltration may contribute to the short T2 components associated with MWF. This finding demonstrates the challenges in employing a single MRI metric to detect only inflammation or only demyelination. Some of the limitations can be mitigated with additional cross-sectional correlation analysis and extended remyelination with therapy. Together, these results show that MRI can track inflammation and demyelination in an animal model of MS. The methods can be used to determine which metrics are sensitive to inflammation and myelin content and for evaluating novel MS therapies.Acknowledgements
No acknowledgement found.References
1. Hooijmans CR, Hlavica M, Schuler FAF, Good N, Good A, Baumgartner L, Galeno G, Schneider MP, Jung T, de Vries R, Ineichen BV. Remyelination promoting therapies in multiple sclerosis animal models: a systematic review and meta-analysis. Sci Rep 2019;9(1):822.
2. Stikov N, Campbell JS, Stroh T, Lavelee M, Frey S, Novek J, Nuara S, Ho MK, Bedell BJ, Dougherty RF, Leppert IR, Boudreau M, Narayanan S, Duval T, Cohen-Adad J, Picard PA, Gasecka A, Cote D, Pike GB. In vivo histology of the myelin g-ratio with magnetic resonance imaging. NeuroImage 2015;118:397-405.
3. Karakuzu A, Boudreau M, Duval T, Boshkovski T, Leppert IR, Cabana J-F, Gagnon I, Beliveau P, Pike GB, Cohen-Adad J, Stikov N. qMRLab: Quantitative MRI analysis, under one umbrella. Journal of Open Source Software 2020;5(53):1-4.
4. Stikov N, Perry LM, Mezer A, Rykhlevskaia E, Wandell BA, Pauly JM, Dougherty RF. Bound pool fractions complement diffusion measures to describe white matter micro and macrostructure. NeuroImage 2011;54(2):1112-1121.
5. Campbell JSW, Leppert IR, Narayanan S, Boudreau M, Duval T, Cohen-Adad J, Pike GB, Stikov N. Promise and pitfalls of g-ratio estimation with MRI. NeuroImage 2018;182:80-96.
6. Barck KH, Malesky K, Gandham V, Hedehus M, Dominguez S, Meilandt WJ, Pichon CEL, Foreman O, Levie KS, Carano RA. Characterization of Transgenic Mouse Models of Alzheimer's Disease by Fully Automated Analysis of Brain MRI. ISMRM 2013; Salt Lake City, Utah. p 1037.
Figures