2812
Characterization of multiple sclerosis lesion types with texture analysis of advanced and conventional MRI1Biomedical Engineering program, Schulish School of Engineering, University of Calgary, Calgary, AB, Canada, 2Department of Radiology and Clinical Neurosciences, Hotchkiss Brain Institute, University of Calgary, Calgary, AB, Canada
Synopsis
Multiple sclerosis (MS) lesion characterization using MRI is valuable for monitoring MS and probing remyelination therapies. However, there is a lack of in-vivo MRI metrics in clinical studies. We assessed MS lesion types using statistical texture measures of advanced and conventional MRIs, accompanied by random forest classification and percentile statistics, to differentiate MS lesions based on myelination. The best texture parameters and percentiles that classified re- and de-myelinated lesions were derived from histology-verified MRI. Applying the established parameters from postmortem to in-vivo MRI identified two types of lesions: highly demyelinated and potentially remyelinated.
Introduction
Multiple sclerosis (MS) is an inflammatory demyelinating disease of the central nervous system, characterized by a variety of pathological components including demyelination and remyelination1. This makes lesion properties highly heterogenous2,3 and difficult to characterize in-vivo. There are various studies searching for MRI biomarkers of de- and re-myelination in MS using advanced MRI4,5. However, there is still lack of MRI metrics to measure MS lesion types in clinical studies. Here, we aimed to evaluate lesion types, including de- and re-myelination, using texture analysis of advanced and conventional MRIs in postmortem MS patients, and then, using knowledge generated from postmortem data, in living MS patients. This is beneficial to monitor disease development or remyelination treatment.Method
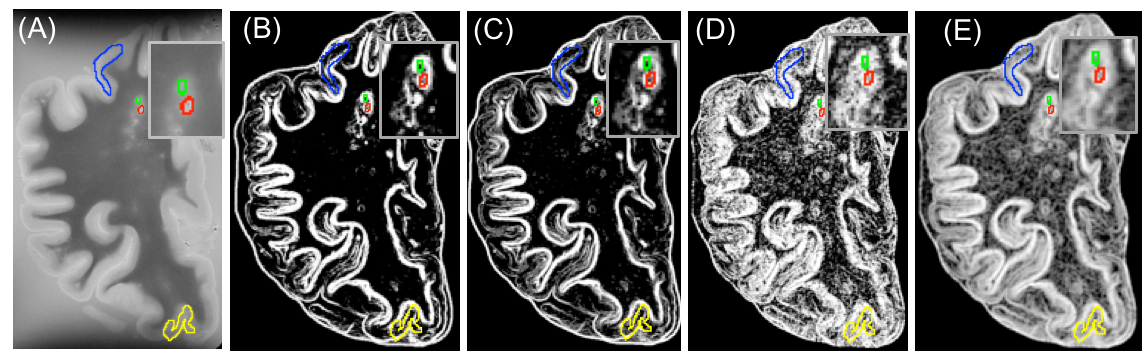
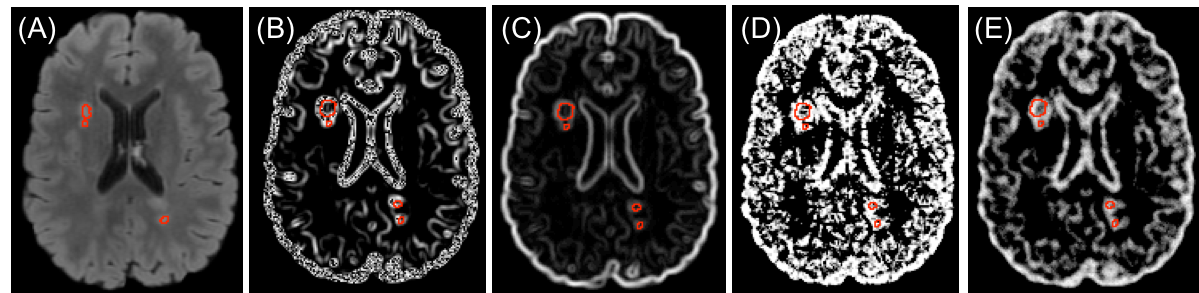
In postmortem assessment, texture analysis was conducted on fresh postmortem MRIs from 15 MS patients. MS tissue included de- and re-myelinated lesions and normal appearing areas in white and grey matter plus diffusely abnormal white matter. Texture maps were calculated from T2-weighted MRI (TR = 4000 ms, TE = 19.1/38.2/57.3, FOV=100×80mm2 , matrix=1000×80) and diffusion tensor MRI (b=1500, 30 directions, FOV=100×80mm2 , matrix=50×40). The former used a grey level co-occurrence matrix (GLCM) method, with measures including angular second moment (ASM), entropy, contrast, correlation, dissimilarity, and an entropy filter. In diffusion texture analysis, we interpolated the number of diffusion directions from the initial 30 to 90 prior to texture analysis. A new voxel-based approach was employed to calculate ASM and entropy maps from diffusion MRI6. For comparison, we included advanced MRI measures, such as fractional anisotropy (FA) from diffusion MRI and magnetization transfer ratio (MTR). A random forest (RF) algorithm with cross-validation was used for classifying MS tissue types including de- and re-myelinated lesions. Subsequently, employing a feature ranking algorithm, recursive feature elimination (RFE), the most predictive parameters were selected (Figure1). Classification accuracy was assessed using kappa statistics, where higher kappa represents more reliable accuracy7. Afterwards, we applied a percentile approach, using the best parameters selected by the RFE and cross-validated RF algorithm, to determine how they differentiate highly demyelinated lesions from remyelinated ones. Percentiles tested were: 15th, 20th, and 25th for remyelinated lesions, and percentile >75% were used to define highly demyelinated lesions, similar to the literature8. For In-vivo analysis, FLAIR MRI (TR/TE = 6000/84 ms, FOV=240×240mm2 , matrix =512 x512) was used to calculate texture maps from 70 relapsing-remitting MS (RRMS) patients participated in a clinical study (Figure 2). In-vivo lesion segmentation was done employing LST9, on registered FLAIR to T1-weighted MRI. Diffusion tensor imaging was also conducted in-vivo and diffusion texture metrics were calculated using the same approach as ex-vivo. Mean texture values were calculated in lesions for further analysis. Based on the best parameters and the associated percentile threshold selected from the histology-verified data, we evaluated in-vivo data from the RRMS patients. Similarly, in-vivo lesions were divided into highly demyelinated and potentially remyelinated.Results
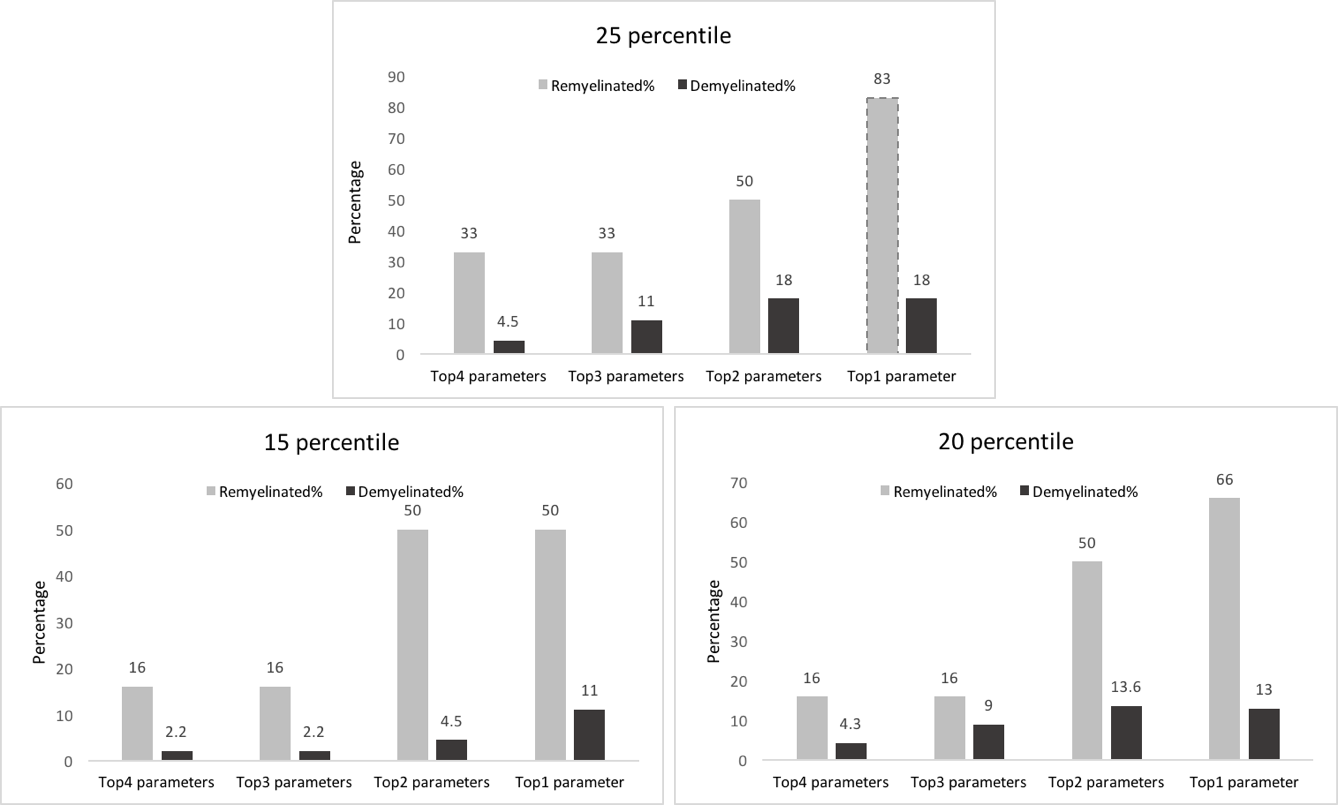
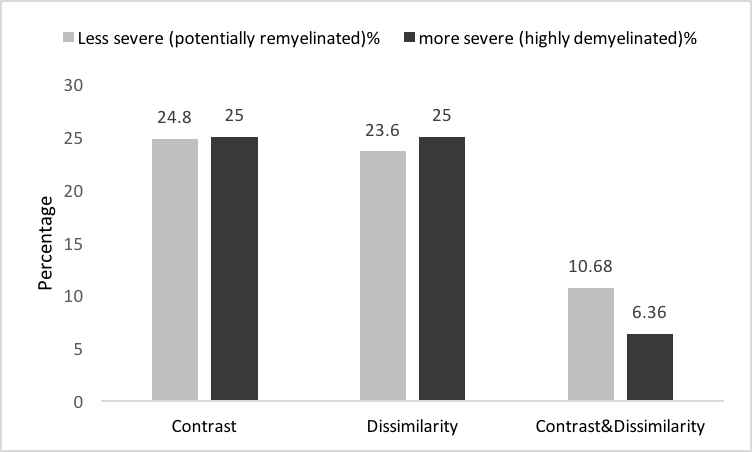
We had moderate to near perfect accuracy (kappa: 0.55 - 0.94) in classifying different tissue types including de- and re-myelinated lesions employing RF in postmortem analysis of MRI texture. Contrast and dissimilarity were the most important parameters and followed by entropy, and entropy filter (Table 1). The 25th percentile of contrast and dissimilarity showed the most accuracy for detecting re-myelinated lesions (Figure 3). Using the 75th percentile threshold, 29.5% of postmortem white matter lesions were categorized as highly demyelinated. Utilizing these parameters on in-vivo data, contrast values lower than the 25th percentile resulted in 2391 (24.8%) lesions as potentially remyelinated lesions, which were seen in 98.5% of patients. Using both contrast and dissimilarity values lower than the 25th percentile, we found 11% of lesions as potentially remyelinated, which were found in 87% of patients (Figure 4). However, the percentage of lesions identified as remyelinating varied significantly across patients. Employing contrast values higher than the 75th percentile, we found 2412 lesions (25%) as highly demyelinated across all patients. When considering both contrast and dissimilarity values higher than 75th percentile, we categorized 6% of lesions as highly demyelinated. More than 78% of patients had this type of lesions (Figure 4).Discussion
We utilized texture analysis to differentiate highly demyelinated and potentially remyelinated MS lesions. The approach was validated using histology-verified data first and then applied to in-vivo data. We found that most MS patients possess both types of lesions, but with different proportions, (0-38)%: potentially remyelinated, and (6-41)%: highly demyelinated lesions. This is consistent with a recent study that found both types of MS lesions, regarding the severity of the lesions, existed in most of their subjects5. Using contrast and dissimilarity, we detected 10-25% of lesions as potentially remyelinated, which is accordant with that reported in the literature10. The two lesion types identified here, may be useful to monitor the disease or treatment by estimating the level of damage or repair in lesions.Conclusion
Texture analysis of conventional MRI is promising for detection of MS lesions with de- or re-myelinated alteration. The approach proposed here to detect potentially remyelinated lesions may become a valuable MRI biomarker for in-vivo studies to monitor disease progression or remyelination treatment. The association between the proportion of the detected lesion types and clinical disability deserves further investigation.Acknowledgements
This research was funded by Natural Science and Engineering Council of Canada (NSERC), MS Society of Canada, and Alberta Innovates- Health Solutions.References
1. Lassmann H. Multiple sclerosis pathology. Cold Spring Harbor perspectives in medicine. 2018 Mar 1;8(3):a028936.
2. Lucchinetti C, Brück W, Parisi J, Scheithauer B, Rodriguez M, Lassmann H. Heterogeneity of multiple sclerosis lesions: implications for the pathogenesis of demyelination. Annals of Neurology: Official Journal of the American Neurological Association and the Child Neurology Society. 2000 Jun;47(6):707-17.
3. Faizy TD, Thaler C, Kumar D, Sedlacik J, Broocks G, Grosser M, Stellmann JP, Heesen C, Fiehler J, Siemonsen S. Heterogeneity of multiple sclerosis lesions in multislice myelin water imaging. PLoS One. 2016 Mar 18;11(3):e0151496.
4. Lipp I, Jones DK, Bells S, Sgarlata E, Foster C, Stickland R, Davidson AE, Tallantyre EC, Robertson NP, Wise RG, Tomassini V. Comparing MRI metrics to quantify white matter microstructural damage in multiple sclerosis. Human brain mapping. 2019 Jul;40(10):2917-32.
5. Martínez-Heras E, Solana E, Prados F, Andorrà M, Solanes A, López-Soley E, Montejo C, Pulido-Valdeolivas I, Alba-Arbalat S, Sola-Valls N, Sepúlveda M. Characterization of multiple sclerosis lesions with distinct clinical correlates through quantitative diffusion MRI. NeuroImage: Clinical. 2020 Jan 1;28:102411.
6. Fozouni N, Chopp M, Nejad-Davarani SP, Zhang ZG, Lehman NL, Gu S, Ueno Y, Lu M, Ding G, Li L, Hu J. Characterizing brain structures and remodeling after TBI based on information content, diffusion entropy. PLoS One. 2013 Oct 15;8(10):e76343.
7. Landis JR, Koch GG. The measurement of observer agreement for categorical data. biometrics. 1977 Mar 1:159-74.
8. Chen JT, Collins DL, Freedman MS, Atkins HL, Arnold DL, Canadian MS/BMT Study Group. Local magnetization transfer ratio signal inhomogeneity is related to subsequent change in MTR in lesions and normal-appearing white-matter of multiple sclerosis patients. Neuroimage. 2005 May 1;25(4):1272-8. 9. Schmidt et al., 2012, www.statisticalmodelling.de/lst.html
10. Patrikios P, Stadelmann C, Kutzelnigg A, Rauschka H, Schmidbauer M, Laursen H, Sorensen PS, Brück W, Lucchinetti C, Lassmann H. Remyelination is extensive in a subset of multiple sclerosis patients. Brain. 2006 Dec 1;129(12):3165-72.
Figures