2806
Diffusion Compartment Imaging Characterization of White Matter Microstructural Changes in Pediatric Onset Multiple Sclerosis1Radiology, Boston Children's Hospital, Boston, MA, United States, 2Radiology, Harvard Medical School, Boston, MA, United States
Synopsis
DTI has been used to evaluate brain microstructure in MS lesions and normal appearing white matter (NAWM). A DIAMOND model with an isotropic compartment + an anisotropic compartment may help disentangle the individual contribution of the compartments arising within a voxel, more accurately reflecting changes in the WM microstructure. In addition to finding differences in cAD, cRD, cMD and cFA, compartment diffusion model heterogeneity index was found to be significantly different in lesions. Our results support that a DIAMOND analysis can provide insights to MS lesion microstructure beyond conventional DTI metrics.
Introduction
Immune mediated axonal damage underlies clinical disability and cognitive decline in MS. Many studies have utilized DTI to evaluate brain microstructure in lesions and non-lesion white matter (WM)1. While DTI is sensitive to some tissue changes in MS, the DTI model combines the signal arising from all tissues within a voxel (cells, extracellular space, myelin) and is unable to disentangle their individual contribution. The recently introduced DIAMOND model can address this issue. The compartments are characterized by a finite mixture model, and the diffusivity properties of each compartment in 3D is represented by a continuous parametric statistical distribution of diffusion tensors2. This enables the assessment of compartment-specific diffusion characteristics while also capturing the intra-compartment heterogeneity. In this work, we utilized the DIAMOND model of diffusion to characterize pathologic changes in lesion white matter in patients with pediatric-onset MS (POMS) relative to normal appearing white matter (NAWM). Then, we compared POMS NAWM to controls. Changes in conventional DTI were estimated as a reference.Materials and Methods
IRB approved and HIPAA compliant study. We prospectively recruited patients with a diagnosis of POMS by MacDonald criteria [2017] and controls. Patients with clinical concern for recent (within 30 day) attack were excluded. 11 patients were included in the study, all of which met criteria for relapsing and remitting MS (RRMS). 10 healthy volunteers were recruited as control subjects.3T structural and diffusion imaging included: (a) T1-weighted MPRAGE (FOV=220mm, matrix=220×220, 176 slices, resolution=1 × 1 × 1mm3, TE=2.27ms, TI=1100ms, TR=2000 4min 50sec) (b) 3D T2-weighted (FOV=220mm, Matrix=256x256, 144 slices, slice thickness 0.9mm, TR=3200ms, TE=441ms, 6min 10 sec), (c) 3D T2-weighted FLAIR acquisitions (FOV=220mm, Matrix=256x256, 160 slices, slice thickness 0.9mm, TR=5000ms, TE=393ms, TI=1800ms, 5min 52 sec), and (d) Cube and Sphere (CUSP) 90 gradient set3 (3 inner-shells of 6 directions at b = 400, 600, 800s/mm2 and 7 b = 0s/mm2 images, FOV = 220mm, matrix = 128 × 128, 71 slices, resolution = 1.7 × 1.7×2mm3,TR = 10704ms,TE = 78ms, Partial Fourier = 6/8, iPAT = 2, Pixel bandwidth = 1396Hz/pixel). Then, a one isotropic compartment + single anisotropic compartment DIAMOND model2 was estimated, along with conventional DTI parameters. Compartment axial diffusivity (cAD), radial diffusivity (cRD), fractional anisotropy (cFA), mean diffusivity (cMD), heterogeneity index (HEI), and free water fraction scalar maps were estimated for the DIAMOND model. AD, RD, FA, and MD were estimated for the DTI model.
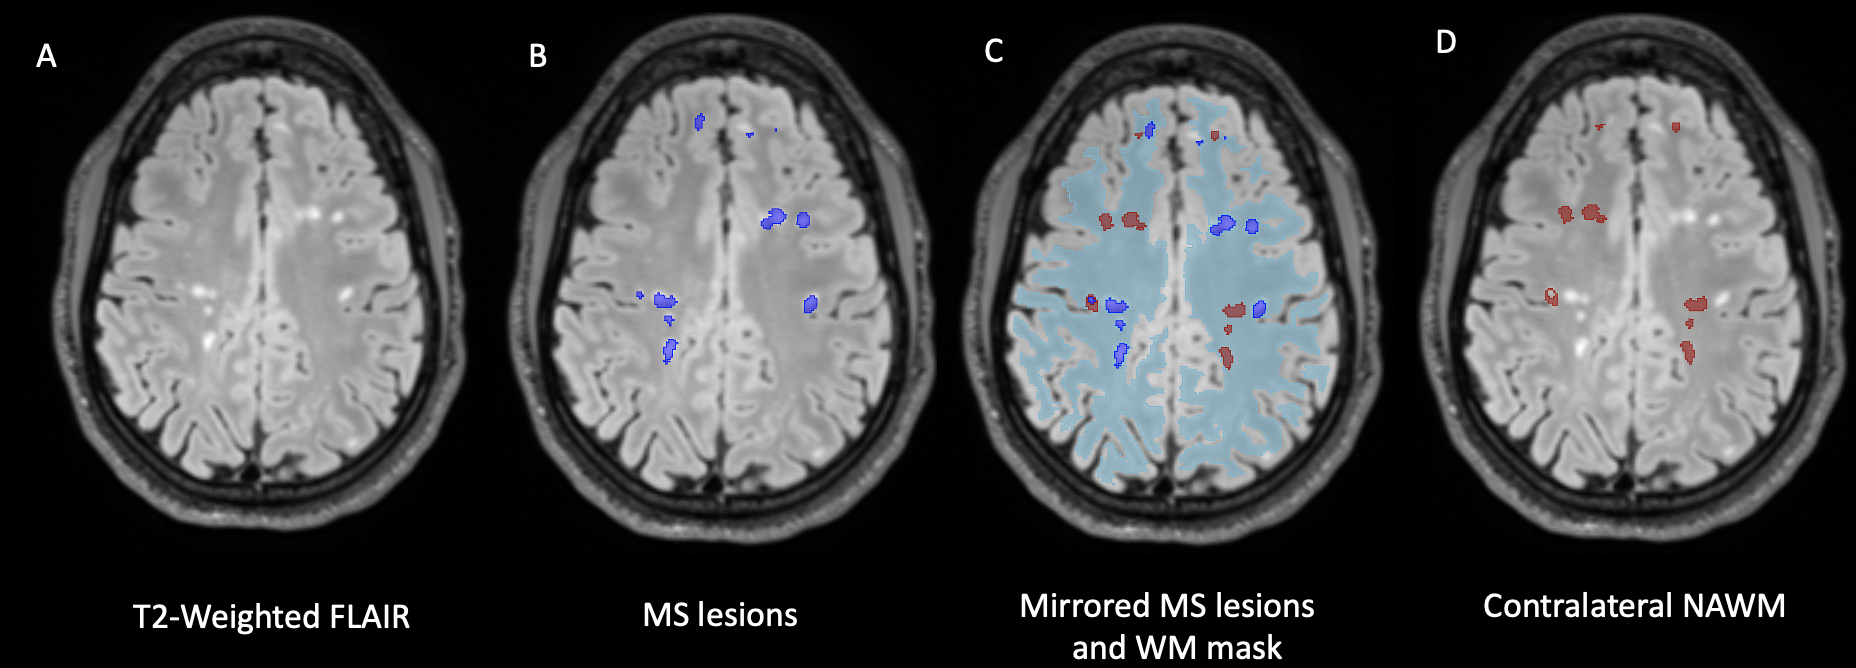
All T2 hyperintense WM lesions were segmented in T2-weighted FLAIR and reviewed by a board certified neuroradiologist. Contralateral NAWM was segmented using a linear transform to mirror lesions (Figure 1) and masked to conform to NAWM. A white matter mask (with subtracted lesions for patients) was used to segment whole brain NAWM. We compared the diffusion parameters between WM lesions and NAWM in MS patients, and we performed a separate analysis comparing the NAWM in POMS subjects relative to the NAWM in controls. Comparisons were made using a Mann-Whitney U test.
Results
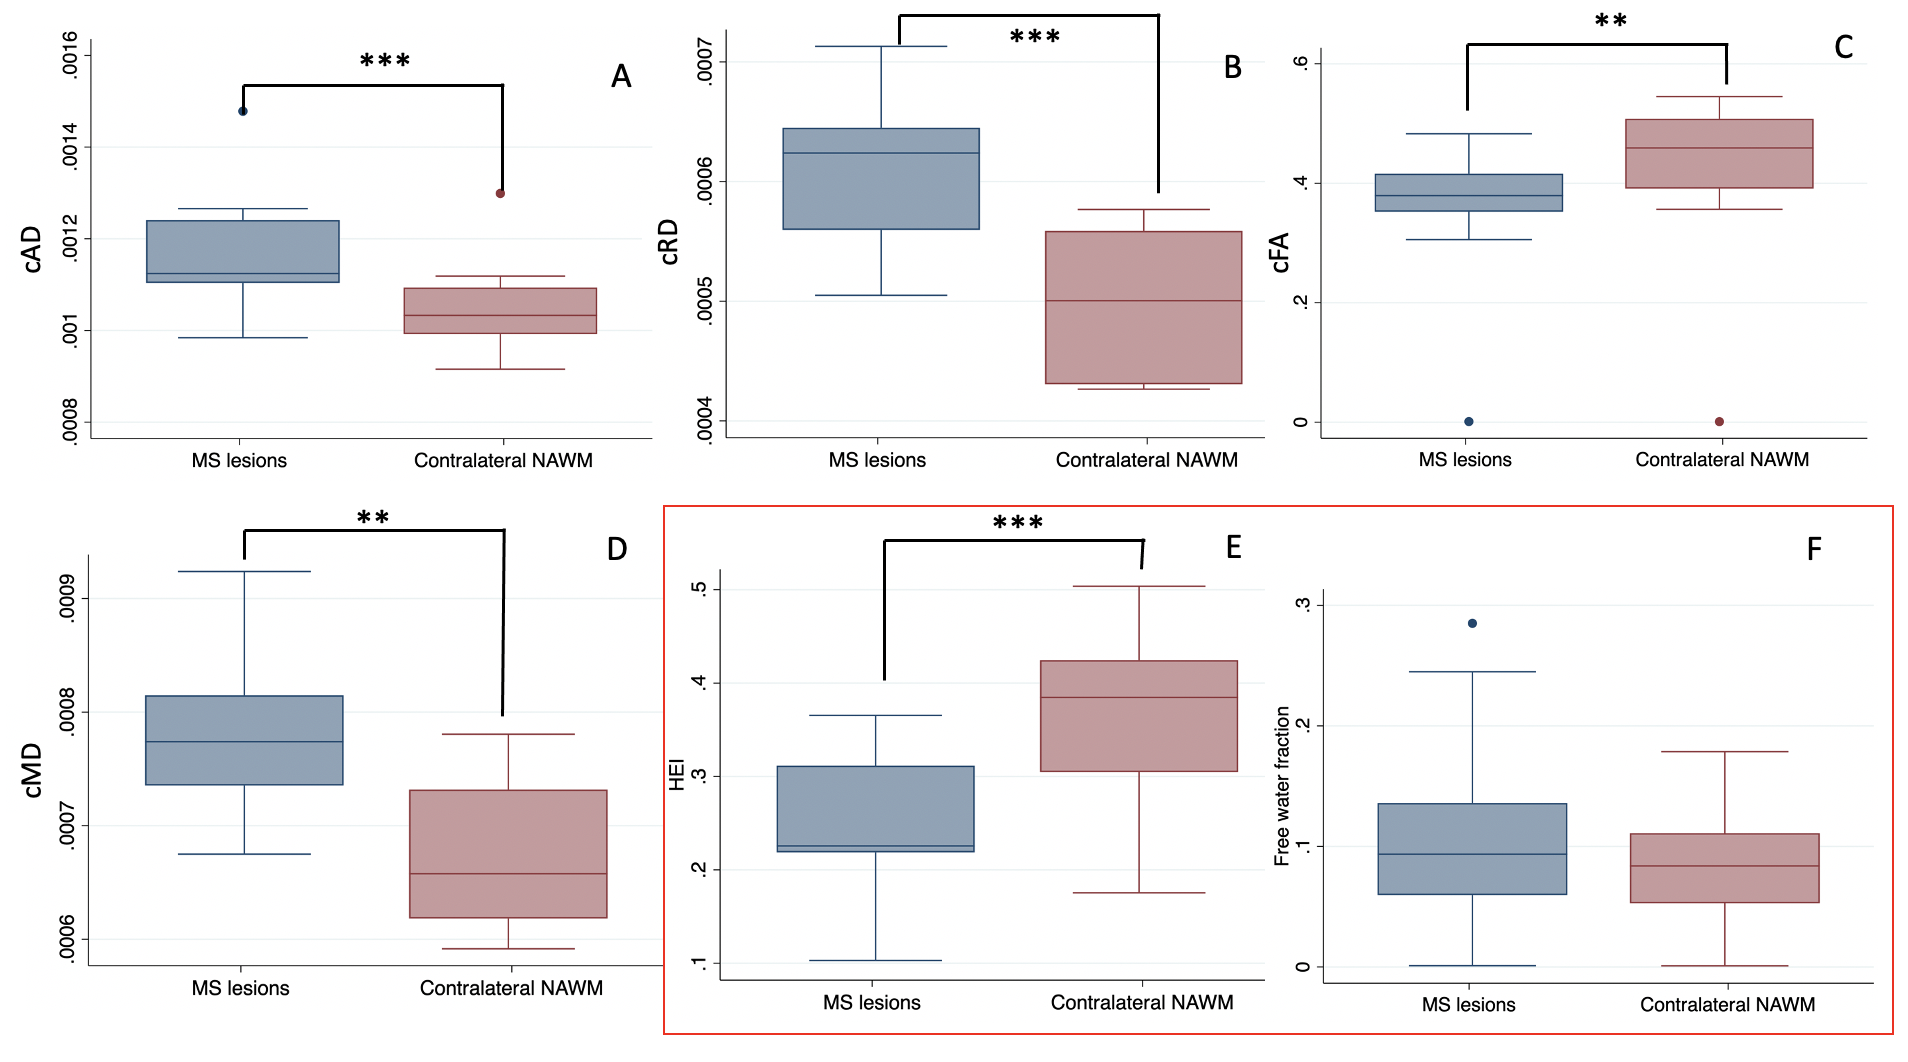
DIAMOND scalar maps with MS lesions and contralateral NAWM segmentations were compared in POMS patients (Figure 2). Lesion cAD, cRD, and cMD was higher than contralateral NAWM (P=0.0010, P=0.0010, and P=0.0020 respectively). Conversely, lesion cFA and HEI was lower than contralateral NAWM (P=0.0020 and P=0.0010, respectively) (Figure 3). Free water fraction was higher in lesions but not significantly different (P=0.0830). An equivalent DTI scalar map analysis showed the same trends between lesions and contralateral NAWM for AD (P=0.0010), RD (P=0.0010), FA (P=0.0010), and MD (P=0.0010).Whole brain NAWM DIAMOND scalar maps were compared between POMS patients and healthy controls (Figure 4). cAD, cRD, and cMD in patients was higher than controls (P=0.0101, P=0.0295, and P=0.0127respectively) (Figure 5). We found no significant difference in cFA (P=0.1734), free water fraction (P=0.4679), and HEI (P=0.1145) between patients and controls. An equivalent DTI scalar map analysis showed the same trends between patients and controls in NAWM AD (P= 0.0101), RD (P=0.0295), MD (P=0.0101), and FA (P=0.1734).
Discussion
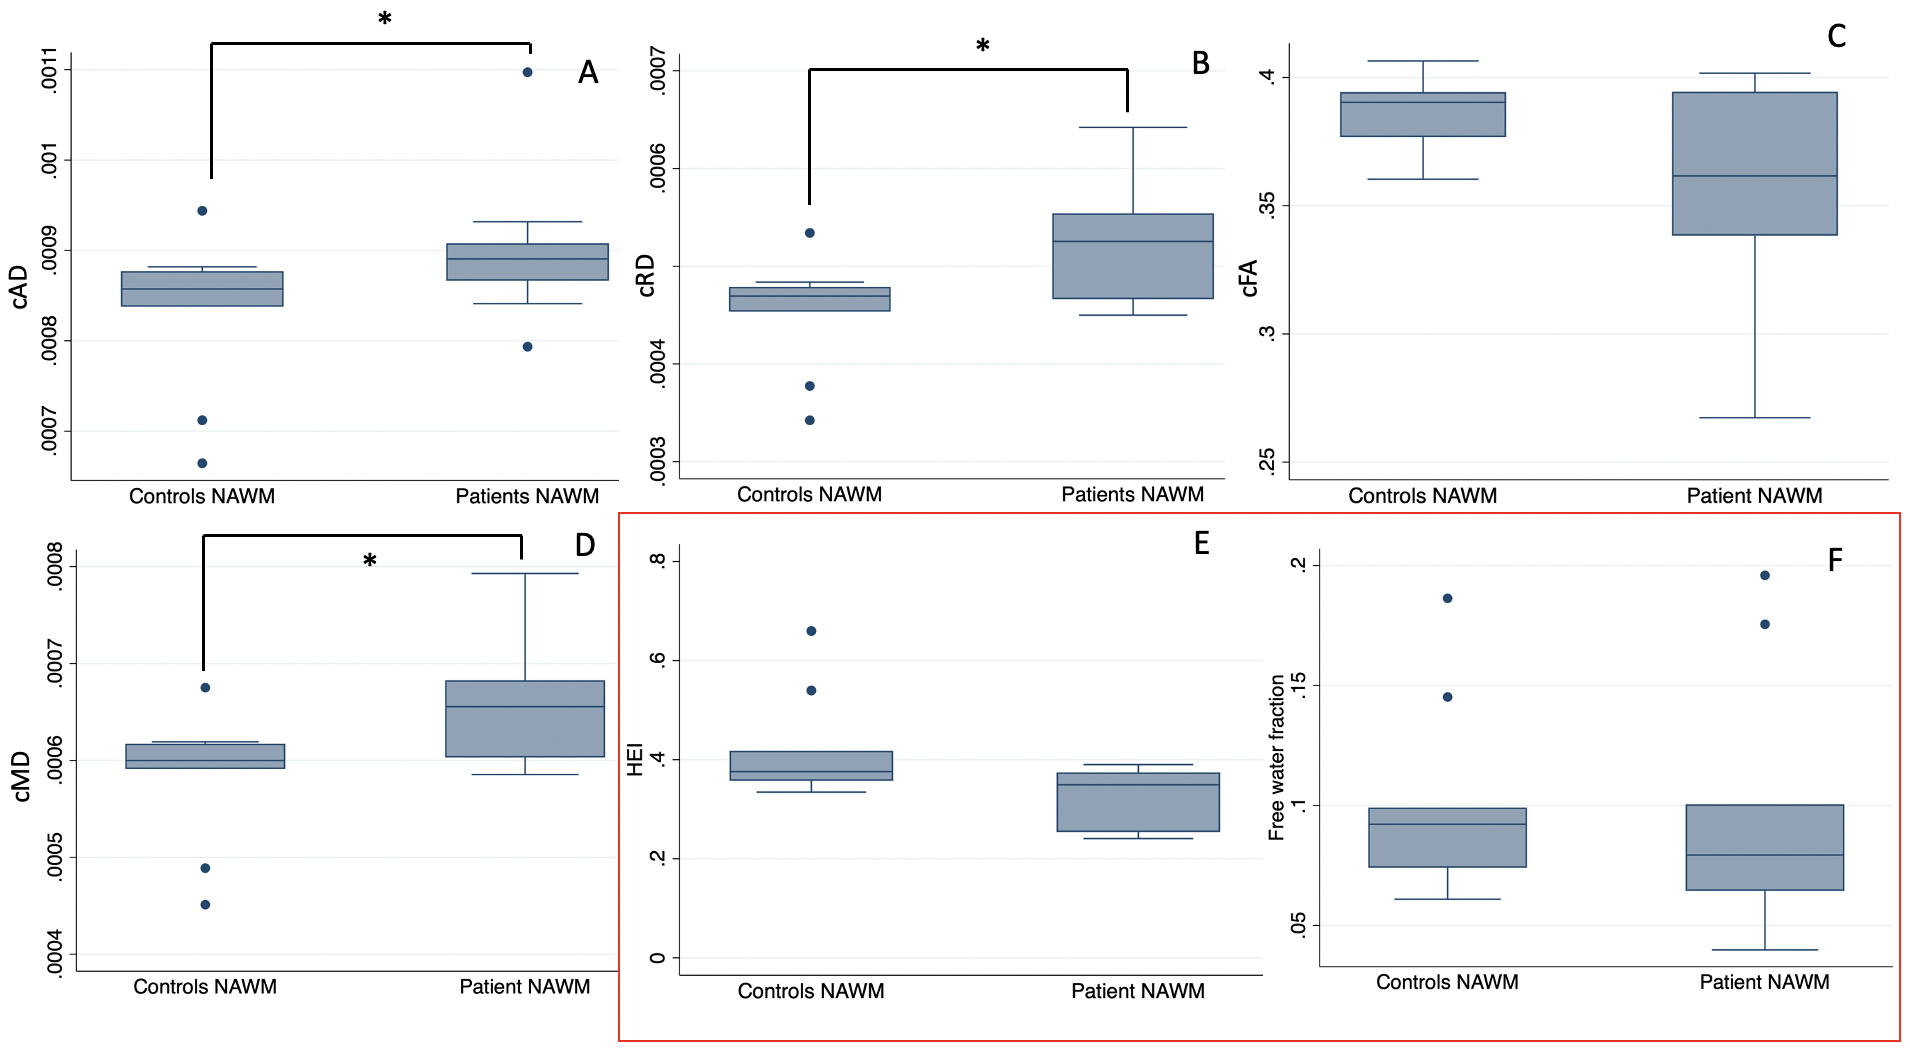
Our analysis shows DWI differences between MS lesions and NAWM in patients, and between NAWM of patients and controls in both DIAMOND and DTI models. We found a higher cAD, cRD, and cMD, and a lower cFA in MS lesions that are in accordance with previously published literature on conventional DTI1. Moreover, we found a 41% reduction in HEI for MS lesions when compared to contralateral NAWM. This finding may reflect the loss of axons and complex interstitial architecture that results from the injury to the myelin sheath and axonal bundles4. Similarly, the increase in free water may be a reflection of the loss of the dense cellular packing and membranes that characterize tightly packed axonal bundles.Additionally, we found a higher cAD, cRD, and cMD of whole brain NAWM of patients when compared to controls in both DIAMOND and DTI models. We did not find a difference in DCI-specific metrics of HEI and free water fraction between the NAWM of POMS subjects and controls, suggesting that alterations in these metrics may be specific markers of areas with more severe axonal injury.
Conclusion
DIAMOND analysis of MS lesions can provide insights to lesion microstructure beyond conventional DTI metrics.Acknowledgements
Research reported in this study was supported in part by a pilot grant from National Multiple Sclerosis Society under Award Number PP-1905-34002.References
1. Kolasa, M. et al. Diffusion tensor imaging and disability progression in multiple sclerosis: A 4-year follow-up study. Brain Behav 9, e01194 (2019).
2. Scherrer, B. et al. Characterizing brain tissue by assessment of the distribution of anisotropic microstructural environments in diffusion-compartment imaging (DIAMOND). Magnetic Resonance in Medicine76, 963–977 (2016).
3. Scherrer, B. & Warfield, S. K. Parametric representation of multiple white matter fascicles from cube and sphere diffusion MRI. PLoS One 7, e48232 (2012).
4. Wang, Y. et al. Differentiation and quantification of inflammation, demyelination and axon injury or loss in multiple sclerosis. Brain 138, 1223–1238 (2015).
Figures
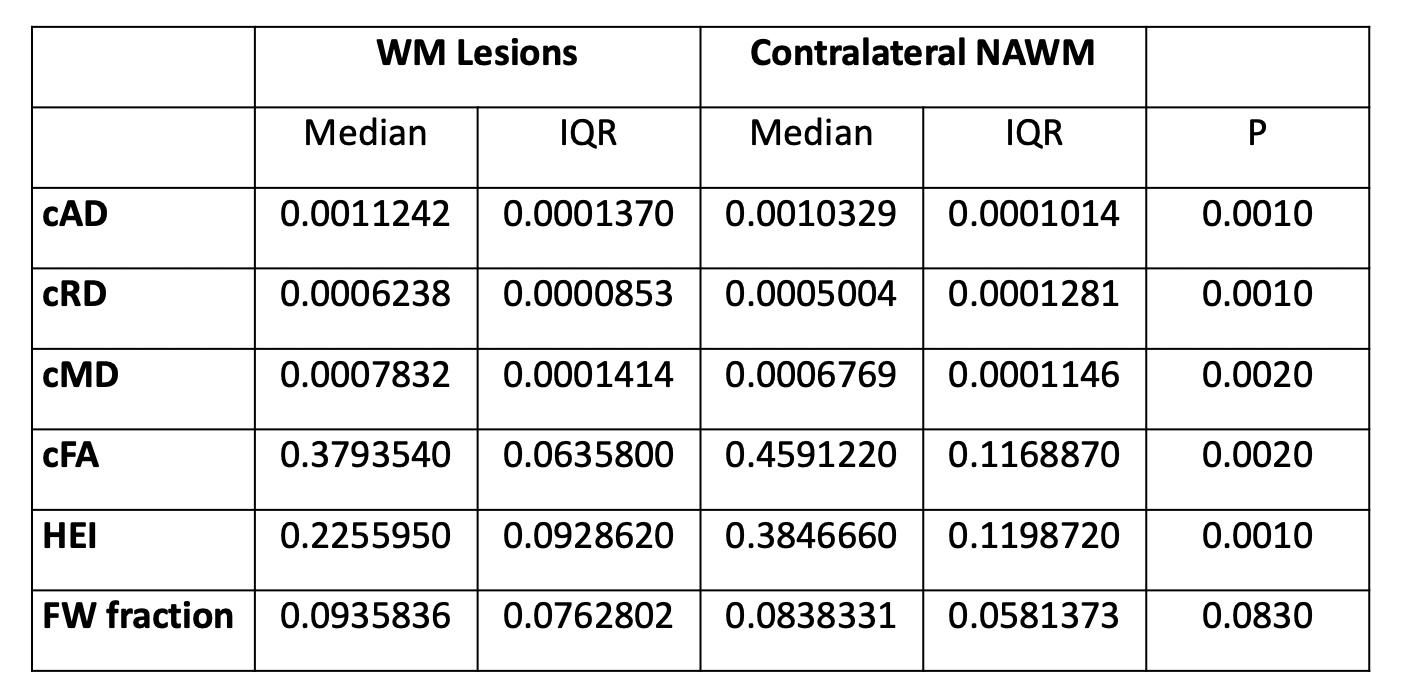
DIAMOND scalar maps of WM lesions and contralateral NAWM in POMS patients. P values of Mann-Whitney U tests are displayed.
cAD compartment axial diffusivity, cRD compartment radial diffusivity, cMD compartment mean diffusivity, cFA compartment fractional anisotropy, HEI heterogeneity index, FW free water, WM white matter, NAWM normal appearing white matter, IQR interquartile range.
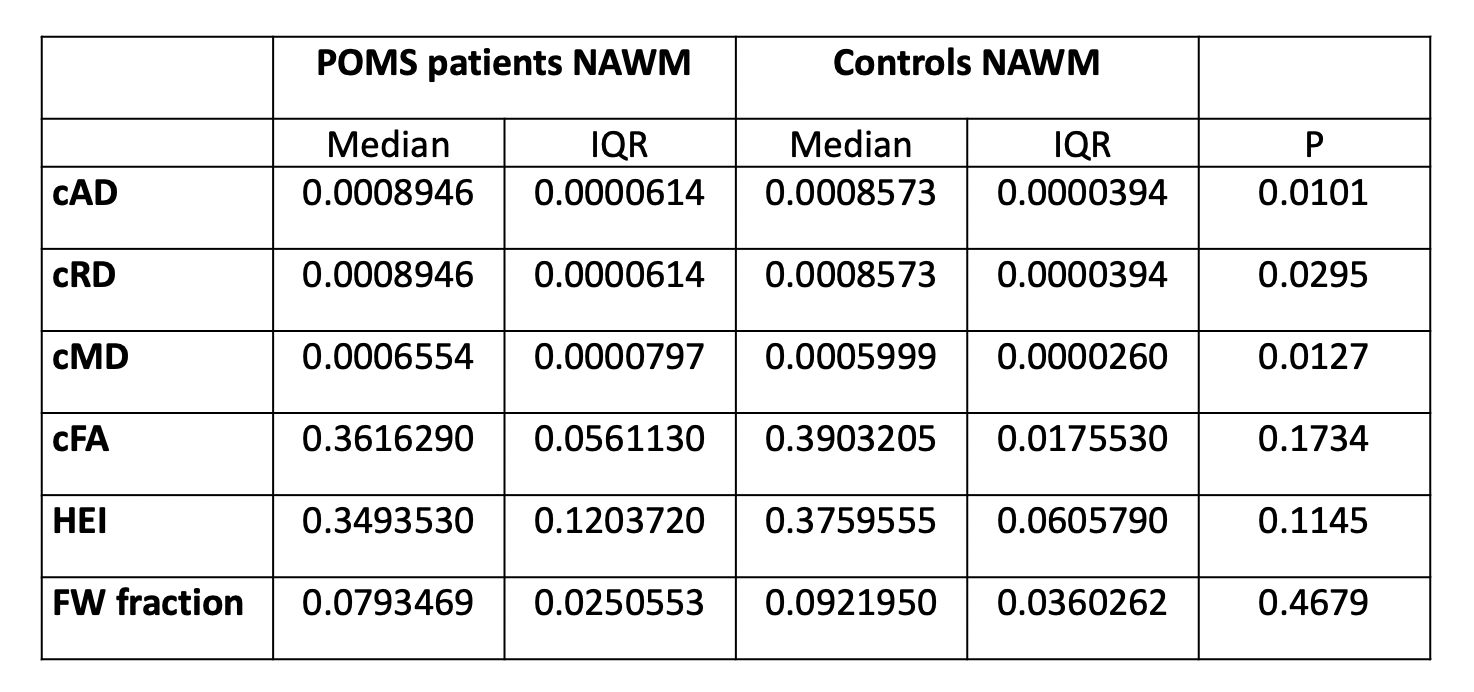
DIAMOND scalar maps of whole brain NAWM in POMS patients and healthy controls. P values of Mann-Whitney U tests are displayed.
cAD compartment axial diffusivity, cRD compartment radial diffusivity, cMD compartment mean diffusivity, cFA compartment fractional anisotropy, HEI heterogeneity index, FW free water, POMS pediatric-onset multiple sclerosis, NAWM normal appearing white matter, IQR interquartile range