2805
Decline of both iron concentration and iron content within the thalamus of patients with multiple sclerosis over two years1Buffalo Neuroimaging Analysis Center, Department of Neurology at the Jacobs School of Medicine and Biomedical Sciences, University at Buffalo, The State University of New York, Buffalo, NY, United States, 2IRCCS, Fondazione Don Carlo Gnocchi ONLUS, Milan, Italy, 3Center for Biomedical Imaging, Clinical and Translational Science Institute, University at Buffalo, The State University of New York, Buffalo, NY, United States, 4Jacobs Multiple Sclerosis Center, Department of Neurology, Jacobs School of Medicine and Biomedical Sciences, University at Buffalo, The State University of New York, Buffalo, NY, United States
Synopsis
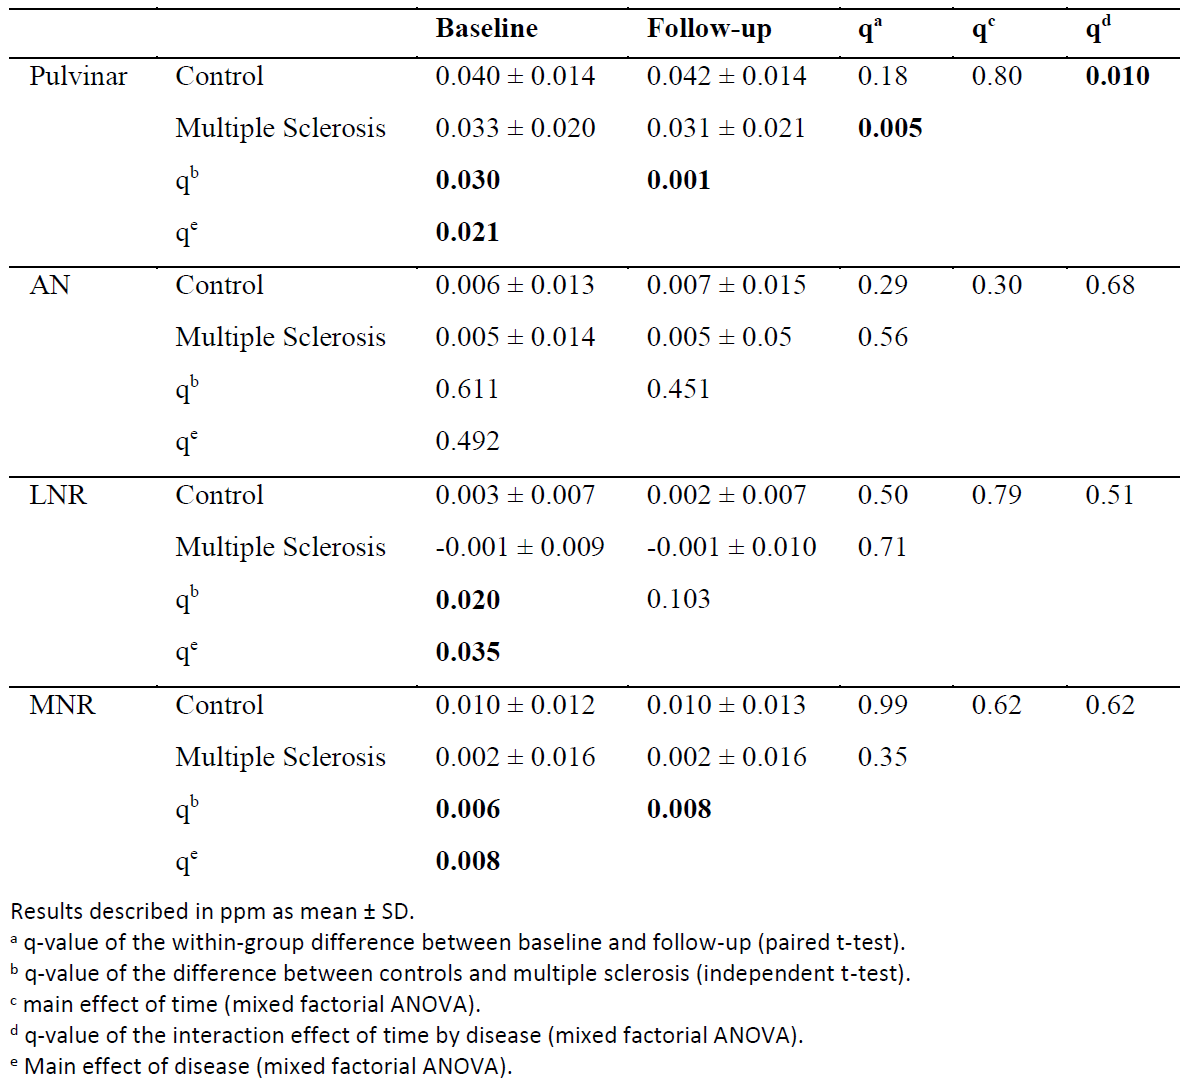
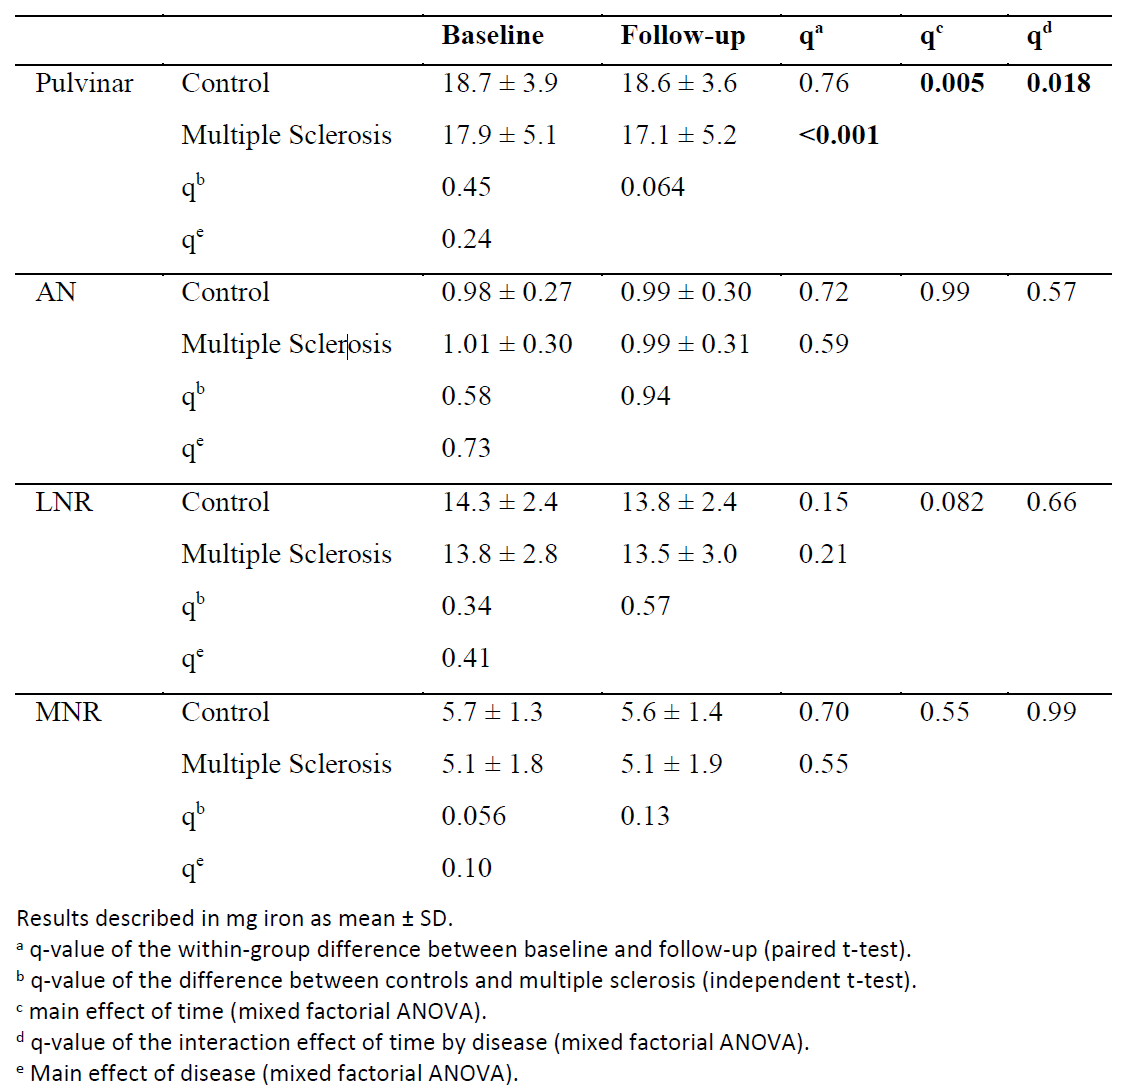
This study investigates the temporal evolution of iron content and concentration in thalamic nuclei of patients with multiple sclerosis over two years. Both metrics declined significantly relative to controls in the pulvinar. Pulvinar iron may potentially serve as an imaging biomarker for oligodendroglial vitality in MS.
Introduction
Plenty of evidence exists for increasing iron concentrations in the deep gray matter (DGM) of patients with multiple sclerosis (MS), mostly obtained with techniques such as quantitative susceptibility mapping (QSM) and R2*. In the white matter, on the contrary, histopathological evidence suggests that patients have lower iron concentrations than controls, related to a loss in oligodendroglial iron.1,2 Two studies from independent labs have recently provided a potential consolidating explanation for this conundrum.3,4 They showed that shrinkage of the iron-free tissue matrix (neuropil in the DGM) could result in increased iron concentrations. Contrary to the widely accepted notion, the authors argued that increased iron concentrations should not be considered evidence of iron dyshomeostasis pathology. Moreover, when the authors measured DGM iron content (in mg) instead of concentration, they found iron loss throughout all DGM regions in patients.In the present study, we applied a similar methodology to investigate over-time variations in iron content within the thalamus, one of the most severely affected brain regions in MS.
Methods
The study was approved by the local Ethical Standards Committee, and written informed consent was obtained from all participants.Subjects: 120 MS patients (RRMS: 98, SPMS: 22) and 40 age- and sex-matched normal controls.
Data acquisition: We performed MRI at baseline and after 2.0±1.1 years using the same 3T scanner (GE Signa Excite HD) with an eight-channel head-and-neck coil. We acquired 3D T1-weighted and 3D single-echo spoiled gradient recalled echo (GRE) data (matrix=512x192x64, 0.5x1x2 mm3, flip angle=12°, TE/TR=22ms/40ms, bandwidth=13.89 kHz).
QSM: We applied best-path unwrapping,5 V-SHARP,6,7 and HEIDI.6
Image analysis: We created a custom bi-modal T1-QSM brain template8 and manually defined the following intra-thalamic atlas labels: pulvinar, anterior nucleus (AN), lateral nuclear region (LNR), and medial nuclear region. Labels were propagated to each subject’s baseline susceptibility map. For maximum precision in over-time measurements, we warped all follow-up susceptibility maps to their respective baseline maps (ANTs) using only susceptibility contrast.8 We calculated region-average susceptibility and iron content for all labels, similar as proposed by Schweser et al.4
Statistical analysis: We used mixed factorial ANOVA with an interaction term of time and group. Over-time effects within groups were tested using the paired t-test. Cross-sectional differences between groups at the two time-points were tested using the Student’s t-test.
Results
Patients had significantly lower susceptibility values than controls in all regions (p<0.035; except AN; Table 1). Over two years, both pulvinar susceptibility (p=0.01) and iron content (p=0.018; Table 2) declined significantly relative to controls.Discussion and Conclusion
Susceptibility differences were in-line with previous cross-sectional findings.2 In particular, pulvinar demonstrated the most potent effect size within the thalamus, as reported previously.2 Over-time changes in pulvinar iron content and the absence of similar findings in other thalamic regions suggest that the pulvinar drove previous whole-thalamus findings.9 We expect significantly greater effect sizes when the non-linear trajectories of thalamic iron10 are adequately accounted for in future statistical models. If confirmed, pulvinar iron may serve as an imaging biomarker for oligodendroglial vitality in MS, potentially allowing assessing disease progression.Acknowledgements
The research reported in this publication was funded by the National Center for Advancing Translational Sciences of the National Institutes of Health under Award Number UL1TR001412. The content is solely the responsibility of the authors and does not necessarily represent the official views of the NIH.References
1. Hametner, S. et al. Iron and neurodegeneration in the multiple sclerosis brain. Ann Neurol 74, 848–861 (2013).
2. Schweser, F. et al. Mapping of thalamic magnetic susceptibility in multiple sclerosis indicates decreasing iron with disease duration: A proposed mechanistic relationship between inflammation and oligodendrocyte vitality. NeuroImage 167, 438–452 (2018).
3. Hernández‐Torres, E. et al. Increased mean R2* in the deep gray matter of multiple sclerosis patients: Have we been measuring atrophy? J. Magn. Reson. Imaging 50, 201–208 (2019).
4. Schweser, F. et al. Decreasing Brain Iron in Multiple Sclerosis: The Difference between Concentration and Content in Iron MRI. Hum Brain Mapp (in press).
5. Abdul-Rahman, H. S. et al. Fast and robust three-dimensional best path phase unwrapping algorithm. Appl Opt 46, 6623–35 (2007).
6. Schweser, F., Sommer, K., Deistung, A. & Reichenbach, J. R. Quantitative susceptibility mapping for investigating subtle susceptibility variations in the human brain. NeuroImage 62, 2083–2100 (2012).
7. Wu, B., Li, W., Avram, A. V., Gho, S.-M. & Liu, C. Fast and tissue-optimized mapping of magnetic susceptibility and T2* with multi-echo and multi-shot spirals. NeuroImage 59, 297–305 (2012).
8. Hanspach, J. et al. Methods for the computation of templates from quantitative magnetic susceptibility maps (QSM): Toward improved atlas- and voxel-based analyses (VBA). J Magn Reson Imaging 46, 1474–1484 (2017).
9. Hagemeier, J. et al. Changes of deep gray matter magnetic susceptibility over 2 years in multiple sclerosis and healthy control brain. NeuroImage: Clinical 18, 1007–1016 (2018).
10. Hallgren, B. & Sourander, P. The effect of age on the non-haemin iron in the human brain. J Neurochem 3, 41–51 (1958).
Figures