2802
Assessment of white matter damages in Multiple Sclerosis using normative templates of conventional and inhomogeneous Magnetization Transfer1Aix Marseille Univ, CNRS, CRMBM, Marseille, France, 2APHM, Hôpital Universitaire Timone, CEMEREM, Marseille, France, 3APHM, Hôpital Universitaire Timone, Service de neurologie, Marseille, France, 4Division of MR Research, Radiology, Beth Israel Deaconess Medical Center, Harvard Medical School, Boston, MA, United States
Synopsis
Characterization of Multiple Sclerosis (MS) is of paramount importance for patient care. In this work, we compare inhomogeneous (ihMT) and conventional magnetization transfer (MT) MRI techniques for white matter (WM) evaluation in a group comparison analysis after normalization in a standard space (templates of MS patients and healthy controls). Regions of interest, voxel-based morphometry and histogram analyses revealed that signal changes in pathological WM are not equivalent for ihMT and MT, highlighting that both metrics provide complementary information.
Introduction
The evaluation of myelinated tissues is crucial for the characterization of myelin disorders like Multiple Sclerosis (MS). Advanced imaging methods such as inhomogeneous Magnetization Transfer (ihMT) has shown a great specificity to myelination in mice brains1, and a sensitivity to the MS pathology in the adult brain2. The conventional MT sequence is often employed in MS studies3, and the method is known to be sensitive to demyelination as well as inflammation and edema4-6.White matter (WM) damages in MS patients are focal (lesions characterized by abnormal T2-weighed (T2w) and T1-weighted (T1w) signal3), but also diffuse (lowered conventional MT signal and mild T2-hyperintense regions7-9 in normal-appearing WM; NAWM). In this work, we aim to compare the ihMT ratio (ihMTR) and conventional MT ratio (MTR) for the characterization of the WM in MS patients using normative templates of age-matched healthy controls (HC) population in a standard space.
Methods
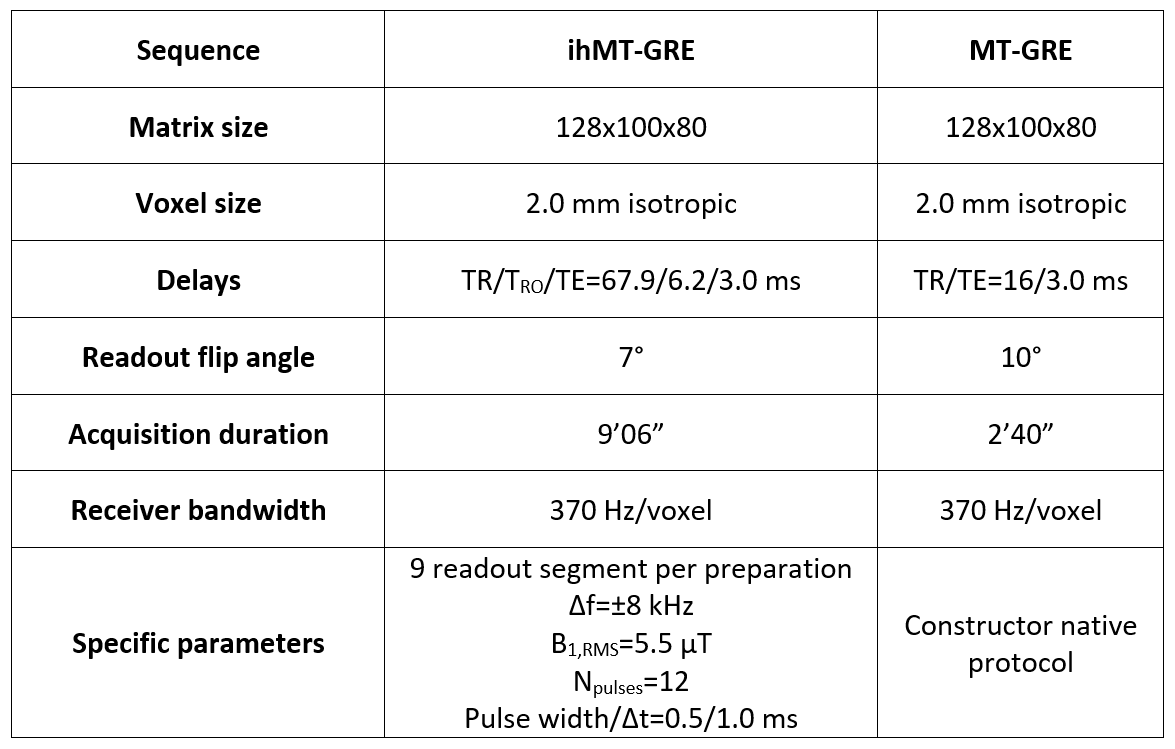
Population and MR protocol: Eleven relapsing-remitting MS patients (age=31.0±10.4 years; 2:9 men:women; EDSS score of 1.07±1.27) and sixteen healthy controls (age=29.4±7.8 years; 10:6 men:women) underwent a 3D MRI protocol on a 1.5T MRI system (Avanto, Siemens Healthineers, Erlangen, Germany) with body coil transmission and a 32-channel receive-only head coil. The protocol included 1-mm isotropic T1w-MPRAGE and T2w-FLAIR, as well as ihMT (sensitivity-enhanced gradient echo sequence10) and MT protocols as described in Table 1.Post-processing and template creation: IhMTR was motion-corrected11 and computed using available pipelines (https://github.com/lsoustelle/ihmt_proc). For each subject, FLAIR, ihMTR and MTR images were rigidly co-registered onto their respective anatomic T1w-MPRAGE volume using the Advanced Normalization Tools (ANTs; v2.3.3)12. Lesions masks were manually segmented by an expert on the re-aligned T2w-FLAIR volumes. A three-stages rigid, affine and non-linear (SyN13) registration was then performed on the MPRAGE from the subject space to the MNI152 template (symmetric, 1-mm isotropic), and transformations were applied to the respective MTR, ihMTR and lesions mask images. MTR and ihMTR volumes were then averaged across all subjects in each group, while discarding the lesions’ contribution (voxelwise) in MS patients.
Analysis: Regions of interest were selected from the JHU tractography atlas14 for evaluation of both ihMTR and MTR in each group in the subject space (discarding lesions). A Voxel-Based Morphometry (VBM) analysis was performed for MTR and ihMTR between control and patients groups using the FMRIB Software Library (FSL v6.0.3, randomise routine) with the threshold-free cluster enhancement (TFCE) option15 and family-wise error (FWE) p-value correction (10000 permutations). Voxels were considered to be significantly different between groups when their value on the p-value maps was below 0.0516. The overlapping factor of thresholded p-value maps (p<0.05) between MTR and ihMTR were quantified with the Dice similarity coefficient (DSC)17. Finally, k-density smoothed bivariate histograms of WM, NAWM and lesions contributions were generated from images in the MNI space.
Results
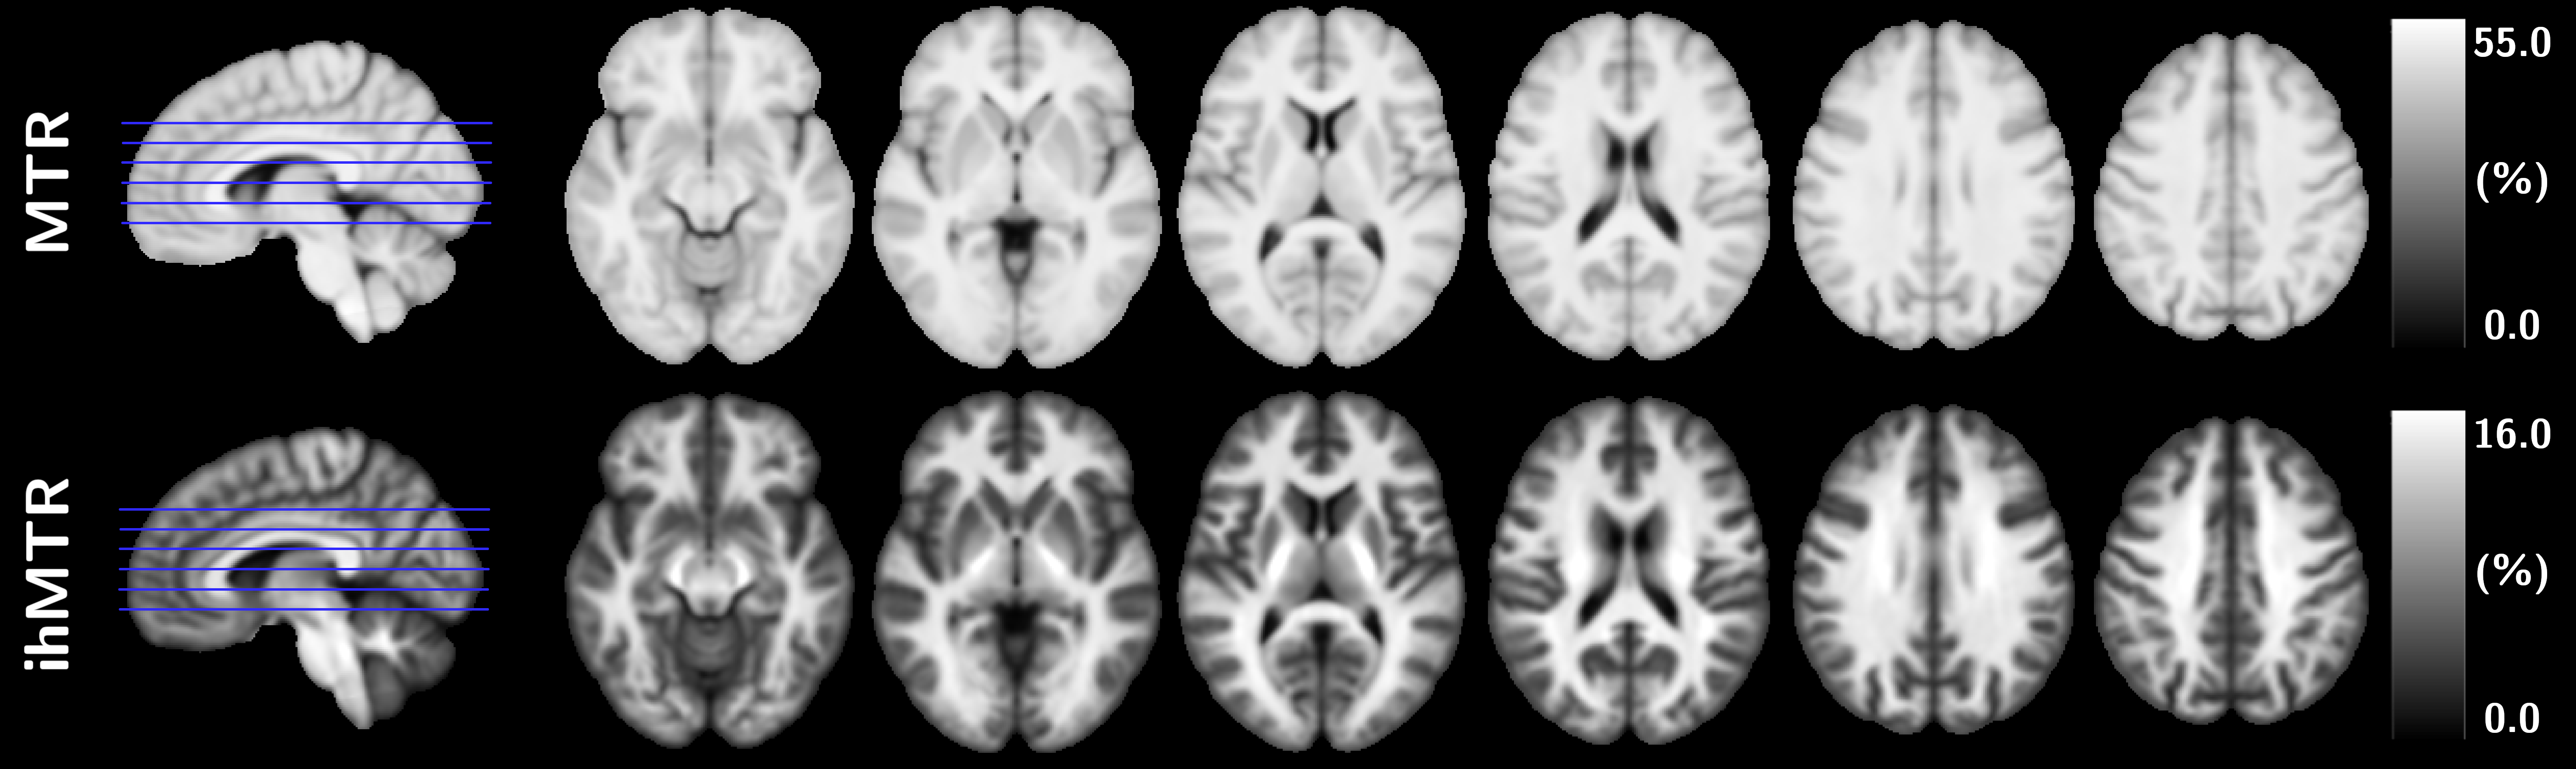
Representative axial views of ihMTR and MTR templates of the control group are provided in Figure 1.Barplots of ihMTR and MTR evaluated in the selected JHU regions in NAWM are shown in Figure 2. The higher contrast of ihMTR compared to that of MTR resulted in a higher variance (F-test, p<0.001) for healthy controls. Mean ihMTR and MTR values of MS patients deviated from the healthy controls (significant unpaired t-test in posterior corona radiata and splenium of the corpus callosum; p<0.01), indicating actual NAWM changes.
Figure 3 shows the MNI template overlaid with (1-p)-value maps of ihMTR and MTR from the VBM analysis. The modest overlapping of MTR and ihMTR clusters (DSC=0.67) indicates spatial WM changes from different nature.
Figure 4a presents a 2D histogram of ihMTR and MTR with distinct clusters of normal WM (healthy controls) and intensity-lowered NAWM (MS patients) with a median difference of 0.8% for ihMTR and 1.2% for MTR, respectively. Histograms of MS lesions present wide ihMTR values with interquartile range of 3.5% (median=10.9%), whereas MTR presents an interquartile range of 6.4% (median=42.9%). Figure 4b and 4c show 2D histograms combining normal WM (healthy controls) and NAWM (MS patients) data, for both ihMTR and MTR, respectively. A rather global offset of pathological WM compared to the control group (parallel deviation from the line of unity) is observed for ihMTR, while MTR deviates in a more dispersed fashion.
Discussion and conclusion
We compared ihMTR and MTR on a group of MS patients using a normative healthy control group. It was shown that ihMTR and MTR differ in terms of detection (VBM) and quantification of WM damages, which can be explained by the different sensitivity and specificity of both metrics to the underlying physiology. Characterization of the MS pathology is crucial for patients’ care, and ihMTR proves to provide additional and useful information in this scope.Acknowledgements
This work was supported by the SATT Sud-Est (France), the French Association pour la Recherche sur la Sclérose En Plaques (ARSEP), Roche Research Foundation (Switzerland) and French National Research Agency, ANR [ANR‐17‐CE18‐0030].References
1. Duhamel G, Prevost VH, Cayre M, et al. Validating the sensitivity of inhomogeneous magnetization transfer (ihMT) MRI to myelin with fluorescence microscopy. Neuroimage 2019;199:289–303 doi: 10.1016/j.neuroimage.2019.05.061 SMASH.
2. Van Obberghen E, Mchinda S, le Troter A, et al. Evaluation of the Sensitivity of Inhomogeneous Magnetization Transfer (ihMT) MRI for Multiple Sclerosis. Am. J. Neuroradiol. 2018;39:634–641 doi: 10.3174/ajnr.A5563 SMASH.
3. Filippi M, Brück W, Chard D, et al. Association between pathological and MRI findings in multiple sclerosis. Lancet Neurol. 2019;18:198–210 doi: 10.1016/S1474-4422(18)30451-4 SMASH.
4. Schmierer K, Tozer DJ, Scaravilli F, et al. Quantitative magnetization transfer imaging in postmortem multiple sclerosis brain. J. Magn. Reson. Imaging 2007;26:41–51 doi: 10.1002/jmri.20984 SMASH.
5. Stanisz GJ, Webb S, Munro CA, Pun T, Midha R. MR Properties of Excised Neural Tissue Following Experimentally Induced Inflammation. Magn. Reson. Med. 2004;51:473–479 doi: 10.1002/mrm.20008 SMASH.
6. Gareau PJ, Rutt BK, Karlik SJ, Mitchell JR. Magnetization transfer and multicomponent T2 relaxation measurements with histopathologic correlation in an experimental model of MS. J. Magn. Reson. Imaging 2000;11:586–595 doi: 10.1002/1522-2586(200006)11:6<586::AID-JMRI3>3.0.CO;2-V SMASH.
7. Moll NM, Rietsch AM, Thomas S, et al. Multiple sclerosis normal-appearing white matter: Pathology-imaging correlations. Ann. Neurol. 2011;70:764–773 doi: 10.1002/ana.22521 SMASH.
8. Vertinsky AT, Li DKB, Vavasour IM, et al. Diffusely Abnormal White Matter, T 2 Burden of Disease, and Brain Volume in Relapsing-Remitting Multiple Sclerosis. J. Neuroimaging 2019;29:151–159 doi: 10.1111/jon.12574 SMASH.
9. Laule C, Pavlova V, Leung E, et al. Diffusely Abnormal White Matter in Multiple Sclerosis: Further Histologic Studies Provide Evidence for a Primary Lipid Abnormality With Neurodegeneration. J. Neuropathol. Exp. Neurol. 2013;72:42–52 doi: 10.1097/NEN.0b013e31827bced3 SMASH.
10. Mchinda S, Varma G, Prevost VH, et al. Whole brain inhomogeneous magnetization transfer (ihMT) imaging: Sensitivity enhancement within a steady-state gradient echo sequence. Magn. Reson. Med. 2018;79:2607–2619 doi: 10.1002/mrm.26907 SMASH.
11. Soustelle L, Lamy J, Le Troter A, et al. A Motion Correction Strategy for Multi-Contrast based 3D parametric imaging : Application to Inhomogeneous Magnetization Transfer (ihMT). bioRxiv 2020 doi: 10.1101/2020.09.11.292649 SMASH.
12. Avants BB, Tustison N, Song G. Advanced Normalization Tools (ANTS). Insight J. 2 2009:1–35.
13. Avants BB, Tustison NJ, Song G, Cook PA, Klein A, Gee JC. A reproducible evaluation of ANTs similarity metric performance in brain image registration. Neuroimage 2011;54:2033–2044 doi: 10.1016/j.neuroimage.2010.09.025 SMASH.
14. Wakana S, Caprihan A, Panzenboeck MM, et al. Reproducibility of quantitative tractography methods applied to cerebral white matter. Neuroimage 2007;36:630–644 doi: 10.1016/j.neuroimage.2007.02.049 SMASH.
15. Winkler AM, Ridgway GR, Webster MA, Smith SM, Nichols TE. Permutation inference for the general linear model. Neuroimage 2014;92:381–397 doi: 10.1016/j.neuroimage.2014.01.060 SMASH.
16. Finkelmeyer A, He J, Maclachlan L, et al. Grey and white matter differences in Chronic Fatigue Syndrome – A voxel-based morphometry study. NeuroImage Clin. 2018;17:24–30 doi: 10.1016/j.nicl.2017.09.024 SMASH.
17. Dice LR. Measures of the Amount of Ecologic Association Between Species. Ecology 1945;26:297–302 doi: 10.2307/1932409 SMASH.
Figures