2801
Evaluation of PASAT test performance and diffusivity indices in U-fiber regions in healthy subjects and RRMS patients.1Biomedical Imaging Center, Pontificia Universidad Católica de Chile, Santiago, Chile, 2Radiology Department, School of Medicine, Pontificia Universidad Católica de Chile, Santiago, Chile, 3Millennium Nucleus for Cardiovascular Magnetic Resonance, Santiago, Chile, 4School of Medicine, Pontificia Universidad Católica de Chile, Santiago, Chile, 5Interdisciplinary Center of Neurosciences, Pontificia Universidad Católica de Chile, Santiago, Chile, 6Faculty of Engineering, Universidad de Concepción, Concepción, Chile, 7UNATI, Neurospin, CEA, Université Paris-Saclay, Gif-sur-Yvette, France, 8Neurology Department, School of Medicine, Pontificia Universidad Católica de Chile, Santiago, Chile, 9Neurology Service, Hospital Dr. Sótero del Río, Santiago, Chile
Synopsis
Multiple Sclerosis patients develop cognitive impairment at the earliest stages of the disease, with changes in cortical recruitment related to cognitive tasks. We evaluated the relation between information-processing speed performance with different diffusivity measurements in subcortical regions between healthy subjects and RRMS patients. We evaluated the FA, MD, RD, and AD diffusivity maps of U-fibers with PASAT test scores in healthy subjects and RRMS patients. PASAT test scores are significantly linear related to Frontal, Temporal, and Parietal cortical areas in healthy subjects. There is no linear relationship between PASAT test scores and diffusivity maps in RRMS patients.
Introduction
Cognitive impairment affects nearly half of Multiple Sclerosis (MS) patients, with prominent involvement of learning, memory, attention, and information-processing speed, at early stages of the disease (1). Since information-processing speed is one of the most frequent deficits in these patients, the Paced Auditory Serial Addition Test (PASAT) is used as a cognitive tool with high sensitivity to evaluate attention and information processing speed performance (2). On the other hand, Magnetic Resonance Imaging (MRI) is very sensitive for showing cerebral lesions in MS (3). Several studies have suggested the involvement of subcortical U-fiber regions are the predilection sites for MS (4-6). U-fibers are thought to mediate important high-order cognitive functions (7). Nonetheless, conventional MRI sequences cannot detect the impairment of specific functional domains (8). Anatomical and neuroimaging techniques, such as diffusion tensor imaging (DTI) provides different indices to evaluate the axonal injury, demyelination in MS, such as Fractional Anisotropy, Mean, Axial and Radial Diffusivity (FA,MD,AD, and RD, respectively) (9). In this work, we evaluated the relation between the DTI indices from U-fiber regions and the PASAT test score.Materials and Methods
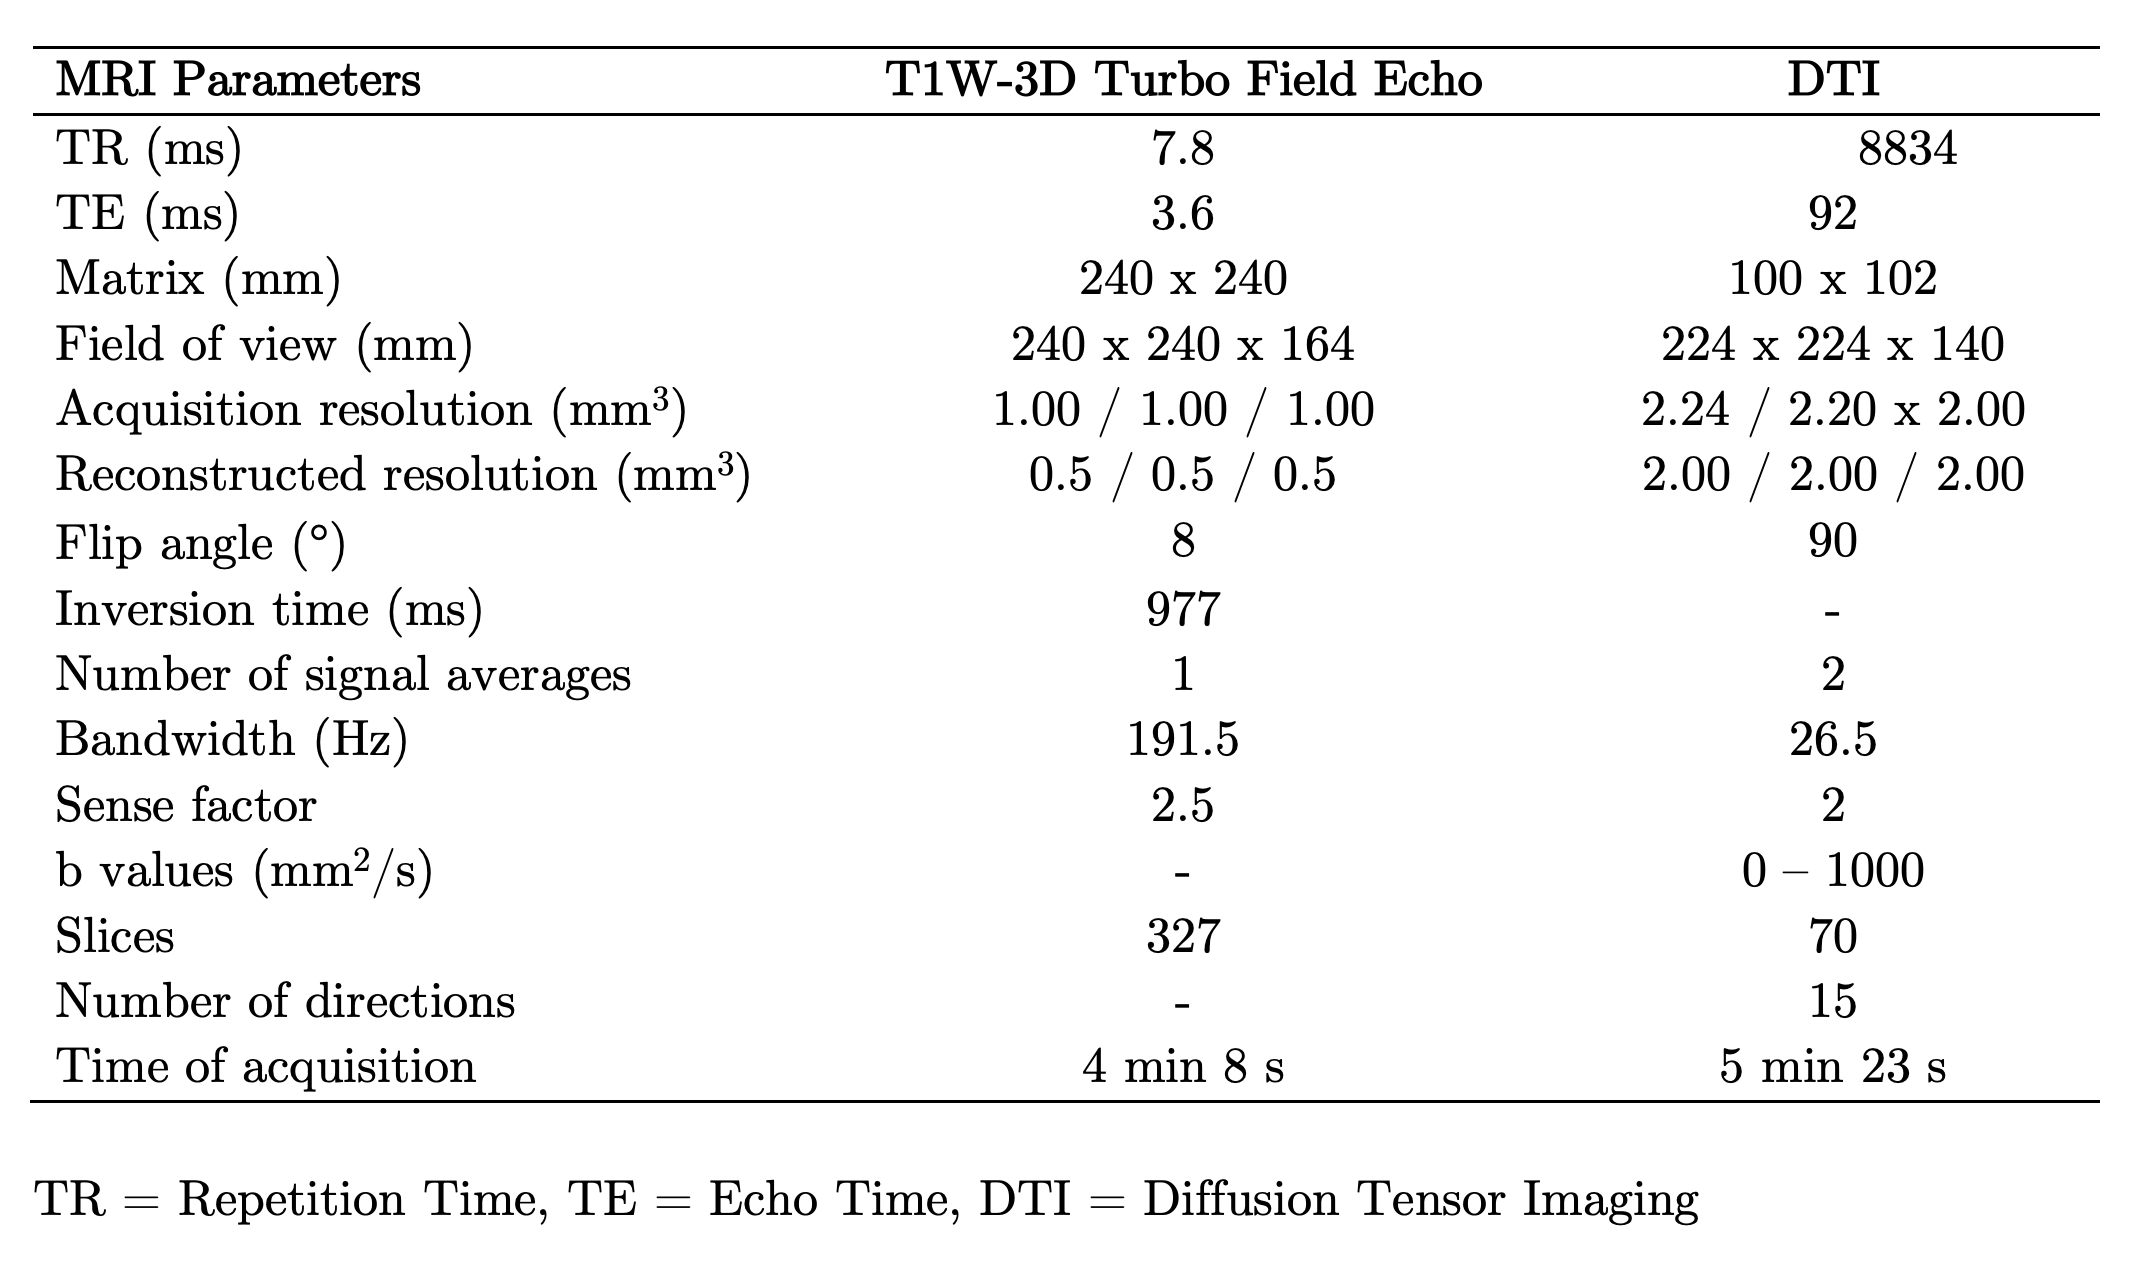
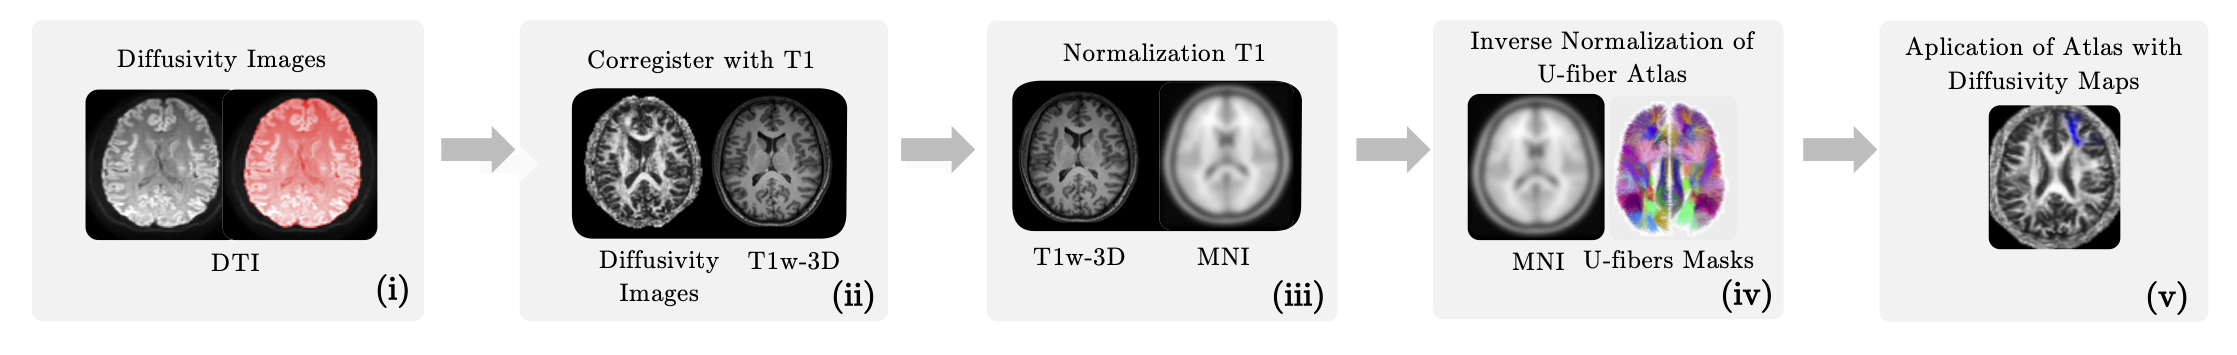
The study was approved by the local ethics committee. 46 Healthy subjects (21 males with mean age 38 years, range 24–60 years old; 25 females with mean age 38 years, range 23–63 years old) and 46 RRMS patients (21 males with mean age 35 years, range 21 – 50 years old; 25 females with mean age 38 years, range 22–63 years old), diagnosed according to McDonald’s criteria (3), were scanned on a 3T MRI scanner (Philips Ingenia, Best, Netherlands). Diffusion-weighted images were acquired to obtain FA, AD, MD, and RD maps by using DTI. T1-weighted images were used as an anatomical reference. MRI acquisition parameters are summarized in Table 1. All subjects had at least 13 years of education and underwent the PASAT test. Student-T test was performed to compare the means of cognitive performance between subject groups (p >0.05). FA, AD, MD, and RD maps were calculated throughout DSI Studio. The resulting images were coregistered with T1-weighted images. Since the U-fibers masks from LNAO-SWM79 Atlas are in MNI space (10), we performed an inverse normalization, in order to bring them to a subject-specific space. Then, each U-fiber mask was applied to each subject’s images to obtain the mean FA,AD,MD, and RD map to each subject’s U-fiber. All preprocessing steps were performed in SPM12. Then, Sequential Selection Forward (SFS) algorithm was performed to select the 25 number of U-fiber maps, among 400 features, because Fisher’s test demonstrated the lowest separability, in comparison to other measurements. 10-folds cross-validation strategy (90% training, 10% testing; with a 95% confidence interval) was applied to confirm model generalization and overfit prevention. Linear Discriminant Analysis (LDA) was used as a classifier. Then, we performed the accuracy as the mean and standard deviation of each experiment with cross-validation. Finally, we performed backward-elimination multiple regressions using SPSS26 to identify the independent predictors of PASAT scores with the DTI indices. The regressors were the U-fibers with the mean of DTI indices of the latter.Results
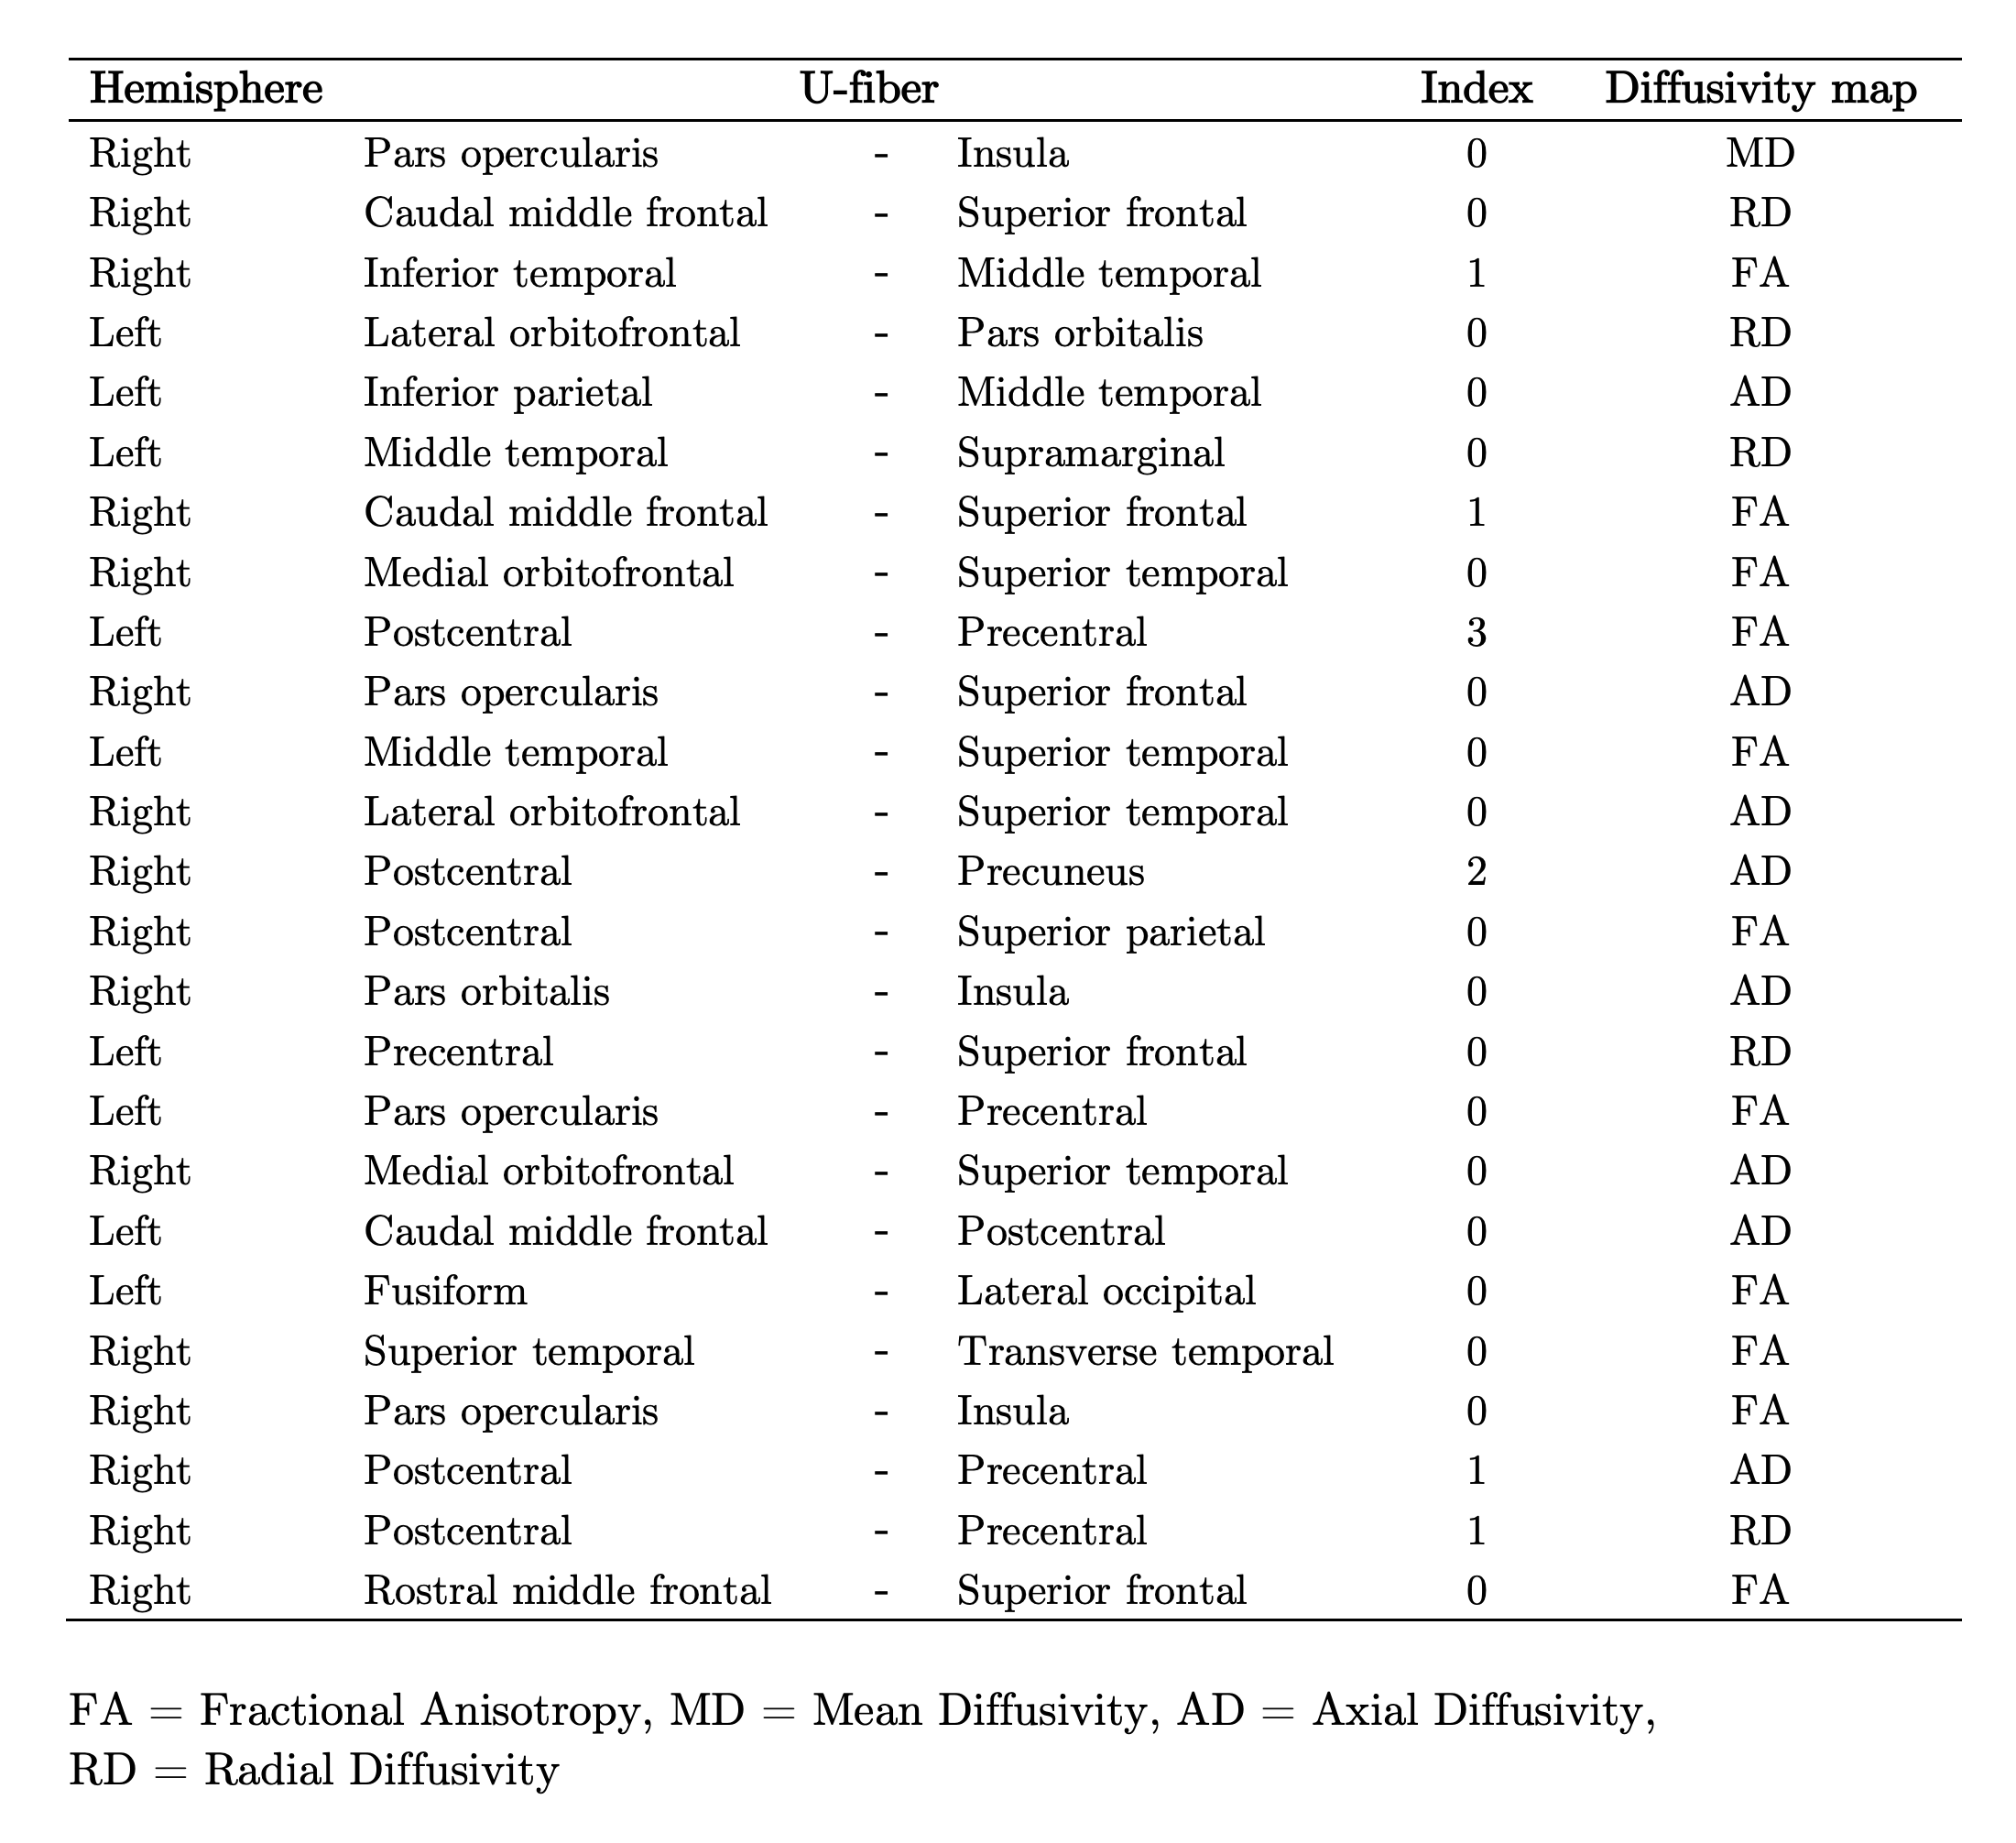
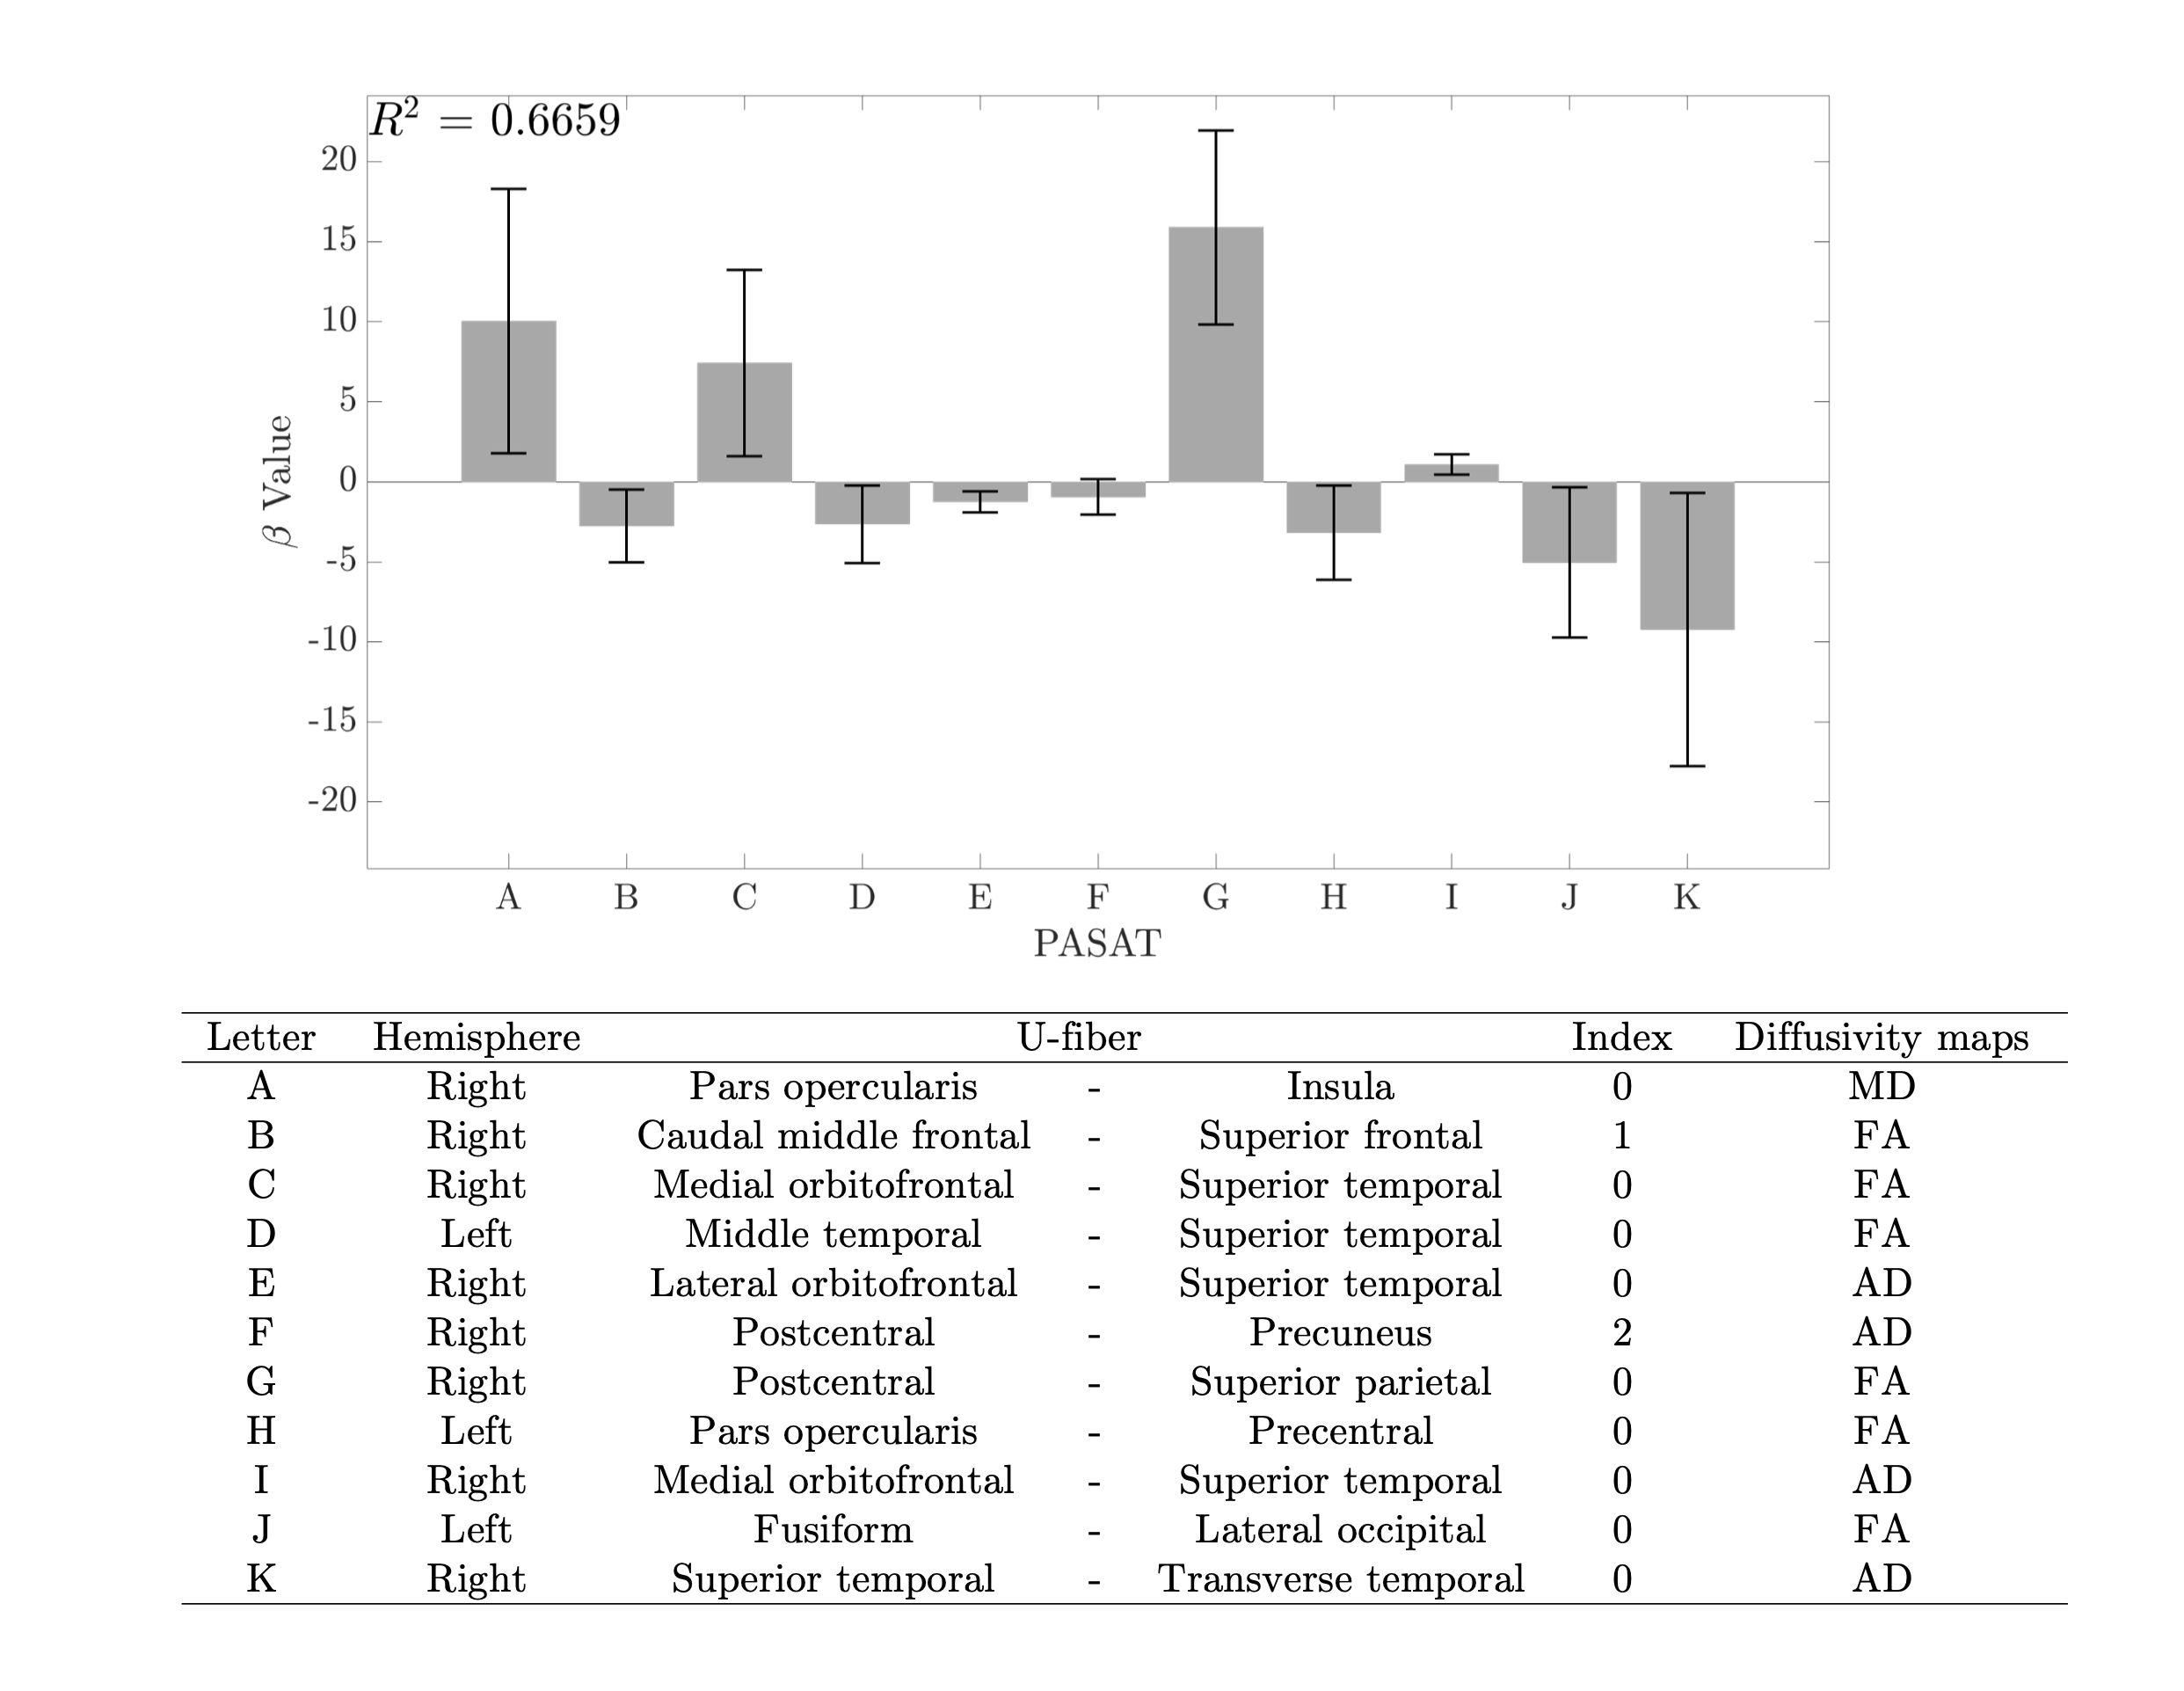
The difference in cognitive performance between healthy subjects (Mean =-1.471; SD =1.024) and RRMS patients (Mean =-6.178; SD =1.383) was significant (t(98) =1.89; p<0.002). U-fibers that connect Frontal, Temporal, and Parietal areas were selected by the SFS feature selection method, as showed in Table 2. LDA classifier performed an accuracy of 88.42 ± 3.20%. U-fibers selected by SFS can accurately classify between healthy subjects and RRMS patients. In healthy subjects, the PASAT test score correlates strongly with FA and AD measures from Frontal and Temporal areas R2 of 0.67 (Figure 2). The U-fiber Right Postcentral and Superior parietal has the highest beta value. Contrary, we did not find any linear relationship between the PASAT test score and diffusivity maps in RRMS patients (R2=0.23).Discussion and Conclusion
Changes in structural diffusivity measures have been reported as a result of demyelination processes in previous studies (9,11-12). The U-fiber areas selected by the SFS method are in accordance with previous studies (5,13). We found statistical significance between PASAT test scores between groups of subjects. PASAT test scores in healthy subjects are better fitted with U-fiber diffusivity measures in Frontal and Temporal gyri. Nonetheless, no relationship was found between PASAT scores in RRMS patients with U-fiber diffusivity measures. This could be explained because of the heterogeneity of PASAT test scores in RRMS patients. Some of them could present different levels of neuroplasticity and lesions located in different areas, which not necessarily are reflected in the results. Right, Pars opercularis-Insula, Postcentral-Superior Parietal, and Superior Temporal-Transverse temporal gyri presents high beta values. These areas could be considered as subcortical regions that might relate to cognitive performance in the PASAT test. Future work should include more series of tests and other MR quantitative measurements, in order to find a relation between cognitive performance and subcortical structural indemnity.Acknowledgements
This work has been funded by projects PIA-ACT192064 and the Millennium Nucleus on Cardiovascular Magnetic Resonance of the Millennium Science Initiative, both of the National Agency for Research and Development, ANID.References
1. DeLuca J, Chelune GJ, Tulsky DS, et al. Is speed of processing or working memory the primary information processing deficit in multiple sclerosis?. J Clin Exp Neuropsychol 2004; 26: 550–562.
2. Audoin B, Au Duong MV, Ranjeva JP, et al. Magnetic resonance study of the influence of tissue damage and cortical reorganization on PASAT performance at the earliest stage of multiple sclerosis. Hum Brain Mapp. 2005 Mar;24(3):216-28.
3. Polman CH, Reingold SC, Banwell B, et al. Diagnostic criteria for multiple sclerosis: 2010 revisions to the McDonald criteria. Ann Neurol. 2011 Feb;69(2):292- 302.
4. Brownell B, Hughes JT. The distribution of plaques in the cerebrum in multiple sclerosis. J Neurol Neurosurg Psychiatry. 1962;25:315–20
5. Miki Y, Grossman RI, Udupa JK, et al. Isolated U-fiber involvement in MS: preliminary observations. Neurology. 1998;50(5): 1301–6.
6. Lazeron RH, Langdon DW, Filippi M, et al. Neuropsychological impairment in multiple sclerosis patients: the role of (juxta) cortical lesion on FLAIR. Mult Scler. 2000;6(4): 280–5.
7. Ouyang M, Kang H, Detre JA, Roberts TPL, Huang H. Short-range connections in the developmental connectome during typical and atypical brain maturation. Neurosci Biobehav Rev. 2017;83:109–22.
8. Kacar K, Rocca MA, Copetti M, Sala S, Mesaros S, Stosic Opincal T, Caputo D, Absinta M, Drulovic J, Kostic VS, Comi G, Filippi M. Overcoming the clinical-MR imaging paradox of multiple sclerosis: MR imaging data assessed with a random forest approach. AJNR Am J Neuroradiol. 2011 Dec;32(11):2098-102.
9. Sbardella E, Tona F, Petsas N, et al. DTI Measurements in Multiple Sclerosis: Evaluation of Brain Damage and Clinical Implications. Mult Scler Int. 2013;2013:671730.
10. Guevara M, Román C, Houenou J, et al. Reproducibility of superficial white matter tracts using diffusion-weighted imaging tractography. Neuroimage. 2017 Feb 15;147:703-725.
11. Winklewski PJ, Sabisz A, Naumczyk P, et al. Understanding the Physiopathology Behind Axial and Radial Diffusivity Changes-What Do We Know?. Front Neurol. 2018 Feb 27;9:92.
12. Rimkus Cde M, Junqueira Tde F, Lyra KP, et al. Corpus callosum microstructural changes correlate with cognitive dysfunction in early stages of relapsing- remitting multiple sclerosis: axial and radial diffusivities approach. Mult Scler Int. 2011;2011:304875.
13. Van Hecke W, Nagels G, Leemans A, et al. Correlation of cognitive dysfunction and diffusion tensor MRI measures in patients with mild and moderate multiple sclerosis..J Magn Reson Imaging. 2010 Jun;31(6):1492-8.
Figures