2798
Structural connectivity is more sensitive to track cognition progression individual level than fMRI and MEG over 2 years in mildly disabled RRMS1Institute of Neuroimmunology and Multiple Sclerosis (INIMS), University Medical Center Eppendorf, Hamburg, Germany, 2Department of Neurophysiology and Pathophysiology, University Medical Center Eppendorf, Hamburg, Germany, 3Department of Neurology, University Medical Center Eppendorf, Hamburg, Germany, 4Institute of Neurophysiology and Pathophysiology, University Medical Center Eppendorf, Hamburg, Germany, 5Department of Psychiatry and Psychotherapy, Charité University Medical Center, Campus Benjamin Franklin, Hindenburgdamm 30, Berlin, Germany, 6CRMBM AMU-CNRS, Aix-Marseille Université, Marseille, France, 7CEMEREM, APHM, CHU Timone, Marseille, France
Synopsis
There is still substantial inconsistency between clinical disabilities and findings on brain networks and lack of longitudinal study in Multiple Sclerosis (MS). We aimed to elucidate how topology alters and how disability progression affects the structural and functional organizations over 2-years using graph theory approach in relapsing-remitting MS (RRMS). RRMS patients have encountered with lack of improvement in PASAT over 2-years. Structural connectivity was more sensitive to show a relationship with a cognitive function over 2-years than the rs-fMRI and MEG functional metrics in RRMS patients. These findings underline the difficulties associated with functional imaging studies in MS.
Introduction
Multiple Sclerosis (MS) is the most common autoimmune disease of the central nervous system and leads to accumulation of disability by inflammation and neurodegeneration.1 Network analysis has been shown as capable of predicting neuropsychological (NP) impairment and physical disability in MS.2–10 However, there is still substantial inconsistency between clinical disabilities and findings on brain networks and lack of longitudinal study for understanding and screening the neurodegeneration and reorganization in MS.11–13 Thus, we aimed to elucidate how topology alters and how disability progression affects the structural and functional organizations over two years using graph theory approach in relapsing-remitting MS (RRMS).Methods
IRB was taken and all participants gave signed informed consent form.Subjects: 37 patients with RRMS [age=42.15±9.52, F/M=22/15] according to McDonald criteria 201014 and 39 age-sex-education matched healthy controls (HC) [age=42.22±8.33, F/M=25/14] were scanned using 3T MRI (Siemens Skyra) equipped with 32 channel head coil at baseline, 1 and 2 years follow up. All subjects had same MRI protocol and NP test battery assessment (included 20 different cognitive and physical ability tests) for each visit over 2 years.
MRI Protocol: All participants received had the same protocol including diffusion tensor imaging (DTI) (single shell, 32 independent direction, b=1000, TR/TE=7200ms/90ms; voxel size 1.9×1.9×2.0mm, FOV=240mm, matrix 128x128, 54 axial sections, no gap), resting state functional MRI (rs-fMRI) and conventional MRI. For the rs-fMRI, T2*-weighted(W) BOLD-sensitized echo planer imaging sequence (TR/TE=2500ms/25ms; TI=900ms; 40 slices, voxel size 2.7×2.7×3.0mm, no gap, matrix=256x256, FOV=250mm, FA=90°) was acquired for 10 min while subjects were asked to keeping eyes open and fixing a point. 3D T1W MPRAGE (TR/TE=2500ms/2.12ms; TI=1100ms; 256 slices, voxel size 0.8×0.8×0.9mm, no gap, matrix=288x288, FOV=240mm) and T2-W (TR/TE=2800ms/90ms; 43 slices, voxel size 0.5×0.5×3.0mm, no gap, matrix=256x256, FOV=240mm) sequences were also obtained.
MEG recordings was obtained inside a magnetically shielded room (Vacuumschmelze GmbH, Hanau, Germany) using a 275‐channel whole‐head MEG system (CTF Systems, Port Coquitlam, BC, Canada). Participant were asked to close their eyes while they are seating inside the shielded room. Then, the recordings were down‐sampled from 1200 Hz to 300 Hz. 10 minutes of recording were divided into segments of 2-seconds duration and corrupted segments were removed using an automatic outlier detection algorithm.
Data Processing and Analysis:
Preprocessing of Data: We performed structural and functional connectivity using graph theoretical approach. Structural and functional connectivity construction was done as described by Has Silemek et al.15 After calculating the total lesion volumes, an automated procedure for the volume and thickness measurement was performed for each subject using Freesurfer.16 Segmentation correction was done manually and white-gray and total brain volume normalized by intracranial brain volume for each subject and then longitudinal stream was used to reduce the confounding effect of morphological variability between the visits of each subject.17 Finally, gray-matter parcellation of 80 regions (total: 160) for each hemisphere was specified based on the Destrieux atlas (2009)18 to perform the structural and functional connectivity analysis.
Individual Structural and Functional Connectivity Analysis: Individual structural networks were formed based on whole brain probabilistic fiber tracking using MRtrix3 (www.mrtrix.org) as described by Besson et al.19 Individual functional networks were built as described by Wirsich et al.20 As graph metrics, we computed nodal strength (i.e.edge weights in each network) as structural connectivity description and also computed nodal degree (i.e.connections per node in each network) for functional connectivity indices for fMRI and MEG. For MEG, we used eLoreta as the inverse method and the Multivariate Interaction Measure (MIM) as the coupling measure. The analyses were performed with statistics in R 3.2.3, including the igraph21 and tnet22 packages. Hub disruption was calculated based on the continuum of network hierarchy.23 Group (RRMS and HC) level statistical analysis of hub disruption were performed using linear mixed effects regression (LMER).24 Linear effects of time were tested using session, and a group x time interaction was included. The false discovery rate adjustment (FDR) was applied.
Longitudinal change in NP tests between patients and HC was extracted using LME fitting and ANOVA as well.
Results
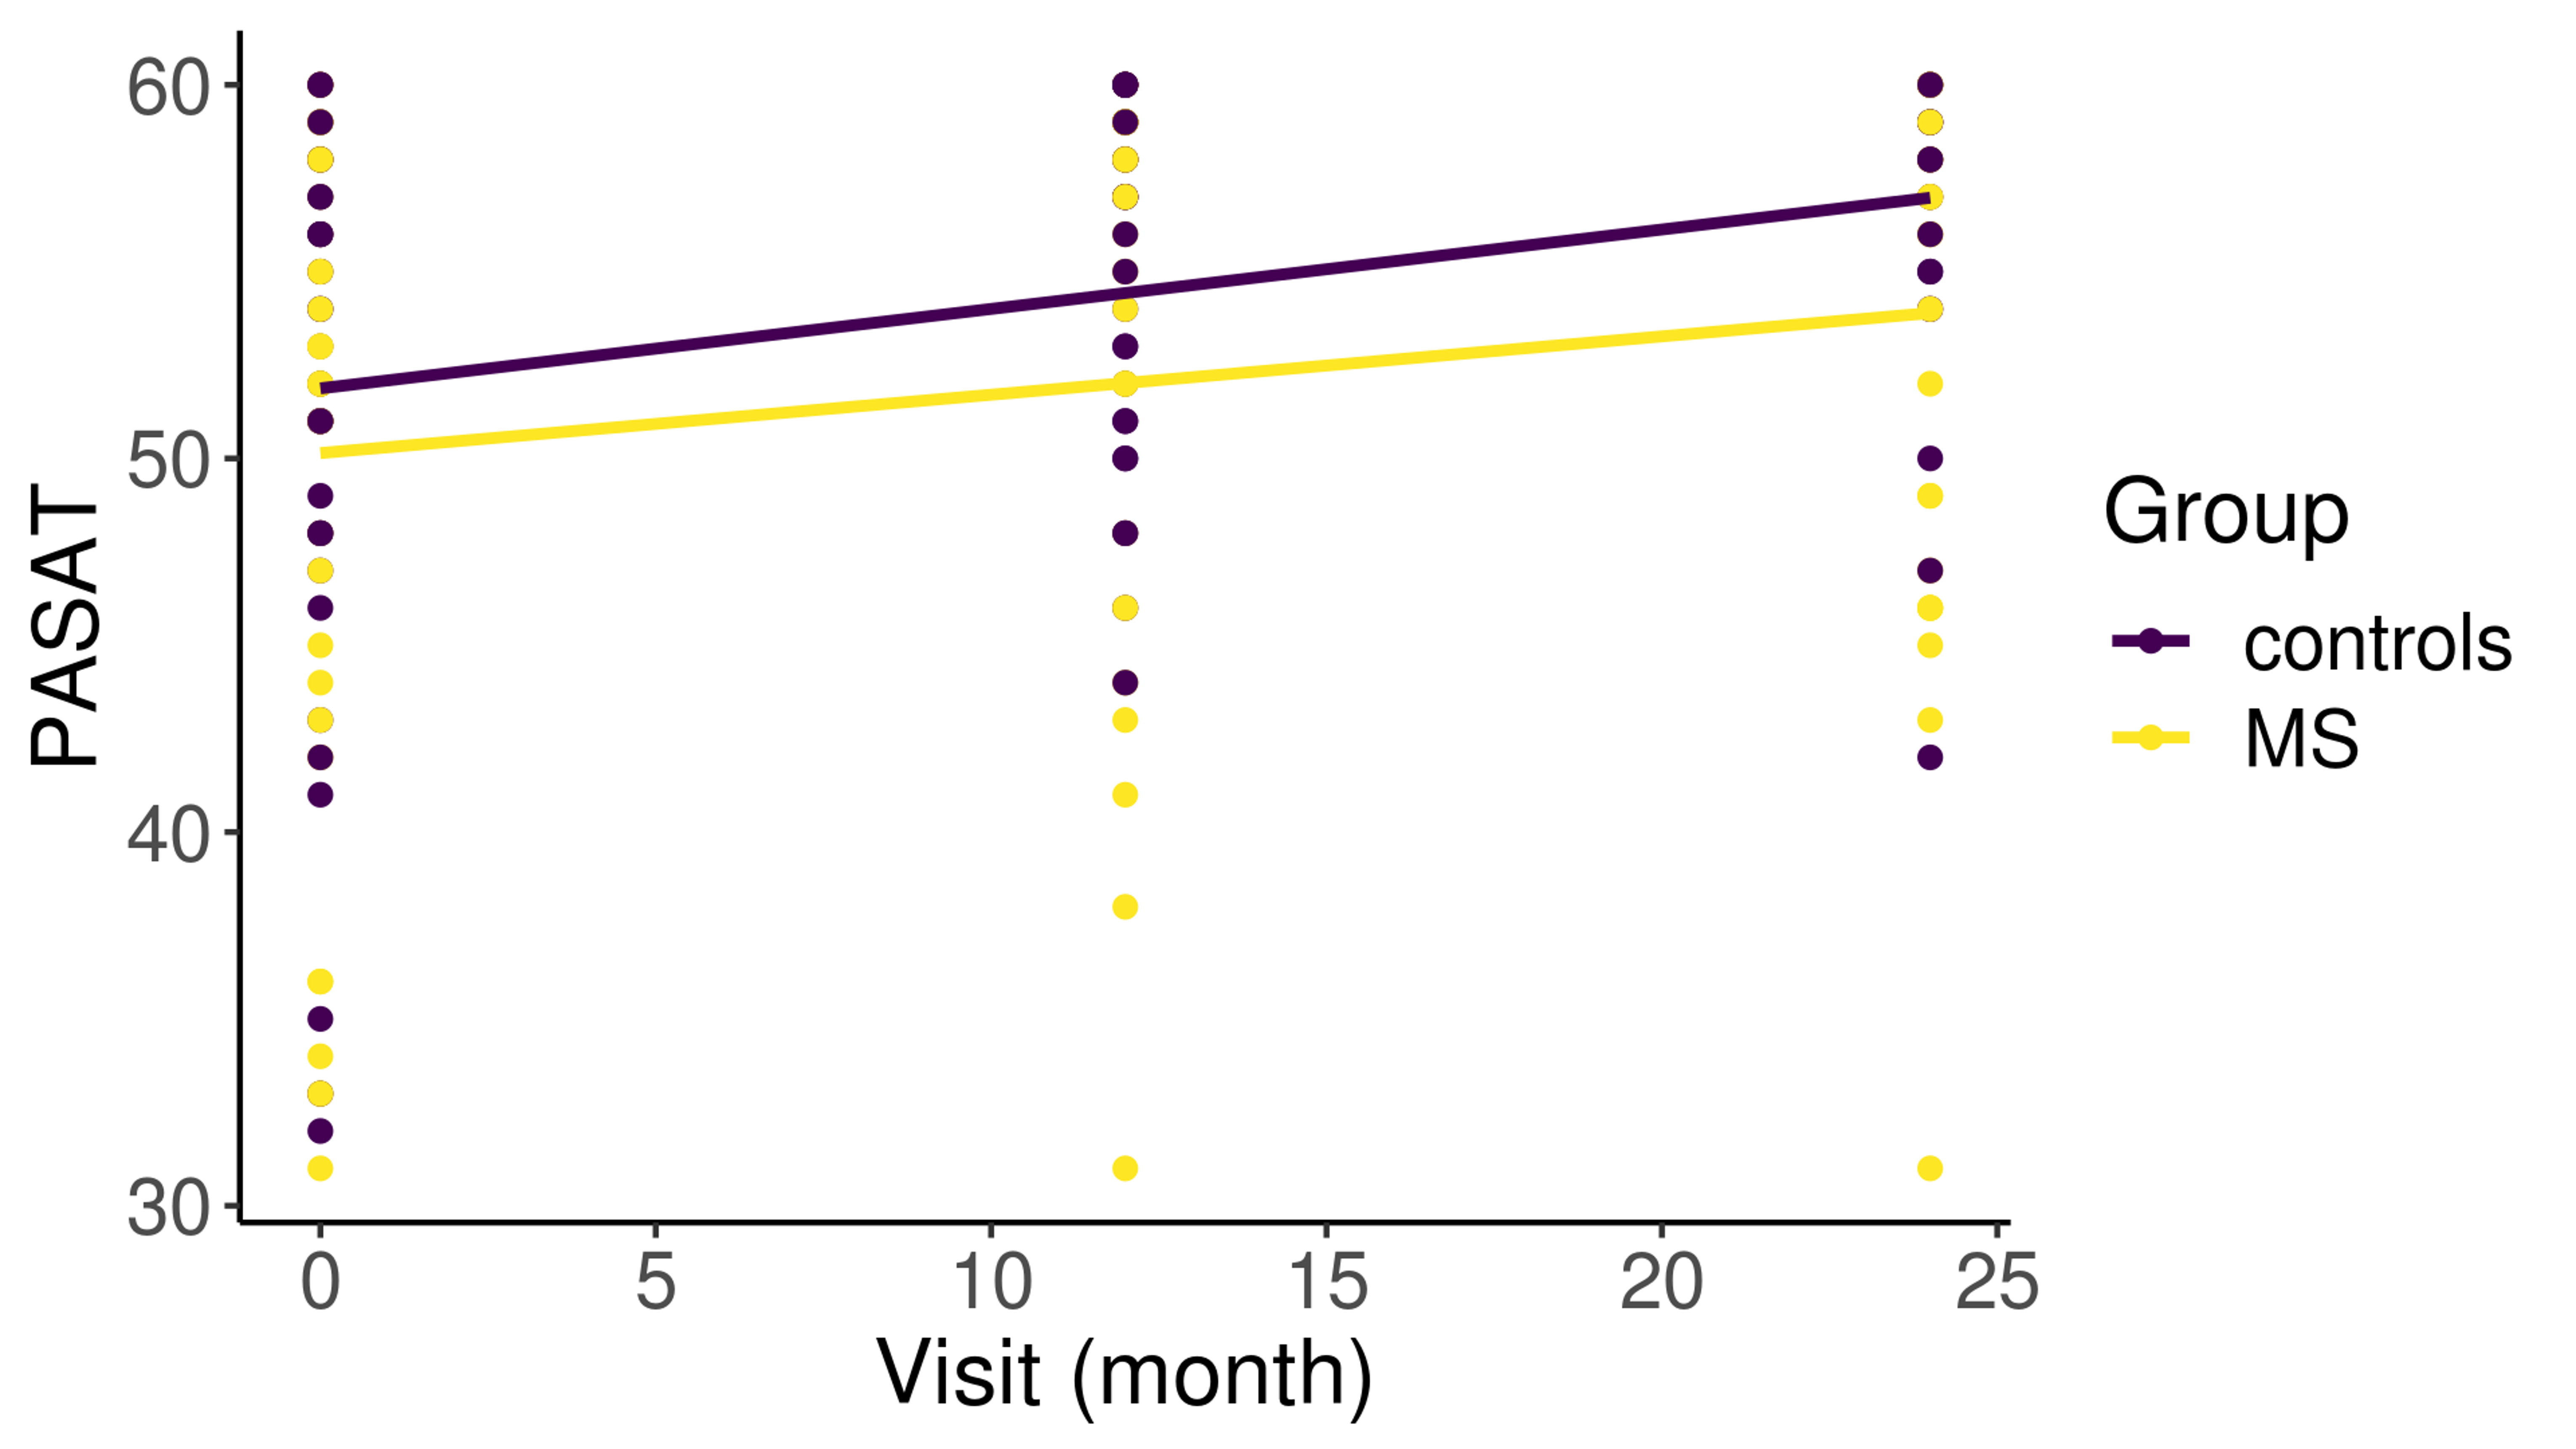
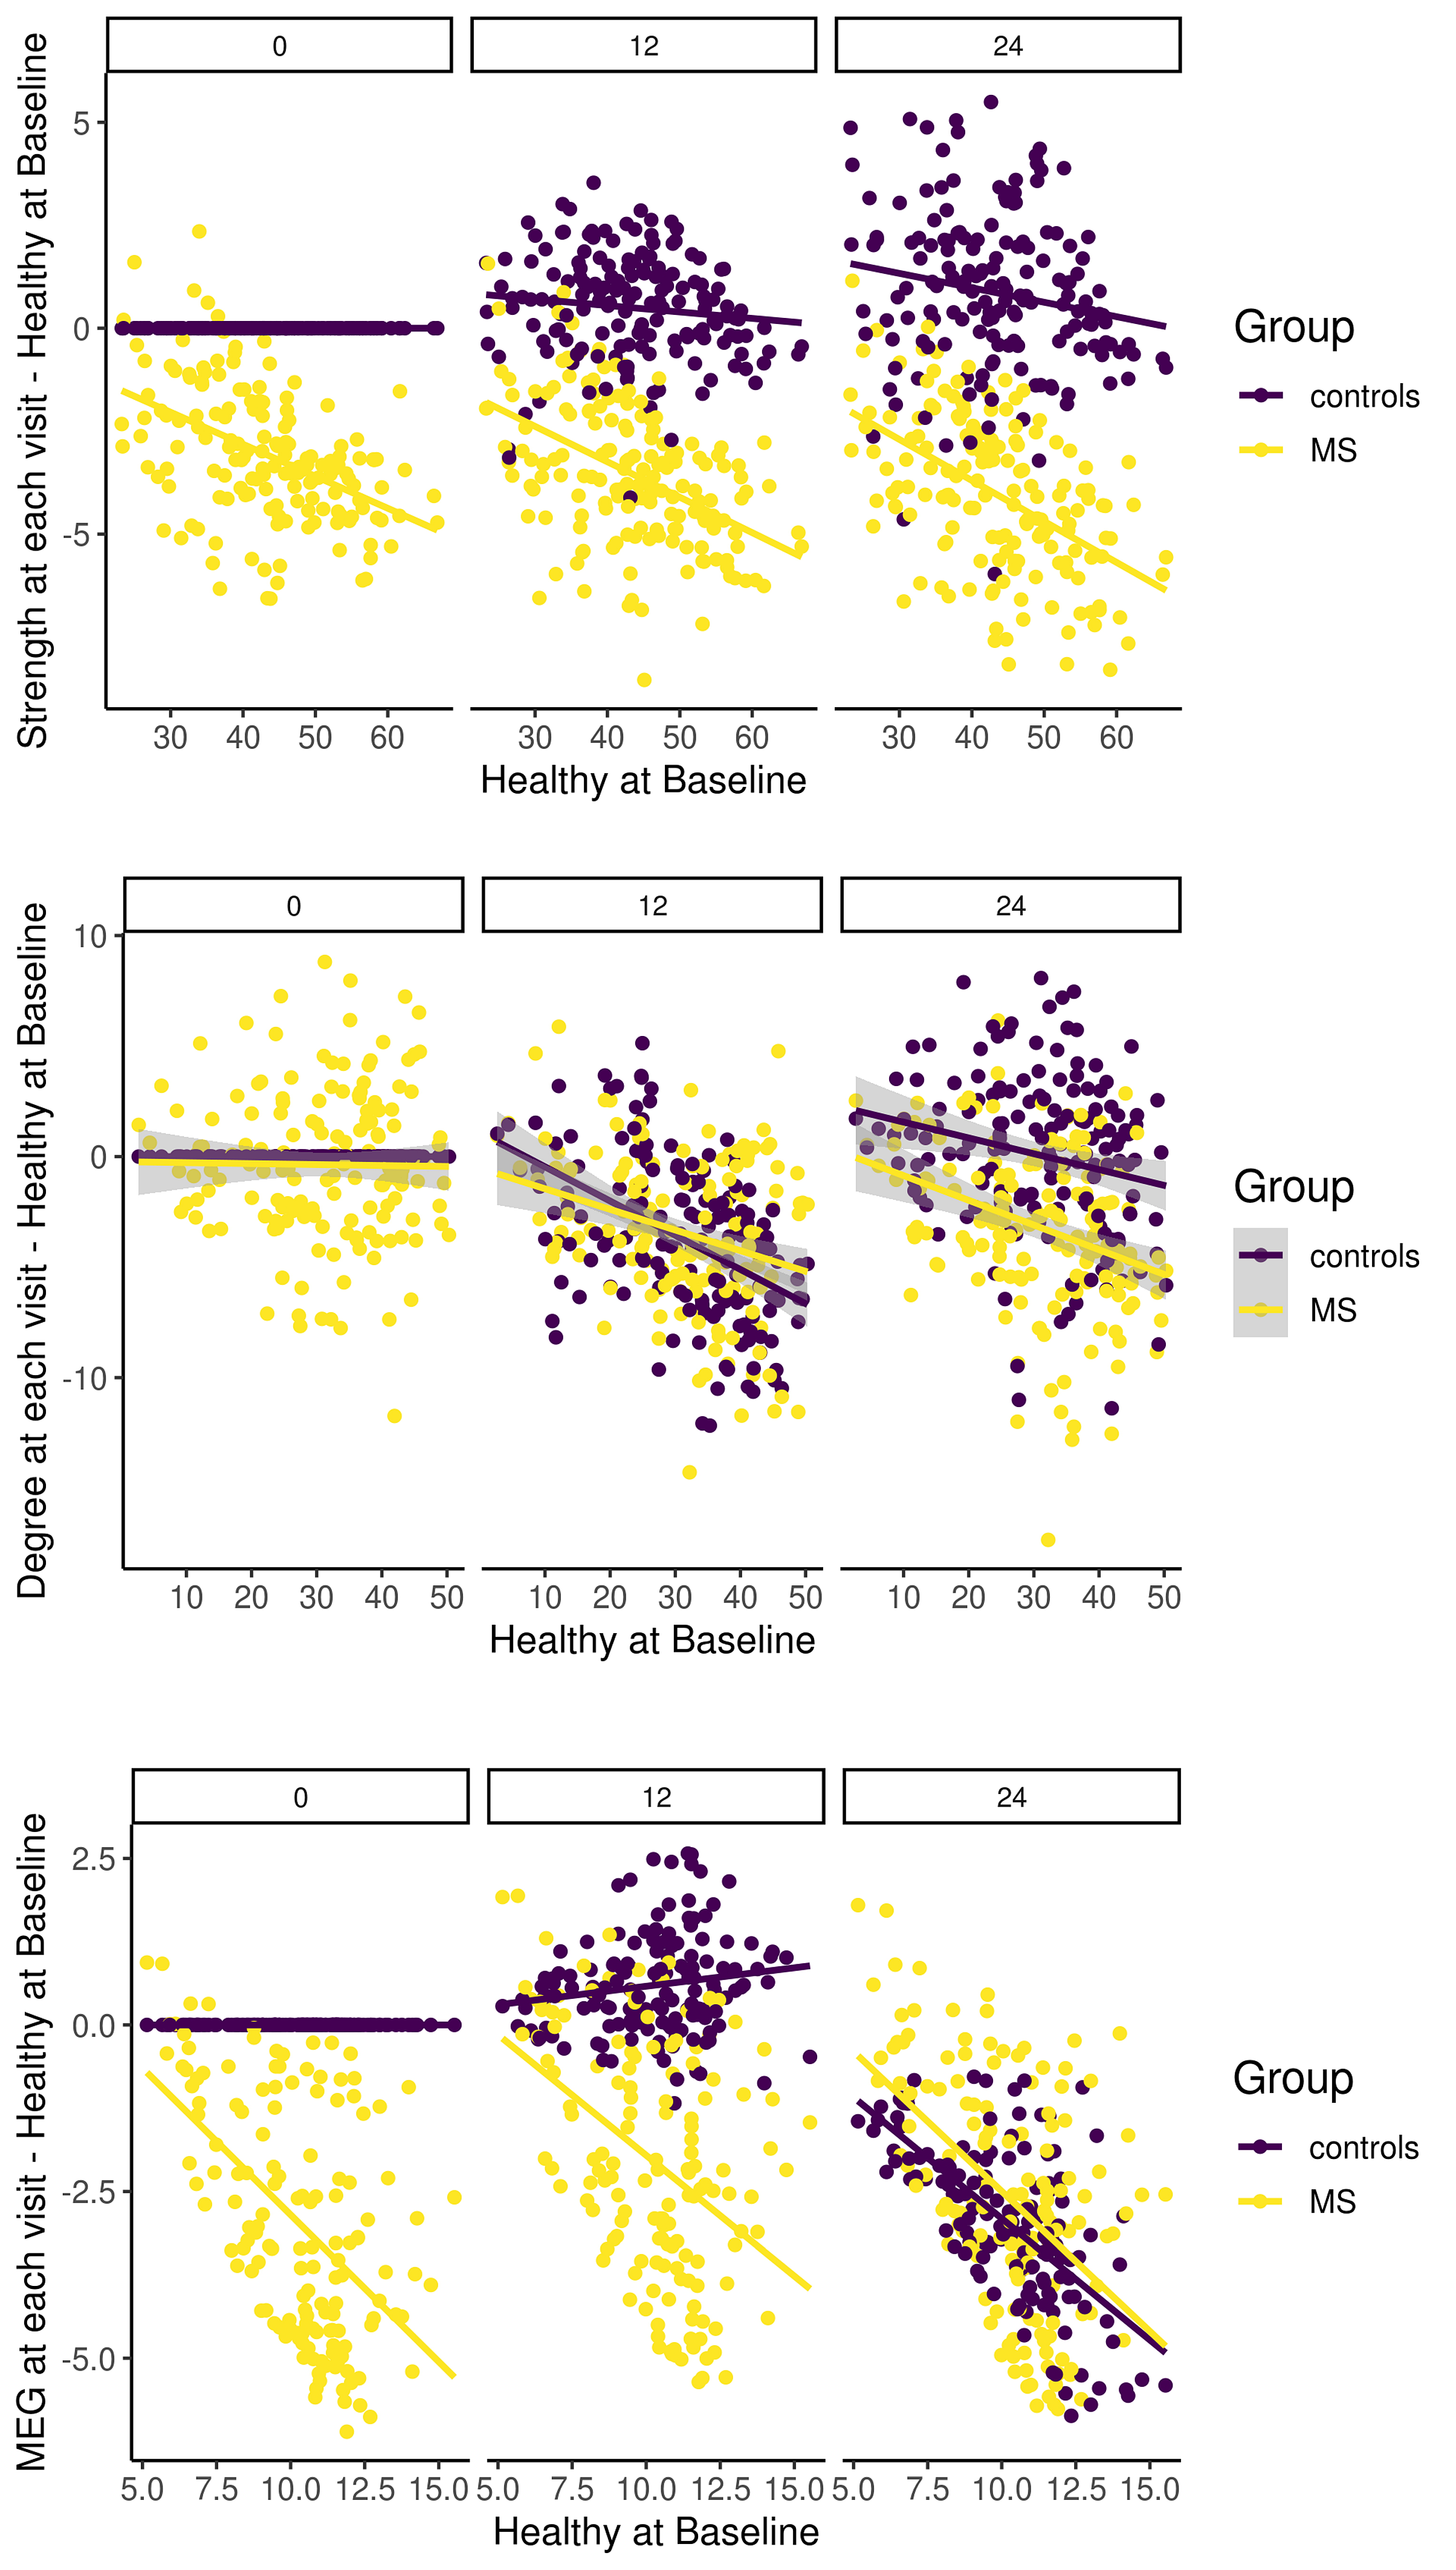
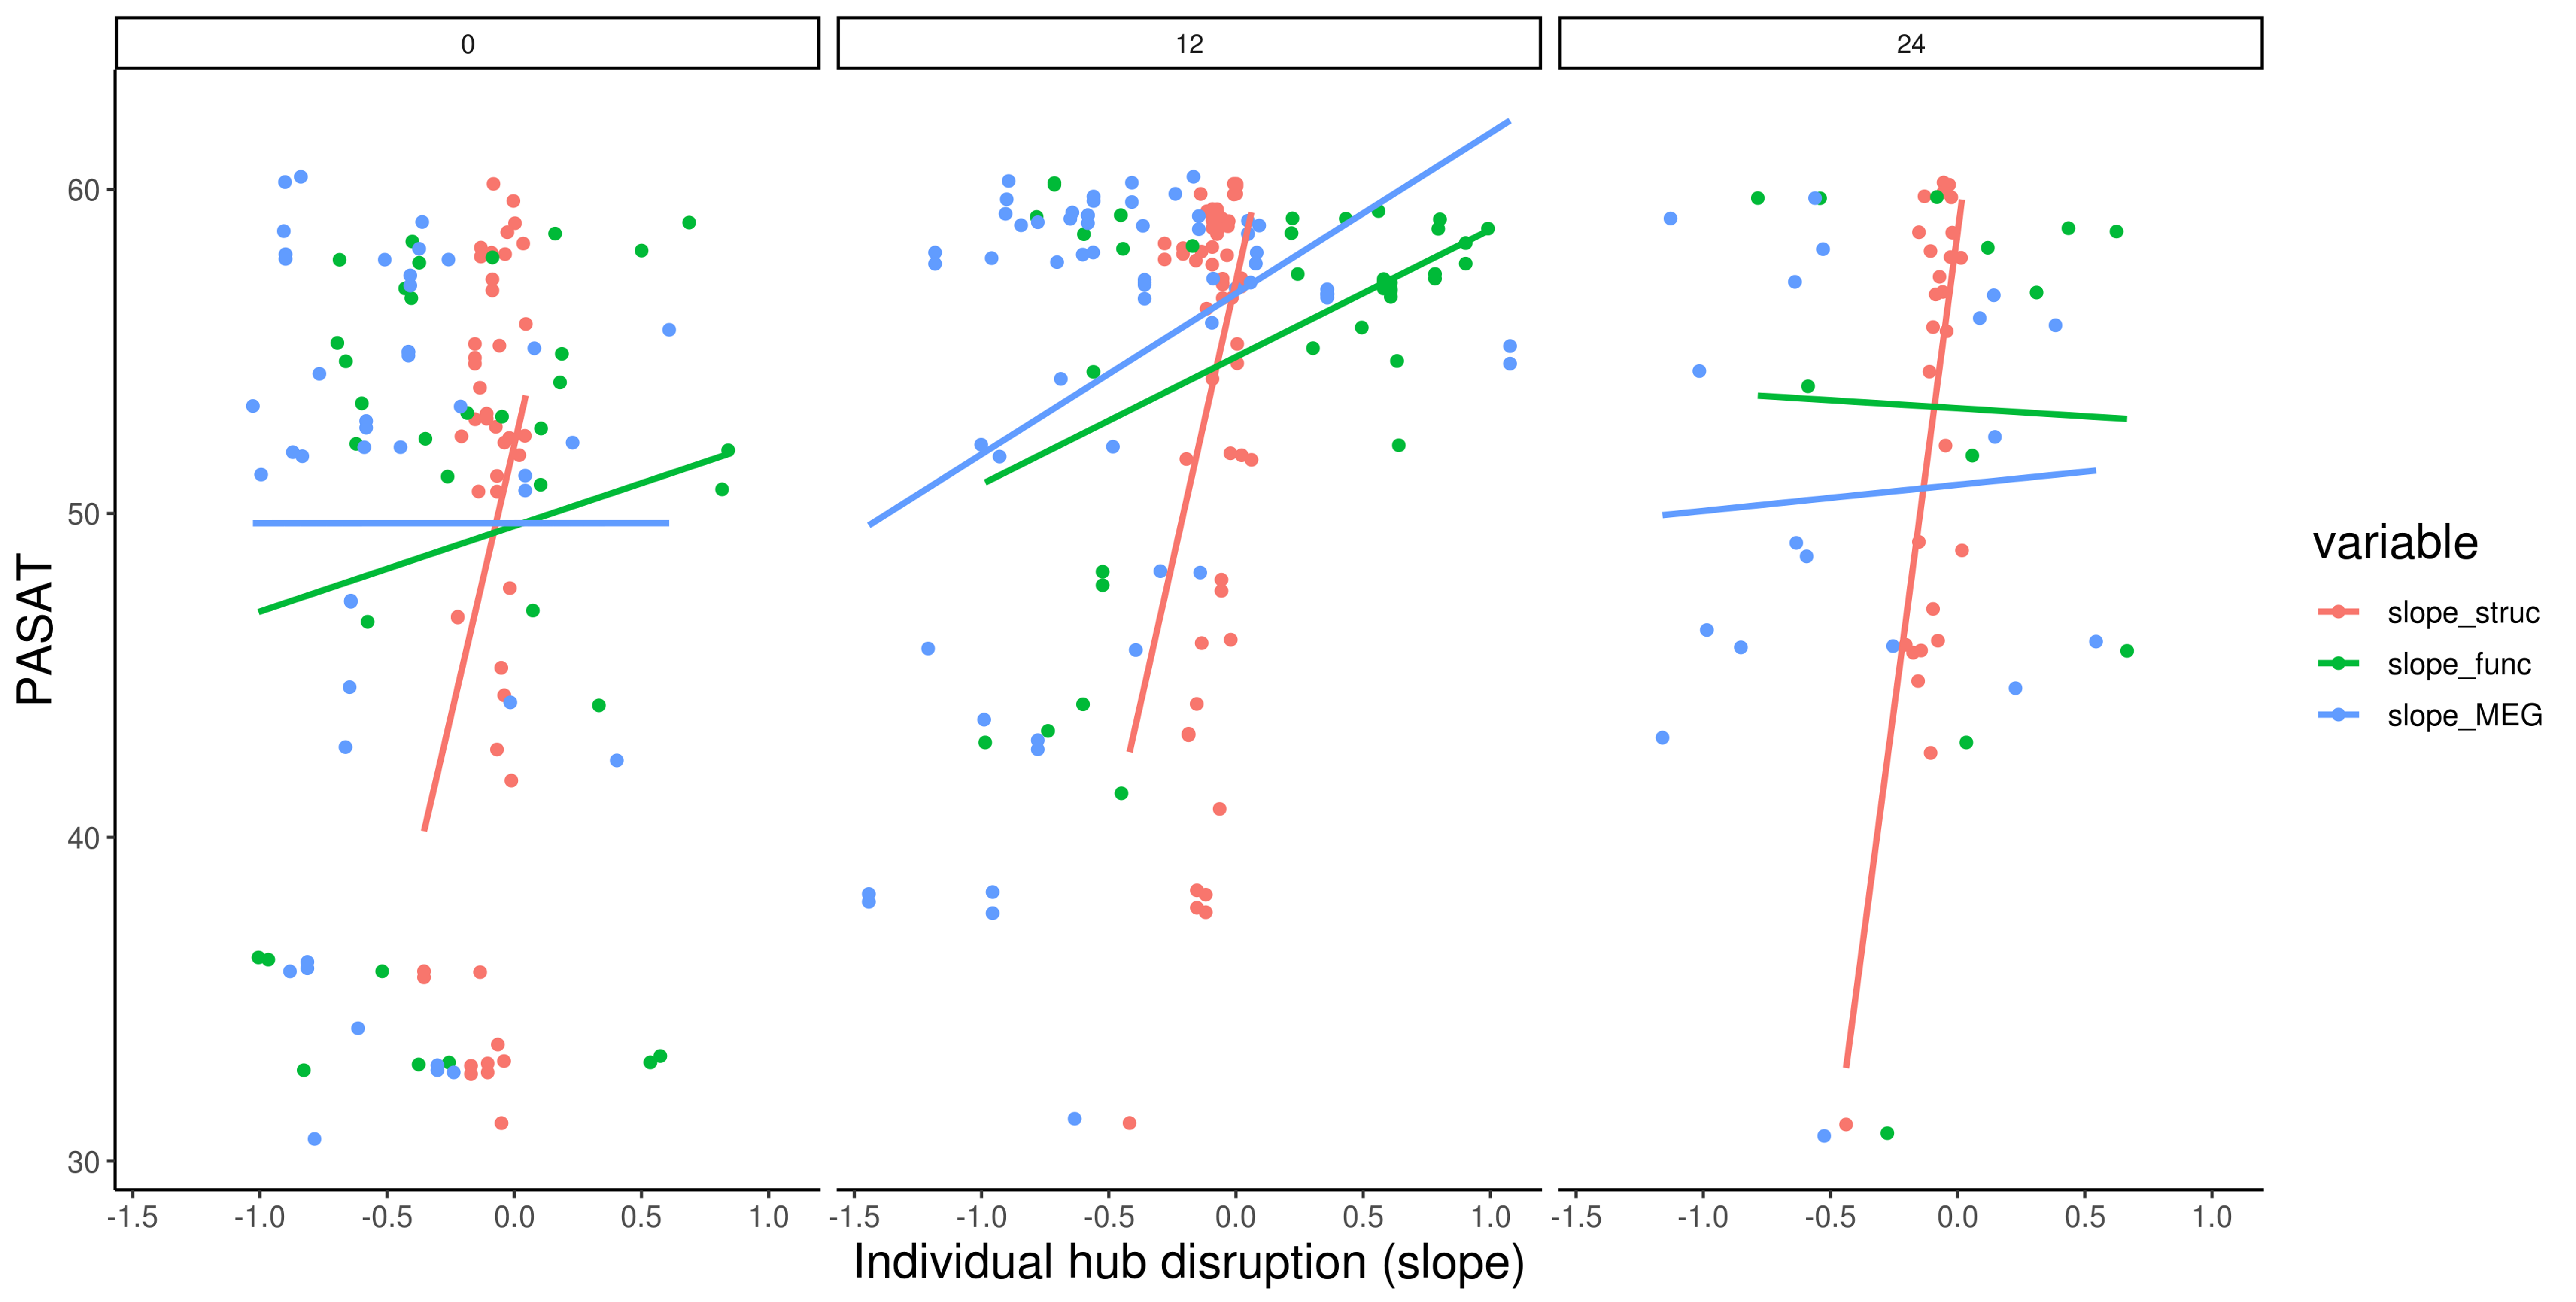
As clinical readout, among 20 different NP tests, only PASAT25 performance change in over two years was significantly different between patient and HC (p=0.009) (Figure 1). Interestingly, instead of decrement in cognitive performance, lack of improvement was seen in patients. Hub disruption in structural and MEG functional connectivity was clearly seen in patients compared to HC and tended to have further loss of connectivity over two years (Figure 2) while there was no difference in rs-fMRI degree. To compare the connectivity and PASAT performance of each subject, we extracted individual hub disruption of each subject as well. Individual structural hub disruption was strongly correlated with PASAT in patients and this correlation was getting better over 2 years (p<0.001) (Figure 3). In contrast, neither fMRI nor MEG connectivity showed a convincing correlation over two years (Figure 3).Discussion and Conclusion
RRMS patients have encountered with lack of improvement in PASAT over two years. Among the neuroimaging techniques, structural connectivity was more sensitive to show a relationship with a cognitive function over 2 years than the rs-fMRI and MEG functional metrics in very mildly disabled people with MS. These findings underline the difficulties associated with functional imaging studies in MS.Acknowledgements
No acknowledgement found.References
1. Filippi M, Bar-Or A, Piehl F, et al. Multiple sclerosis. Nat Rev Dis Prim. 2018;4(1):1-27. doi:10.1038/s41572-018-0041-4
2. Pardini M, Yaldizli Ö, Sethi V, et al. Motor network efficiency and disability in multiple sclerosis. Neurology. 2015;85(13):1115-1122. doi:10.1212/WNL.0000000000001970
3. Stam CJ. Modern network science of neurological disorders. Nat Rev Neurosci. 2014;15(10):683-695. doi:10.1038/nrn3801
4. Shu N, Duan Y, Huang J, et al. Progressive brain rich-club network disruption from clinically isolated syndrome towards multiple sclerosis. NeuroImage Clin. 2018;19:232-239. doi:10.1016/j.nicl.2018.03.034
5. Pagani E, Rocca MA, De Meo E, et al. Structural connectivity in multiple sclerosis and modeling of disconnection. Mult Scler J. January 2019:135245851882075. doi:10.1177/1352458518820759
6. Hawellek DJ, Hipp JF, Lewis CM, Corbetta M, Engel AK. Increased functional connectivity indicates the severity of cognitive impairment in multiple sclerosis. Proc Natl Acad Sci. 2011;108(47):19066-19071. doi:10.1073/pnas.1110024108
7. Stellmann JP, Hodecker S, Cheng B, et al. Reduced rich-club connectivity is related to disability in primary progressive MS. Neurol Neuroimmunol NeuroInflammation. 2017;4(5):1-10. doi:10.1212/NXI.0000000000000375
8. Shu N, Duan Y, Xia M, et al. Disrupted topological organization of structural and functional brain connectomes in clinically isolated syndrome and multiple sclerosis. Sci Rep. 2016;6(April):1-11. doi:10.1038/srep29383
9. Rocca MA, Valsasina P, Meani A, Falini A, Comi G, Filippi M. Impaired functional integration in multiple sclerosis: a graph theory study. Brain Struct Funct. 2016;221(1):115-131. doi:10.1007/s00429-014-0896-4
10. Schoonheim MM, Geurts JJG, Landi D, et al. Functional connectivity changes in multiple sclerosis patients: A graph analytical study of MEG resting state data. Hum Brain Mapp. 2013;34(1):52-61. doi:10.1002/hbm.21424
11. Enzinger C, Pinter D, Rocca MA, et al. Longitudinal fMRI studies: Exploring brain plasticity and repair in MS. Mult Scler J. 2016;22(3):269-278. doi:10.1177/1352458515619781
12. Penner I-K, Aktas O. Functional reorganization is a maladaptive response to injury – NO. Mult Scler J. 2017;23(2):193-194. doi:10.1177/1352458516679895
13. Rocca MA, Filippi M. Functional reorganization is a maladaptive response to injury – YES. Mult Scler J. 2017;23(2):191-193. doi:10.1177/1352458516667242
14. Polman CH, Reingold SC, Banwell B, et al. Diagnostic criteria for multiple sclerosis: 2010 Revisions to the McDonald criteria. Ann Neurol. 2011;69(2):292-302. doi:10.1002/ana.22366
15. Has Silemek AC, Fischer L, Pöttgen J, et al. Functional and structural connectivity substrates of cognitive performance in relapsing remitting multiple sclerosis with mild disability. NeuroImage Clin. 2020;25. doi:10.1016/j.nicl.2020.102177
16. Fischl B, Salat DH, Busa E, et al. Whole brain segmentation: automated labeling of neuroanatomical structures in the human brain. Neuron. 2002;33(3):341-355. http://www.ncbi.nlm.nih.gov/pubmed/11832223. Accessed November 13, 2018.
17. Reuter M, Schmansky NJ, Rosas HD, Fischl B. Within-subject template estimation for unbiased longitudinal image analysis. Neuroimage. 2012;61(4):1402-1418. doi:10.1016/j.neuroimage.2012.02.084
18. Destrieux C, Fischl B, Dale A, Halgren E. Automatic parcellation of human cortical gyri and sulci using standard anatomical nomenclature. Neuroimage. 2010;53(1):1-15. doi:10.1016/j.neuroimage.2010.06.010
19. Besson P, Dinkelacker V, Valabregue R, et al. Structural connectivity differences in left and right temporal lobe epilepsy. Neuroimage. 2014;100:135-144. doi:10.1016/j.neuroimage.2014.04.071
20. Wirsich J, Perry A, Ridley B, et al. Whole-brain analytic measures of network communication reveal increased structure-function correlation in right temporal lobe epilepsy. NeuroImage Clin. 2016;11:707-718. doi:10.1016/J.NICL.2016.05.010
21. Csárdi G, Nepusz T. The Igraph Software Package for Complex Network Research. https://pdfs.semanticscholar.org/1d27/44b83519657f5f2610698a8ddd177ced4f5c.pdf. Accessed June 19, 2019.
22. Opsahl T. Structure and Evolution of Weighted Networks. 2009. https://ethos.bl.uk/OrderDetails.do;jsessionid=652A420A33195813CEE0717B838DAA3A?uin=uk.bl.ethos.507253. Accessed November 13, 2018.
23. Achard S, Delon-Martin C, Vértes PE, et al. Hubs of brain functional networks are radically reorganized in comatose patients. Proc Natl Acad Sci U S A. 2012;109(50):20608-20613. doi:10.1073/pnas.1208933109
24. Bates D, Mächler M, Bolker B, Walker S. Fitting Linear Mixed-Effects Models Using lme4. J Stat Softw. 2015;67(1):1-48. doi:10.18637/jss.v067.i01
25. Gronwall DM, Sampson H. The psychological effects of concussion. 1974.
Figures