2796
T1 abnormalities in atlas-based white matter tracts: reducing the clinico-radiological paradox in multiple sclerosis using qMRI1Advanced Clinical Imaging Technology, Siemens Healthineers, Lausanne, Switzerland, 2Department of Radiology, Lausanne University Hospital and University of Lausanne, Lausanne, Switzerland, 3LTS5, Ecole Polytechnique Fédérale de Lausanne, Lausanne, Switzerland, 4Department of Radiology, First Faculty of Medicine, Charles University and General University Hospital, Prague, Czech Republic, 5Department of Neurology and Center of Clinical Neuroscience, First Faculty of Medicine, Charles University and General University Hospital, Prague, Czech Republic
Synopsis
In multiple sclerosis, standard radiological metrics (i.e. lesion load) correlate poorly with clinical outcomes. To overcome this limitation, we propose a novel method to evaluate T1 relaxometry abnormalities along thirty-seven major white matter pathways extracted from a tractography atlas, i.e. without needing a diffusion scan. Evaluating T1 z-scores along WM tracts strongly improved correlation with disability compared to lesion load. The strongest correlations were found for T1 abnormalities in normal-appearing white matter, especially in infratentorial tracts. These results suggest that diffuse pathological changes in normal-appearing WM measured along atlas-based tracts using T1 relaxometry could aid clinical evaluation of multiple sclerosis.
Introduction
Multiple sclerosis (MS) is a highly heterogeneous disease both in terms of clinical symptoms and radiological findings1,2. The ‘clinico-radiological’ paradox arises from the lack of substantial correlation between standard radiological metrics (e.g. lesion load) and clinical state – typically evaluated by using the Expanded Disease Status Scale (EDSS). In an attempt to overcome this limitation, previous work investigated lesion load distributions among white matter (WM) tracts extracted from a tractography atlas, showing significant associations between tract-specific lesion loads and clinical symptoms3,4. However, MS is known to be characterized not only by focal demyelinating lesions, but also diffuse WM damage2 that is not detectable by conventional MRI. Following this rationale, we propose to extend the method by evaluating tract-specific T1 relaxometry abnormalities both in lesions and normal-appearing WM (NAWM). We evaluate whether the extracted metrics improve the clinico-radiological correlation and how they compare to conventional radiological markers, namely total lesion volume (TLV) and total lesion count (TLC).Methods
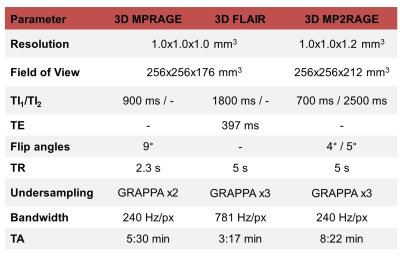
Image acquisition and populationNinety-two healthy controls (60 females, age$$$\,$$$=$$$\,$$$[21-59]$$$\,$$$y/o) and 47 early MS patients (35$$$\,$$$females, age$$$\,$$$=$$$\,$$$[19-50]$$$\,$$$y/o, disease duration$$$\,$$$<$$$\,$$$5$$$\,$$$years), with a median Expanded Disability Status Scale (EDSS) score of 2.0 (range$$$\,$$$=$$$\,$$$[0-4.0]) were scanned at 3T (MAGNETOM Skyra, Siemens Healthcare, Erlangen, Germany) using 3D MPRAGE, FLAIR and MP2RAGE5 protocols with parameters listed in Table 1.
Extraction of T1 z-scores
Skull stripping and automated brain segmentation was performed on the MP2RAGE contrast using the MorphoBox prototype6,7.
An anatomical study-specific template (SST) was built from the skull-stripped uniform MP2RAGE images of 20 randomly selected healthy subjects (12 females, age$$$\,$$$=$$$\,$$$[27-57]$$$\,$$$y/o)8. T1 maps of the entire healthy cohort were non-rigidly spatially normalized into the SST space10. Reference T1 values (E{T1}) in healthy tissues were estimated voxel-wise by employing a linear model that considers age and gender as covariates9: E{T1}$$$\,$$$=$$$\,$$$β0$$$\,$$$+$$$\,$$$βsex*sex$$$\,$$$+$$$\,$$$βage*age$$$\,$$$+$$$\,$$$βage2*age2.
Patients’ MP2RAGE data were non-linearly spatially registered onto the SST10, and T1 deviations from the established reference atlas were calculated voxel-wise as z-scores9. Inverse transformation was applied to bring the estimated z‐score maps into the patients’ native space. Additionally, brain WM lesions were automatically segmented using the prototype software LeMan-PV11 from the MPRAGE and FLAIR contrasts.
T1 damage on WM tracts
A tractography atlas was used to extract density maps from 37 WM tracts3. Tract density maps, representing the voxel-wise density of streamlines, were spatially registered to the patient MPRAGE space. As previously proposed4, the density map of each tract was overlapped with the lesion mask and density-weighted tract-specific lesion volume (TSLVw) [ml] was estimated. Normalized tract-specific lesion volumes (TSLVn) were also extracted by dividing TSLVw [ml] by the overall tract volume [ml]. To estimate the extent of tract-specific diffuse tissue damage, the tract density map was overlapped with z-scores maps and T1 abnormalities were evaluated in both lesions and NAWM by extracting the average absolute z-score (|Z|avg) [std] and the volume of voxels with an absolute z-score value exceeding a threshold of 2 (|Z|vol) [ml].
Statistical analysis
Spearman correlation between the four tract damage metrics (TSLVw, TSLVn, |Z|avg and |Z|vol), and EDSS was evaluated and compared to standard radiological metrics (TLV and TLC).
Results
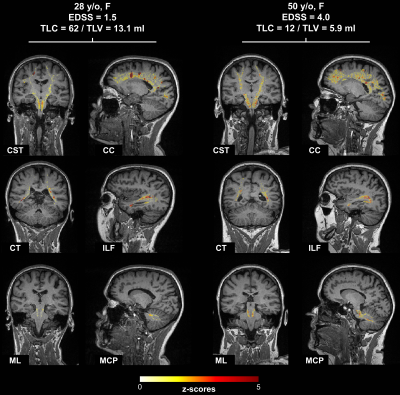
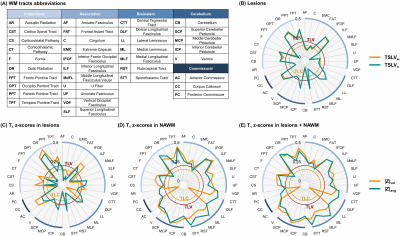
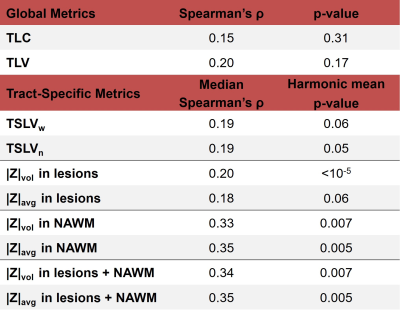
T1 z-scores maps estimated in six tracts of two example patients with low and high EDSS, respectively, are shown in Figure 1. Overall, the patient with higher EDSS is characterized by higher z-scores within the NAWM, whereas no substantial z-score differences could be visually observed in lesions.Figure 2 reports the correlations of tract-specific metrics with EDSS, whilst the median correlation across tracts and the harmonic mean p-value12 are reported in Table 2. Overall, tract-specific metrics outperform whole-brain metrics whose correlations are 0.13 (p$$$\,$$$=$$$\,$$$0.31) and 0.18 (p$$$\,$$$=$$$\,$$$0.17) for TLC and TLV, respectively. Substantially stronger correlations are found when tract-specific relaxometry abnormalities are evaluated in NAWM, both alone and in combination with lesioned tissue (up to 0.35 median correlation, phmp$$$\,$$$=$$$\,$$$0.005), compared to restricting the analysis to lesioned volume (up to 0.20 median correlation, phmp$$$\,$$$=$$$\,$$$0.05). When evaluating relaxometry abnormalities in NAWM, brainstem and cerebellar tracts are characterized by higher correlations (up to 0.48 and 0.47, respectively), whilst projection pathways are the most correlated with EDSS in metrics related to lesions (up to 0.39). No substantial differences in terms of correlation are observed between |Z|avg and |Z|vol.
Discussion and Conclusion
We proposed an innovative method to evaluate T1 abnormalities – corrected for age and sex – along WM tracts extracted from a tractography atlas. T1 relaxometry abnormalities along tracts improved the correlation with EDSS compared to standard metrics, i.e. global, and tract-specific lesion load. The strongest correlations were found for T1 z-scores evaluated in NAWM, especially in infratentorial tracts. Altogether, these results suggest that, compared to focal lesions, evaluating diffuse tissue damage improves clinico-radiological correlations in MS. The proposed method based on combining T1 relaxometry techniques with a tractography atlas allowed to define new clinically relevant biomarkers representing tract-specific T1 abnormalities without the need for an additional diffusion scan and tractography. In addition, this provides further evidence that tract-specific biomarkers could be more accurate for clinical correlations than whole-brain biomarkers such as TLC and TLV, which smooth out the different tract-specific contributions to clinical correlations. In this context, the full potential of tract-specific damage should be explored using multivariate techniques in future.Acknowledgements
This project was supported by Roche (healthy controls), Czech Ministry of Health project grants NV18-04-00168 and NV18-08-00062, RVO 64165.References
1. Reich DS, Lucchinetti CF, Calabresi PA. Multiple Sclerosis. N Engl J Med. 2018;378(2):169-180. doi:10.1056/NEJMra1401483
2. Filippi M, Rocca MA. MRI evidence for multiple sclerosis as a diffuse disease of the central nervous system. J Neurol. 2005;252(S5):v16-v24. doi:10.1007/s00415-005-5004-5
3. Yeh FC, Panesar S, Fernandes D, et al. Population-averaged atlas of the macroscale human structural connectome and its network topology. Neuroimage. 2018;178(January):57-68. doi:10.1016/j.neuroimage.2018.05.027
4. Ravano V, Andelova M, Fouad M, et al. Automated atlas-based mapping of white matter tract damage to multiple sclerosis symptoms. In: Proceedings of the International Society of Magnetic Resonance in Medicine. ; 2020:1391.
5. Marques JP, Kober T, Krueger G, van der Zwaag W, Van de Moortele P-F, Gruetter R. MP2RAGE, a self bias-field corrected sequence for improved segmentation and T1-mapping at high field. Neuroimage. 2010;49(2):1271-1281. doi:10.1016/j.neuroimage.2009.10.002
6. Schmitter D, Roche A, Maréchal B, et al. An evaluation of volume-based morphometry for prediction of mild cognitive impairment and Alzheimer’s disease. NeuroImage Clin. 2015;7(1):7-17. doi:10.1016/j.nicl.2014.11.001
7. Boto J, Gkinis G, Roche A, et al. Evaluating anorexia-related brain atrophy using MP2RAGE-based morphometry. Eur Radiol. 2017;27(12):5064-5072. doi:10.1007/s00330-017-4914-9
8. Avants BB, Tustison NJ, Song G, Cook PA, Klein A, Gee JC. A reproducible evaluation of ANTs similarity metric performance in brain image registration. Neuroimage. 2011;54(3):2033-2044. doi:10.1016/j.neuroimage.2010.09.025
9. Piredda GF, Hilbert T, Granziera C, et al. Quantitative brain relaxation atlases for personalized detection and characterization of brain pathology. Magn Reson Med. 2020;83(1):337-351. doi:10.1002/mrm.27927
10. Klein S, Staring M, Murphy K, Viergever M a., Pluim J. elastix: A Toolbox for Intensity-Based Medical Image Registration. IEEE Trans Med Imaging. 2010;29(1):196-205. doi:10.1109/TMI.2009.2035616
11. Fartaria MJ, Todea A, Kober T, et al. Partial volume-aware assessment of multiple sclerosis lesions. NeuroImage Clin. 2018;18(January):245-253. doi:10.1016/j.nicl.2018.01.011
12. Wilson DJ. The harmonic mean p-value for combining dependent test. Proceedings of the National Academy of Sciences of the United States of America. 2019;166:1195-1200
Figures


