2795
Periventricular gradients of brain pathology in early and progressive MS revealed by qMRI
Gian Franco Piredda1,2,3, Tom Hilbert1,2,3, Manuela Vaneckova4, Jan Krasensky4, Michaela Andelova5, Tomas Uher5, Barbora Srpova5, Eva Kubala Havrdova5, Karolina Vodehnalova5, Dana Horakova5, Veronica Ravano1,2,3, Bénédicte Maréchal1,2,3, Jean-Philippe Thiran2,3, and Tobias Kober1,2,3
1Advanced Clinical Imaging Technology, Siemens Healthcare AG, Lausanne, Switzerland, 2Department of Radiology, Lausanne University Hospital and University of Lausanne, Lausanne, Switzerland, 3LTS5, École Polytechnique Fédérale de Lausanne (EPFL), Lausanne, Switzerland, 4Department of Radiology, First Faculty of Medicine, Charles University and General University Hospital, Prague, Poland, 5Department of Neurology and Center of Clinical Neuroscience, First Faculty of Medicine, Charles University and General University Hospital, Prague, Poland
1Advanced Clinical Imaging Technology, Siemens Healthcare AG, Lausanne, Switzerland, 2Department of Radiology, Lausanne University Hospital and University of Lausanne, Lausanne, Switzerland, 3LTS5, École Polytechnique Fédérale de Lausanne (EPFL), Lausanne, Switzerland, 4Department of Radiology, First Faculty of Medicine, Charles University and General University Hospital, Prague, Poland, 5Department of Neurology and Center of Clinical Neuroscience, First Faculty of Medicine, Charles University and General University Hospital, Prague, Poland
Synopsis
In multiple sclerosis, gradients of tissue damage severity were found in periventricular areas and proved to change in response to treatment. This work investigates whether these gradual microstructural changes can be detected with high-resolution, whole-brain quantitative T1 mapping and how they compare between two cohorts of early and progressive multiple sclerosis patients. T1 deviations were computed in patients from normative atlases established in a healthy cohort and corrected for age and gender. Results show that a periventricular gradient of abnormal T1 values in normal-appearing white matter is indeed present and increases from early to progressive stages of the disease.
Introduction
Multiple sclerosis (MS) is an inflammatory disease of the central nervous system (CNS) that entails focal and diffuse damage1. Although MS-related alterations involve the entire CNS, it was shown that certain brain areas are affected more than others, such as periventricular regions, thalamus, and sub-pial grey matter2. For instance, white matter (WM) focal lesions are more prominent in periventricular regions, and processes like spontaneous remyelination were found to be less efficient in the proximity of the ventricular cerebrospinal fluid3. A periventricular gradient of normal-appearing WM (NAWM) damage severity was also observed by measurements of magnetization transfer ratio (MTR) and mean diffusivity (MD) across a wide spectrum of MS phenotypes4–7, and proved to change in response to treatment8.On this basis, this work investigates whether quantitative T1 mapping can detect this periventricular gradient of tissue damage in two cohorts of early (i.e., patients on disease onset) and progressive MS patients. To that end, atlases of normal T1 values were established in a healthy cohort to compute abnormal T1 deviations corrected for age and gender in patients’ pathological tissues.
Methods
Population and image acquisitionNinety-two healthy controls (60$$$\,$$$females, age$$$\,$$$=$$$\,$$$[21-59]$$$\,$$$y/o), 47 early MS patients (35$$$\,$$$females, age$$$\,$$$=$$$\,$$$[19-50]$$$\,$$$y/o, median Expanded Disability Status Scale (EDSS)$$$\,$$$=$$$\,$$$2.0$$$\,$$$[0-4]) and 52 progressive MS patients (43$$$\,$$$females, age$$$\,$$$=$$$\,$$$[35-64]$$$\,$$$y/o, median EDSS$$$\,$$$=$$$\,$$$5.5$$$\,$$$[3.5-6.5]) underwent an MR examination at 3T (MAGNETOM Skyra, Siemens Healthcare, Erlangen, Germany). The employed 3D protocol included T1-weighted MPRAGE, T2-weighted FLAIR, and MP2RAGE for T1 mapping9,10 (acquisition parameters are reported in Table 1).
Image analysis
Automated tissue segmentation was performed on the MP2RAGE data using the prototype software MorphoBox11,12. Segmentation of lesions in the patient datasets was performed fully automatically with the prototype software LeManPV13 using the MPRAGE and FLAIR contrasts; lesion masks were subsequently rigidly resampled onto the MP2RAGE space.
The healthy controls’ MP2RAGE data and segmentation masks were spatially normalized into a study-specific template (SST, Figure 1A) built from 20 randomly selected subjects (12$$$\,$$$females, age$$$\,$$$=$$$\,$$$[27-57]$$$\,$$$y/o)14. Reference T1 values in healthy tissues were established by linear, voxel-wise modelling of the T1 inter-subject variability while including age and gender as covariates15 (Figure 1B). Data of the two MS cohorts were spatially registered onto the SST, and T1 deviations from the established atlases were calculated as z-score maps15.
To study the periventricular gradient in MS, bands of one voxel thickness were built around the ventricles in the SST. To that end, binary ventricles masks of the healthy cohort were averaged and then thresholded at 0.5 to obtain the final mask. Subsequently, the Euclidean distance to the closest voxel in the ventricles mask was assigned to each voxel in the supratentorial WM. Distances were then rounded to the nearest integer; 30 periventricular bands were extracted in that manner, representing NAWM layers from 1 to 30$$$\,$$$mm away from the ventricles (Figure 1C). In each patient dataset, the lesion volume and corresponding mean z-score were extracted for each periventricular band, together with the abnormal WM volume – identified as the volume of voxels whose associated T1 exceeds the prediction interval at 95% level of confidence of the normative linear model (i.e. |z-score|$$$\,$$$>$$$\,$$$2) – and the corresponding mean z-score.
Results
Representative z-scores maps are shown in Figure 2, highlighting lesions and NAWM region with altered T1 values.The probability of encountering a brain lesion was found to progressively decrease with distance from the ventricles in both MS cohorts and to be higher in the progressive MS patients as expected (Figure 3A-B). The periventricular distribution of z-scores within lesions was observed to increase in the first 5-6 bands for the early MS cohort and to maintain a stable value afterwards (Figure 3C-D). Additionally, in the intermediate WM bands, z-scores in lesions were found to be lower in the progressive cohort.
A periventricular gradient of abnormal WM volume was observed in both cohorts. More specifically, the percentage of affected NAWM in the periventricular bands was found to decrease from 21% to 3% in the early MS cohort and from 36% to 17% in the progressive cohort (Figure 4A-B). A periventricular gradient of z-scores was also observed, indicating a decreasing severity of the NAWM damage with the distance from the ventricles and a higher damage in the progressive cohort (Figure 4C-D).
Discussion and Conclusion
A periventricular gradient of tissue damage was assessed in MS using T1 relaxometry. In contrast to previous work on MTR or MD4,7, we included age and gender in our normal-tissue model used to generate the z-score maps15. Interestingly, abnormal T1 values in lesions were found to not differ between patient groups or to be even lower in the progressive cohort, indicating that processes that shorten T1, like the absence of prominent inflammation in “burnt out” lesions, remyelination, or iron deposition, are more common in later stages of the disease. Of notice, a clear periventricular gradient of abnormal T1 values in NAWM was found to occur in early phases of MS and to increase in the progressive stage of the disease, suggesting that this type of analyses have clinical relevance. Following this direction, future work will perform single-subject analyses of the investigated gradients in the early diagnosis and classification of MS and will explore correlation of the established metrics with clinical outcomes.Acknowledgements
This project was supported by Roche (healthy controls), Czech Ministry of Health project grants NV18-04-00168 and NV18-08-00062, RVO 64165.References
- Reich DS, Lucchinetti CF, Calabresi PA. Multiple Sclerosis. Longo DL, ed. N Engl J Med. 2018;378(2):169-180. doi:10.1056/NEJMra14014832.
- Kutzelnigg A, Lassmann H. Pathology of multiple sclerosis and related inflammatory demyelinating diseases. In: Handbook of Clinical Neurology. Vol 122. ; 2014:15-58. doi:10.1016/B978-0-444-52001-2.00002-93.
- Tonietto M, Poirion E, Papeix C, Bottlaender M, Bodini B, Stankoff B. Remyelination is less efficient in periventricular white matter lesions in Multiple Sclerosis. In: Proceedings of the International Society of Magnetic Resonance in Medicine, Montreal, Canada. 2019. Abstract 0121.
- Liu Z, Pardini M, Yaldizli Ö, et al. Magnetization transfer ratio measures in normal-appearing white matter show periventricular gradient abnormalities in multiple sclerosis. Brain. 2015;138(5):1239-1246. doi:10.1093/brain/awv0655.
- Pardini M, Sudre CH, Prados F, et al. Relationship of grey and white matter abnormalities with distance from the surface of the brain in multiple sclerosis. J Neurol Neurosurg Psychiatry. 2016;87(11):1212-1217. doi:10.1136/jnnp-2016-3139796.
- Brown JWL, Pardini M, Brownlee WJ, et al. An abnormal periventricular magnetization transfer ratio gradient occurs early in multiple sclerosis. Brain. 2017;140(2):387-398. doi:10.1093/brain/aww2967.
- Pardini M, Petracca M, Harel A, et al. The relationship between cortical lesions and periventricular NAWM abnormalities suggests a shared mechanism of injury in primary-progressive MS. NeuroImage Clin. 2017;16:111-115. doi:10.1016/j.nicl.2017.07.0018.
- Brown JWL, Prados Carrasco F, Eshaghi A, et al. Periventricular magnetisation transfer ratio abnormalities in multiple sclerosis improve after alemtuzumab. Mult Scler J. 2020;26(9):1093-1101. doi:10.1177/13524585198520939.
- Marques JP, Kober T, Krueger G, van der Zwaag W, Van de Moortele P-F, Gruetter R. MP2RAGE, a self bias-field corrected sequence for improved segmentation and T1-mapping at high field. Neuroimage. 2010;49(2):1271-1281. doi:10.1016/j.neuroimage.2009.10.00210.
- Mussard E, Hilbert T, Forman C, Meuli R, Thiran JP, Kober T. Accelerated MP2RAGE imaging using Cartesian phyllotaxis readout and compressed sensing reconstruction. Magn Reson Med. 2020;84(4):1881-1894. doi:10.1002/mrm.2824411.
- Schmitter D, Roche A, Maréchal B, et al. An evaluation of volume-based morphometry for prediction of mild cognitive impairment and Alzheimer’s disease. NeuroImage Clin. 2015;7:7-17. doi:10.1016/j.nicl.2014.11.00112.
- Boto J, Gkinis G, Roche A, et al. Evaluating anorexia-related brain atrophy using MP2RAGE-based morphometry. Eur Radiol. 2017;27(12):5064-5072. doi:10.1007/s00330-017-4914-913.
- Fartaria MJ, Todea A, Kober T, et al. Partial volume-aware assessment of multiple sclerosis lesions. NeuroImage Clin. 2018;18:245-253. doi:10.1016/j.nicl.2018.01.01114.
- Avants BB, Tustison NJ, Song G, Cook PA, Klein A, Gee JC. A reproducible evaluation of ANTs similarity metric performance in brain image registration. Neuroimage. 2011;54(3):2033-2044. doi:10.1016/j.neuroimage.2010.09.02515.
- Piredda GF, Hilbert T, Granziera C, et al. Quantitative brain relaxation atlases for personalized detection and characterization of brain pathology. Magn Reson Med. 2020;83(1):337-351. doi:10.1002/mrm.27927
Figures
Table 1. Parameters of the acquired 3D MPRAGE, FLAIR, and MP2RAGE sequences. For the healthy cohort (HC) and early MS patients, the MP2RAGE sequence was undersampled using GRAPPA; conversely, for the progressive cohort, compressed sensing (CS) was employed to accelerate the sequence acquisition.
Figure 1. Representative slices of (A) the anatomical study specific template, (B) the normative T1 atlas, and (C) the distance to ventricles of the supratentorial WM voxels. The intercept, sex, age, and age2 maps in (B) are intended as the β0, βsex, βage and βage2 coefficients of the following equation describing the expected reference T1 value in a given brain voxel: E{T1} = β0 + βsex*sex + βage*age + βage2*age2, with sex being a categorical variable and the age expressed in years and centered at the mean age of the healthy cohort (37 y).
Figure 2. Representative example z-score maps overlaid onto the MP2RAGE contrast in early MS patients with low Expanded Disability Status Scale (EDSS) scores and progressive MS patients with higher EDSS.
Figure 3. Periventricular gradients of (A) absolute lesion volume (ml) and (B) normalized lesion volume to the total periventricular band volume. Periventricular trends in MS lesions of (C) absolute z-scores and (D) absolute z-scores > 2. Error bars indicate two standard errors. Reported values in the first band should be carefully considered as they may be affected by partial-volume effects between CSF and WM tissues.
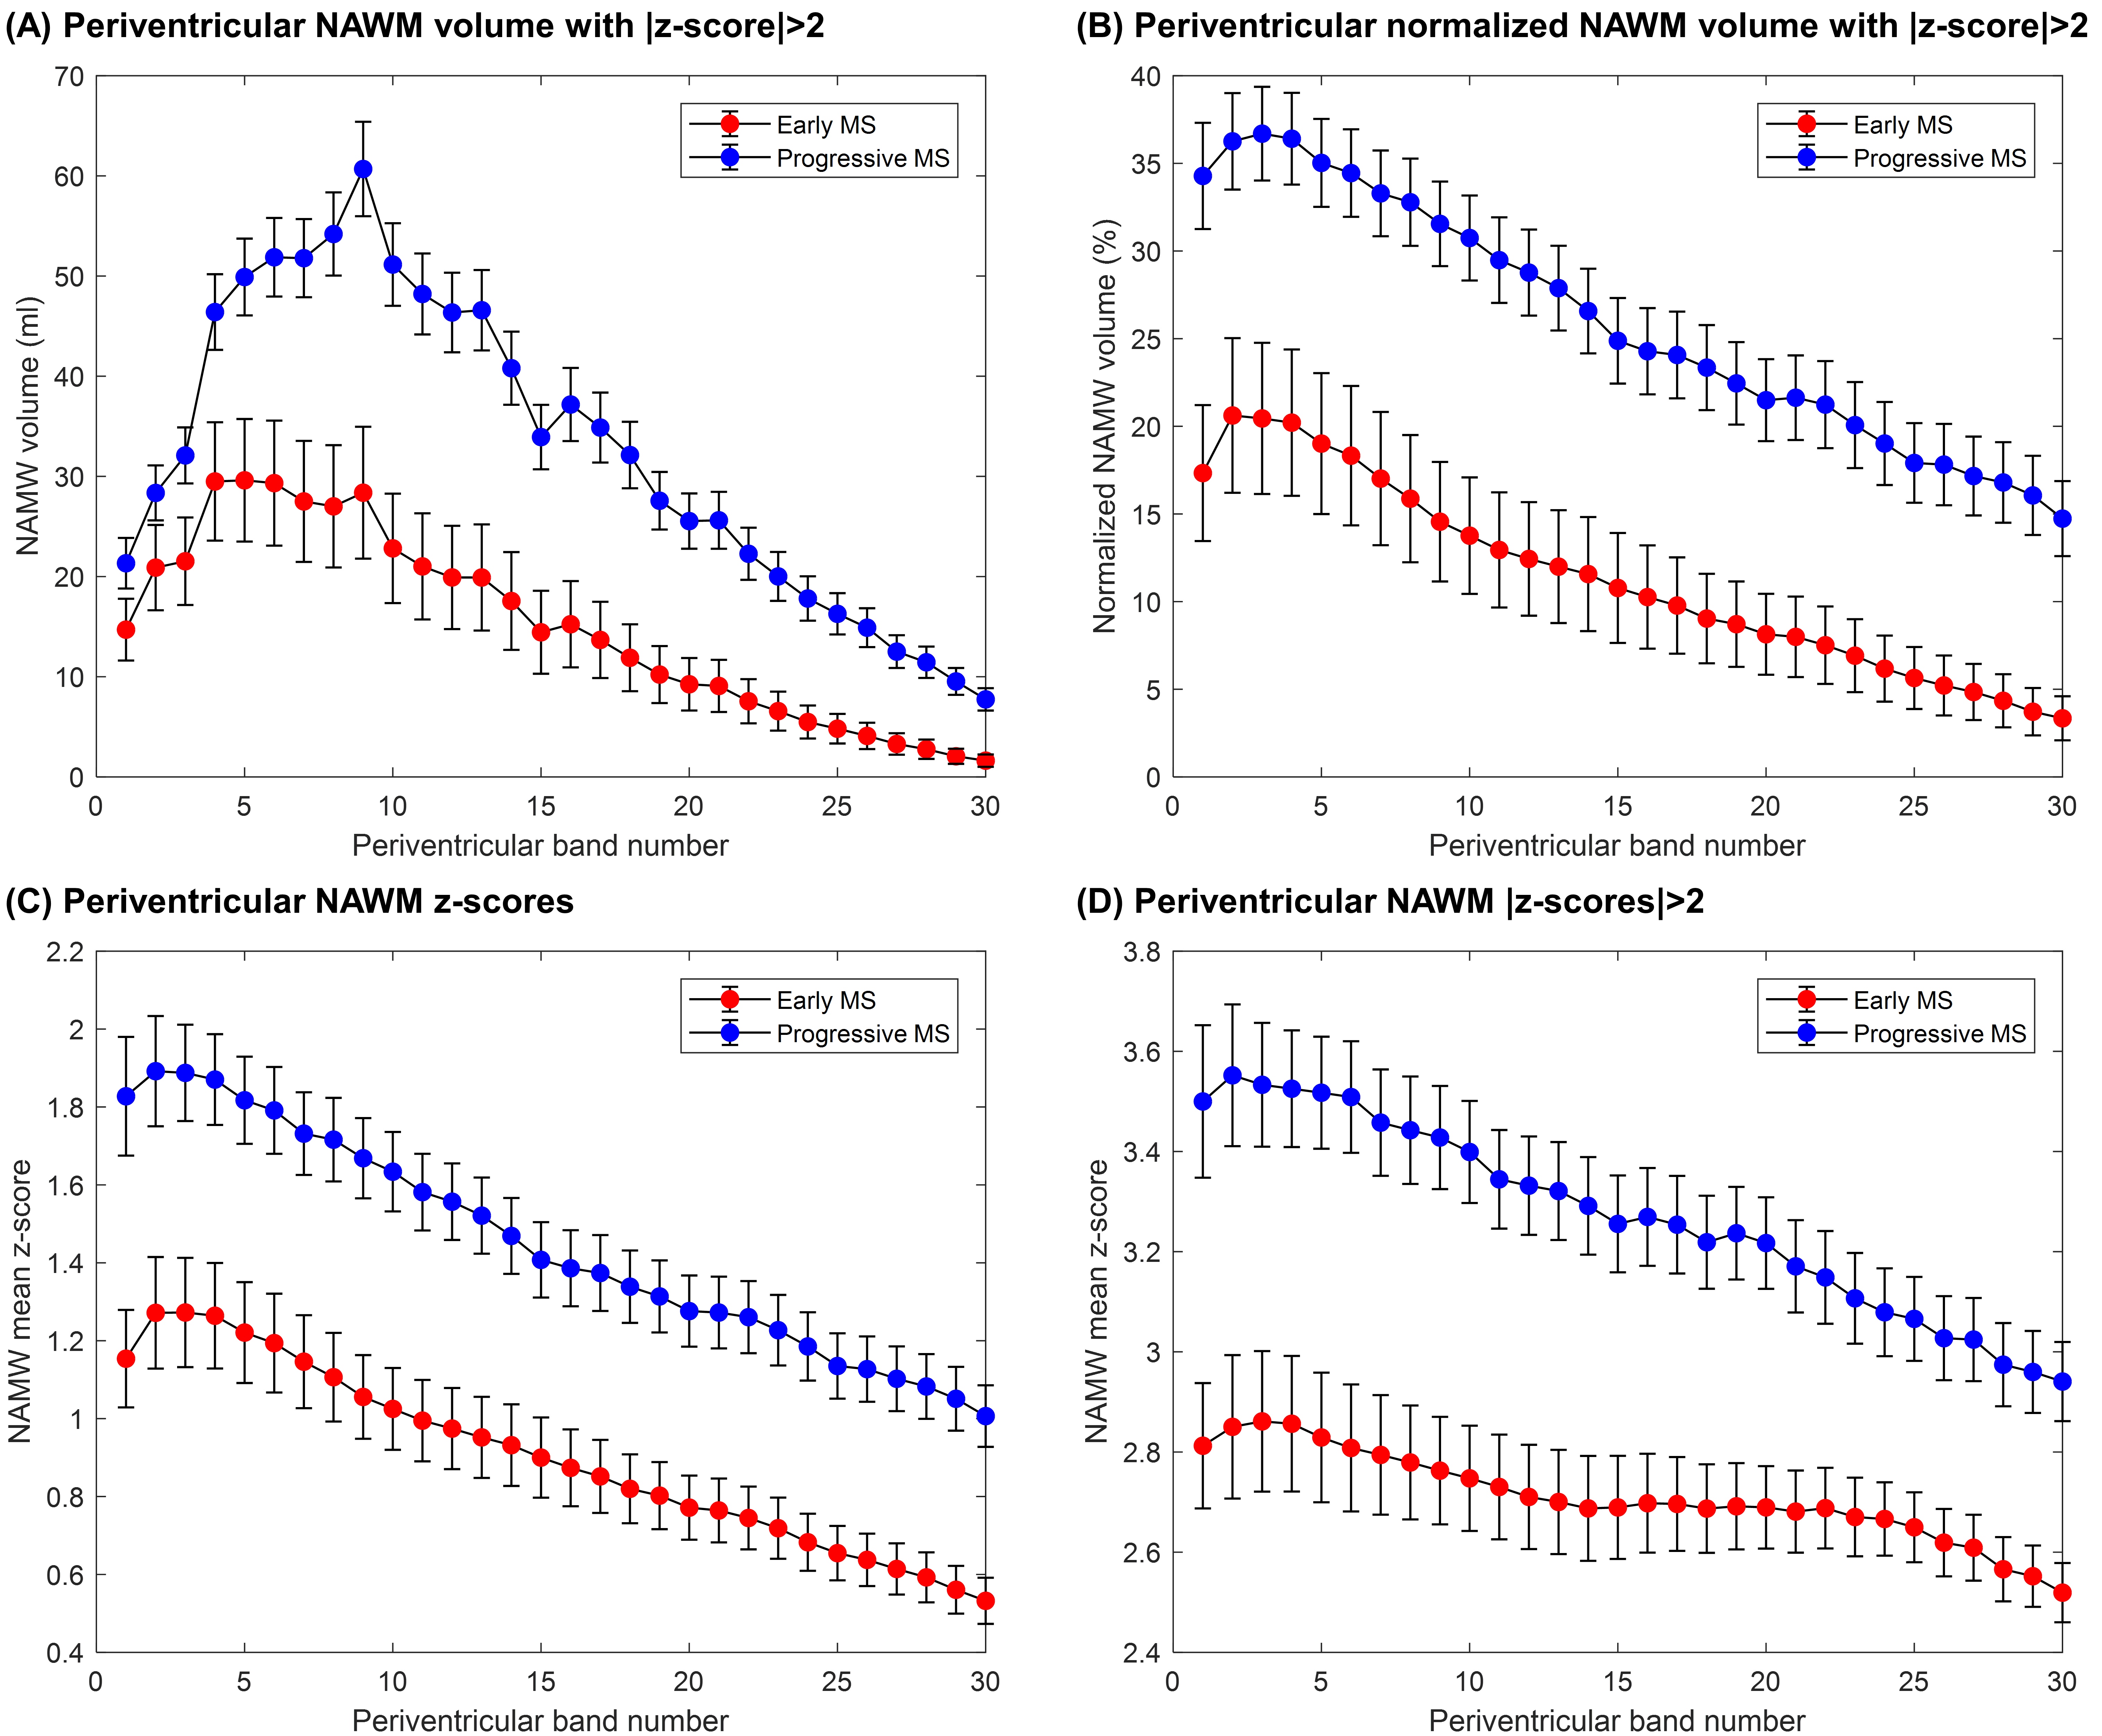
Figure 4. Periventricular gradients of (A) abnormal WM volume (ml) and (B) normalized abnormal WM volume to the total band volume, which were identified as the NAWM voxel exceeding a z-score threshold of 2 (i.e. exceeding the prediction interval at 95% level of confidence of the T1 normative linear model). Periventricular gradients in NAWM of (C) absolute z-scores and (D) absolute z-scores > 2. Error bars indicate two standard errors. Reported values in the first band should be carefully considered as they may be affected by partial-volume effects between CSF and WM tissues.