2791
Tracking longitudinal disease progression of MS during fingolimod therapy using SFCI, a combined structural and functional connectivity metric1Cleveland Clinic Foundation, CLEVELAND, OH, United States
Synopsis
It has been reported that structural and functional connectivity impairment of motor and cognitive network in multiple sclerosis (MS), as measured by diffusion tensor imaging (DTI) and functional connectivity (fcMRI) respectively, stabilize after one year of fingolimod treatment. Structural and functional connectivity index (SFCI), a combined metric of DTI and fcMRI has previously been demonstrated as a sensitive imaging-based measure of progression of MS. Change of (i) motor (ii) cognitive and (iii) pathway combined SFCI were tracked over 2-year fingolimod therapy of MS. SFCI stabilized after one year, which shows its effectiveness to measure disease progression following therapy .
INTRODUCTION
It has recently been reported that structural and functional connectivity impairment of motor and cognitive networks, as measured by diffusion tensor imaging (DTI) and functional connectivity (fcMRI) respectively, stabilize after one year of fingolimod treatment of multiple sclerosis (MS).1 Based on the prior observation of correlated structural and functional connectivity measures in MS,2, 3 a combined structural and functional connectivity metric has previously been demonstrated as a sensitive imaging-based measure of disease progression.4 We have used this combined metric, structural functional composite index (SFCI) incorporating structural and functional connectivity along the motor and cognitive pathways, to follow disease progression during 2-year fingolimod therapy.METHODS
Data Acquisition: Twenty five patients with MS (42.0±8.6 y, 10 male) were scanned following an institutional review board approved protocol at 3T at baseline and 6, 12, 18 and 24 months after start of fingolimod treatment. The whole body Siemens scanner was upgraded from Tim Trio to Prisma (Erlangen, Germany) during the study; the upgrade was associated with a change of receive coil from 12 channel head coil to 20 channel (16 head + 4 spine) coil. DTI was acquired with high angular resolution diffusion imaging protocol (2mm isotropic, 71 diffusion-weighting gradients with b=1000sec/mm2 and 8 b=0 volumes, NEX=4). fcMRI data were acquired with a 2D GRE echoplanar scan (TR/TE=2800/29 ms, 31 slices, slice thickness 4mm, no gap, 128×128 matrix, 256mm × 256mm FOV, bandwidth 1954 Hz/pixel, 6/8 partial Fourier, 137 repetitions). Pulse plethysmograph and respiratory bellow were used to monitor physiologic fluctuations. During fcMRI scans a bite bar was used to minimize motion and all subjects were instructed to keep eyes closed.Data Analysis: DTI and fcMRI data analyses were performed as in literature.1 Structural and functional connectivity along transcallosal sensorimotor pathway (SMC) and right frontoparietal (FP) pathway were measured.
Seed and Target Region Definition: Seed and target for (i) SMC and (ii) FP were defined by (i) left and right primary motor cortices (M1) and (ii) right middle frontal gyrus (rMFG) and right inferior parietal lobule (rIPL) respectively. Seeds and targets were identified using InstaCorr based method5 as in reference.1
Fiber Tracking: Data analysis consisted of (i) motion correction,6 (ii) voxel by voxel tensor calculation accounting for noise floor correction,7 (iii) fiber orientation distribution8 calculation for probabilistic tractography.2
Functional Connectivity: Data analysis consisted of (i) calculation of a reference timeseries from the arithmetic mean of nine pixels centered on the seed voxel, (ii) creation of a whole-brain correlation map from cross-correlation between the reference timeseries and linearly detrended timeseries of each voxel, (iii) conversion of the correlation to Student’s t, (iv) normalization of the Student’s t distribution to zero mean and unit variation9 to generate a whole-brain z-scored connectivity map, and (v) calculating the mean correlation within the seed voxel to get fc.
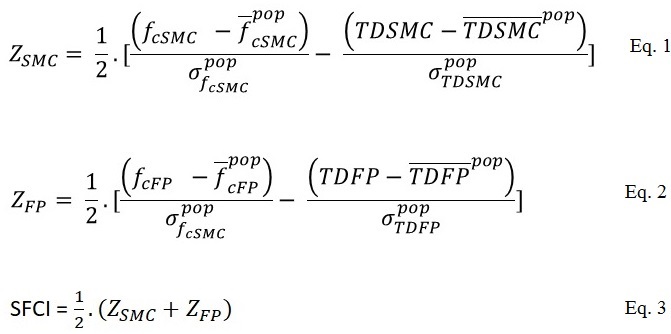
SFCI: SFCI was constructed as described in literature,4 by summing z-scored measures of pathway specific DTI and fcMRI. Transverse diffusivity, TD, the most relevant DTI metric in MS,10, 11 was used as measure of structural connectivity.
Motor, cognitive and combined SFCI measures: These were calculated following Eqs. 1 and 2 (ZSMC and ZFP respectively, Fig. 1). Mean and standard deviations of population/sample fc and TD (for both SMC and FP) were obtained from 17 healthy control scans at 3T performed at the same center. A combined SFCI was finally calculated by combining motor and cognitive SFCI measures following Eq. 3 (Fig. 1). Analyses of SFCI measures across time were done using a fixed effect covariate model in R (3.6.0) was used to estimate the variables at different time-points after accounting for scanner upgrade. p < 0.05 was considered as statistically significant.
RESULTS AND DISCUSSION
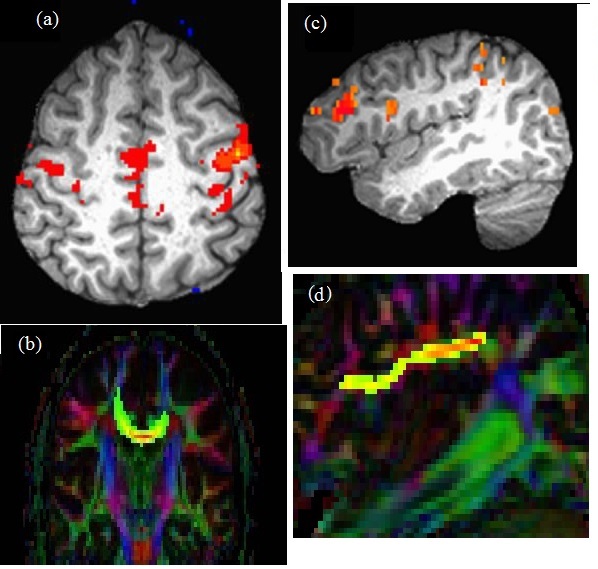
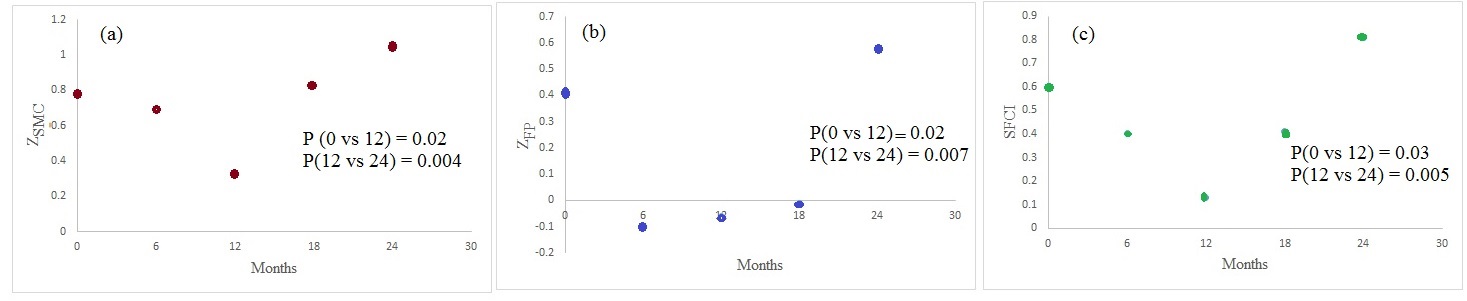
Representative images of single subject fcMRI maps fiber tracking images are shown in Fig. 2. The combined structural and functional connectivity along motor and cognitive pathways, and a pathway-combined SFCI at baseline, 6, 12, 18 and 24 months of fingolimod therapy are shown in Figs. 3(a), (b) and (c) respectively. By formulation, lower SFCI implies worsening of network integrity /disease condition. As can be seen from Fig. 3, SFCI decreases significantly in the 1st year and then increases, suggesting improvement in pathway specific and combined network integrity after 1st year of fingolimod therapy. This observation is in agreement with that reported from fcMRI and DTI measures previously. 1CONCLUSION
Motor and cognitive as well as their combined structural and functional network integrity in MS improves after 1st year of treatment with fingolimod. SFCI is a quantitative and sensitive measure of disease progression in MS in a population with clinical intervention.Acknowledgements
This work was supported by funding from Novartis, National Institutes of Health, National Multiple Sclerosis Society. We thank Thorsten Feiweier of Siemens Healthineers for developing the DTI pulse sequence and the monopolar+ functionality that was used in this study.References
1. Bhattacharyya PK, Lowe MJ, Sakaie KE, Li H, Lin J, Fox RJ. Changes in structural and functional connectivity during two years of fingolimod therapy for multiple sclerosis. Magn Reson Imaging. 2020;74:113-120.
2. Lowe MJ, Beall EB, Sakaie KE, Koenig KA, Stone L, Marrie RA, Phillips MD. Resting state sensorimotor functional connectivity in multiple sclerosis inversely correlates with transcallosal motor pathway transverse diffusivity. Hum Brain Mapp. 2008;29(7):818-827.
3. Lowe MJ, Koenig KA, Beall EB, Sakaie KA, Stone L, Bermel R, Phillips MD. Anatomic connectivity assessed using pathway radial diffusivity is related to functional connectivity in monosynaptic pathways. Brain Connect. 2014;4(7):558-565.
4. Lowe MJ, Koenig KA, Beall E, Lin J, Sakaie KE, Srone L, Phillips MD. Combined Anatomic and Functional Connectivity Metric for Tracking Disease Progression in MS. Proc. Intl. Soc. Mag. Reson. Med. 2016;24:4053.
5. Cox R, Saad Z. InstaCorr in AFNI and SUMA. Second Biennial International Conference on Resting-State Functional Brain Connectivity. Milwaukee, WI; 2010.
6. Sakaie KE, Lowe MJ. Quantitative assessment of motion correction for high angular resolution diffusion imaging. Magn Reson Imaging. 2010;28(2):290-296.
7. Sakaie K, Lowe M. Retrospective correction of bias in diffusion tensor imaging arising from coil combination mode. Magn Reson Imaging. 2017;37:203-208.
8. Sakaie KE, Lowe MJ. An objective method for regularization of fiber orientation distributions derived from diffusion-weighted MRI. Neuroimage. 2007;34(1):169-176.
9. Lowe MJ, Mock BJ, Sorenson JA. Functional connectivity in single and multislice echoplanar imaging using resting-state fluctuations. Neuroimage. 1998;7(2):119-132.
10. Bhattacharyya PK, Fox R, Li H, Lin J, Sakaie KE, Lowe MJ. Evolution of functional and structural connectivity of motor network during 2 years of fingolimod therapy for multiple sclerosis. Proc. Intl. Soc. Mag. Reson. Med. 2018;26:1982.
11. Lowe MJ, Horenstein C, Hirsch JG, Marrie RA, Stone L, Bhattacharyya PK, Gass A, Phillips MD. Functional pathway-defined MRI diffusion measures reveal increased transverse diffusivity of water in multiple sclerosis. Neuroimage. 2006;32(3):1127-1133.
Figures