2787
Optimization of ROI sampling strategies for proton density fat-fraction MRI of hepatic steatosis before liver transplantation in ex vivo
Gen Chen1, Weiyin Vivian Liu2, Hao Tang1, Lifen Zhou1, Daoyu Hu1, and Zhen Li1
1Tongji Hospital, Tongji Medical College, Huazhong University of Science and Technology, Wuhan, China, 2MR Research, GE Healthcare, Beijing, China, Beijing, China
1Tongji Hospital, Tongji Medical College, Huazhong University of Science and Technology, Wuhan, China, 2MR Research, GE Healthcare, Beijing, China, Beijing, China
Synopsis
This study aims to determine sampling strategy (SS) with the fewest regions of interest (ROIs) that could diagnose hepatic steatosis (HS) as reliably as the 9-ROI strategy before liver transplantation in ex vivo. All strategies with ≥5 ROIs had an intraclass correlation coefficients(ICC) ≥ 0.995 and limit of agreement (|LOA|)≤ 1.5%. The average proton density fat-fraction (PDFF) was moderately correlated with the histological diagnosis. The 5-ROI SS obtains similar PDFF results as the 9-ROI strategy before liver transplantation in ex vivo. After further verification, this method may become an available standard to assess HS before liver transplantation in ex vivo.
Introduction and Purpose
Hepatic steatosis (HS) comprises various diseases, was characterized by the accumulation of triglycerides in the cytoplasm of hepatocytes, and is a common observation in the world. The increasing prevalence of HS reflects the frequency of liver transplantation due to insufficient supplies of donor organs and the use of marginal donors. HS is a critical risk factor during and after liver surgery and is associated with a poor prognosis after transplantation accurately. This study aims to explore sampling strategy (SS) with the fewest ROIs that could obtain diagnosis of hepatic steatosis as reliable as the 9-ROI strategy before liver transplantation in ex vivo.Materials and Methods
This was a retrospective analysis of a prospective study involving 35 livers with histopathological steatosis that underwent 3T PDFF-MRI in ex vivo. One ROI of 1 cm2 was selected for each hepatic segment, and any combination of ROIs in 1–8 liver segments was used, resulting in 511 combinations. Using ICCs and Bland-Altman analyses, the PDFFs of all these combinations were compared with the average 9-ROI PDFF. Lobar and segmental PDFFs were also compared. Statistical analyses were conducted with R platform software (version 3.6.1; R Foundation for Statistical Computing, Vienna, Austria; https://www.r-project.org/).Results
The average 9-ROI PDFF of all livers was 4.07±4.35% (0.870–20.904) (Fig. 1 and 2). The highest mean PDFF value (4.35%) in segment III was 0.28% higher than the average 9-ROI one. The lowest mean PDFF value (3.78%) in segment II was 0.29% less than the average 9-ROI one. All strategies with ≥5 ROIs had an ICC ≥ 0.995 and |LOA|≤ 1.5%. Overall, 54 of 84 (67.5%) 3-ROI SSs had an ICC ≥ 0.995, and 70 of 84 (70%) had an |LOA|≤ 1.5%. A total of 111 of 126 (88.1%) 4-ROI SSs had an ICC ≥ 0.995, and 125 of 126 (99.2%) had an |LOA| ≤ 1.5% (Fig. 3 and 4). The average PDFF was moderately correlated with the histological diagnosis (R = 0.47, P = 0.004) (Fig. 5).Discussion and conclusions
The heterogeneity in the distribution of fat deposits in the liver. Different ROI selection in the organ may result in differences in fat quantification. A common method is to place one ROI in each hepatic segment. The number of ROIs has the most significant impact on the time required for image analysis. The increasing number and size of ROIs result in a higher time burden for radiologists to measure liver PDFF. Our study showed that five ROIs are the minimum required number to retain measurement accuracy and achieve similar PDFF results as the 9-ROI strategy in the ex vivo assessment of HS before liver transplantation. Further verification is necessary, and this method may become an available standard to assess HS before liver transplantation in ex vivo.Acknowledgements
This work was supported by the National Natural Science Foundation of China (No. 81771801).References
No reference found.Figures
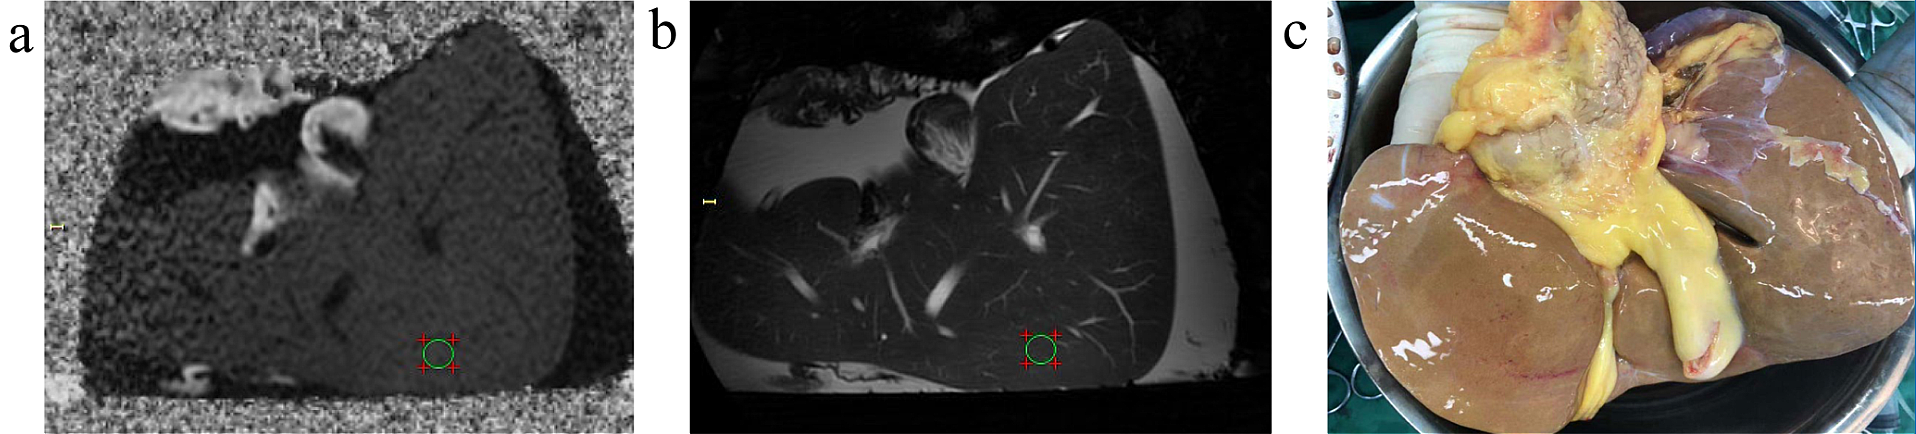
Fig. 1
Representative images of one donor’s liver in this study. (a) An ROI of the
liver on the FatFrac image; (b) An ROI of the liver on a T2-weighted image; (c)
Traditional visual inspection of the liver.
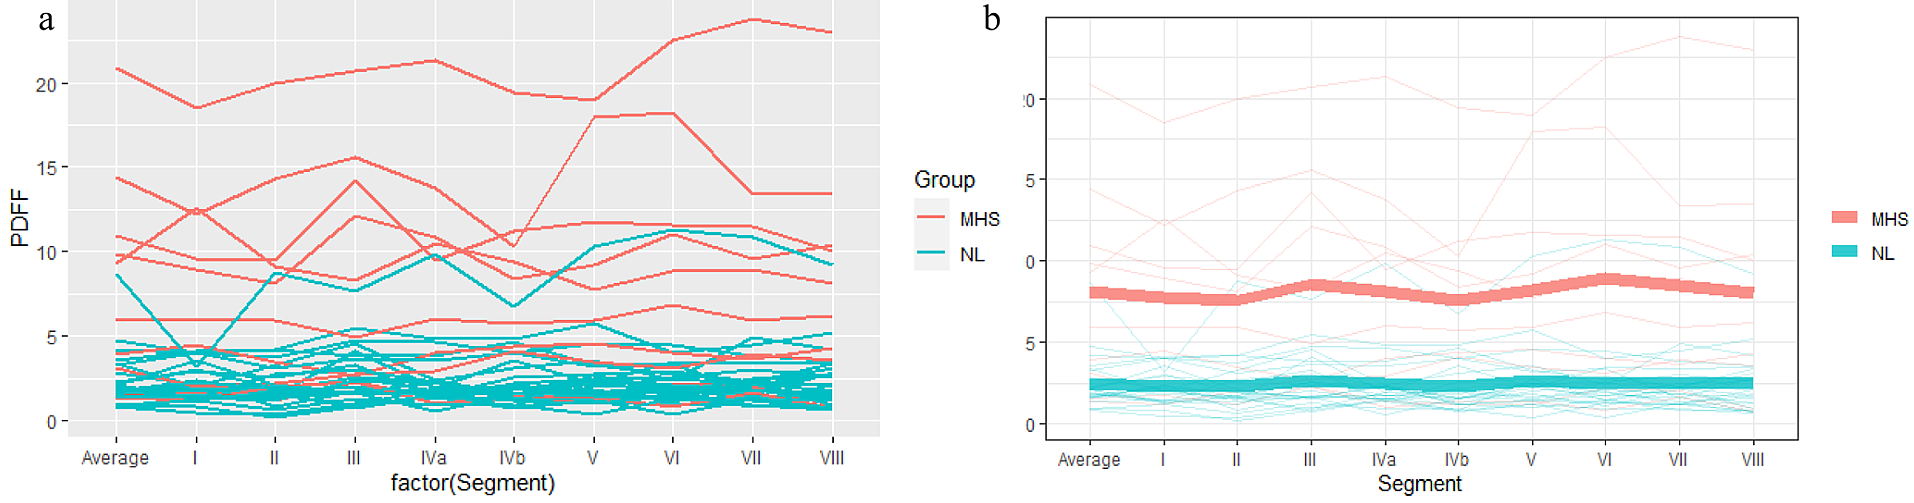
Fig. 2
Plots of the proton density fat-fraction values (y-axis) against the segments
(x-axis) for this study cohort of 35 livers. (a) Each line represents an
individual liver; (b) The thick line represents the average PDFF for each group.
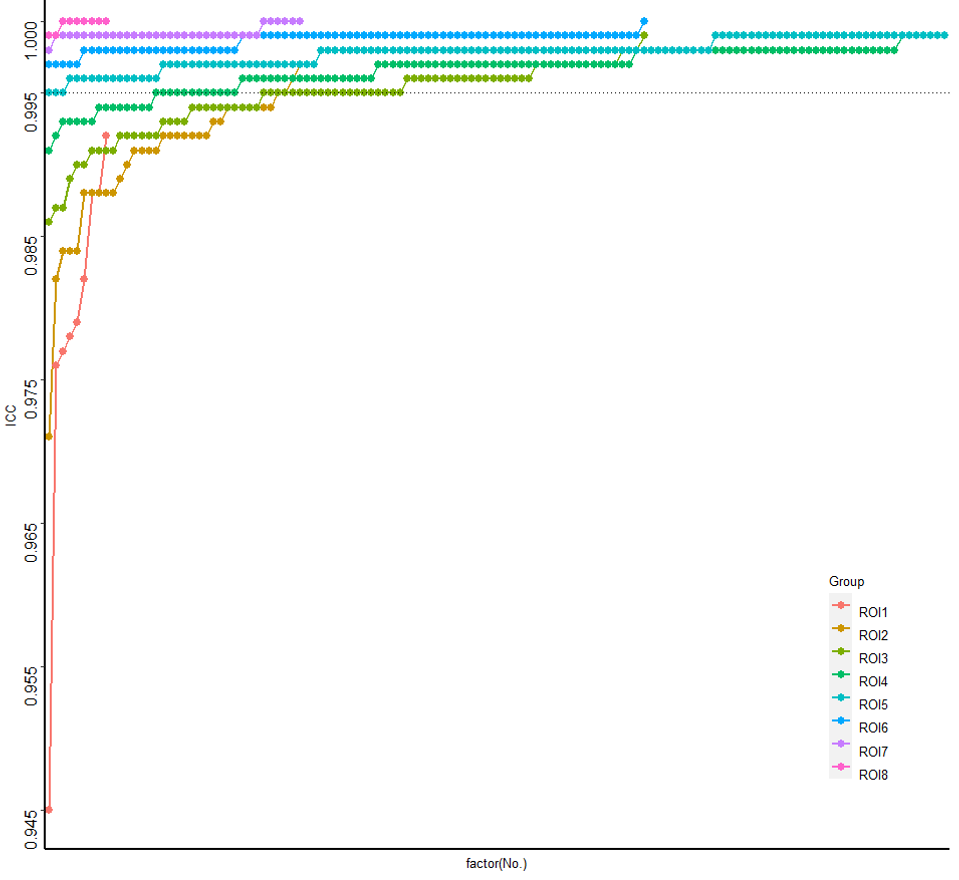
Fig. 3
The intraclass correlation coefficients (ICCs) (y-axis) for the different
sampling strategies in relation to the number of ROIs (y-axis). Each dot
represents a particular sampling strategy (511 in total). The ICC increased
with the number of ROIs.
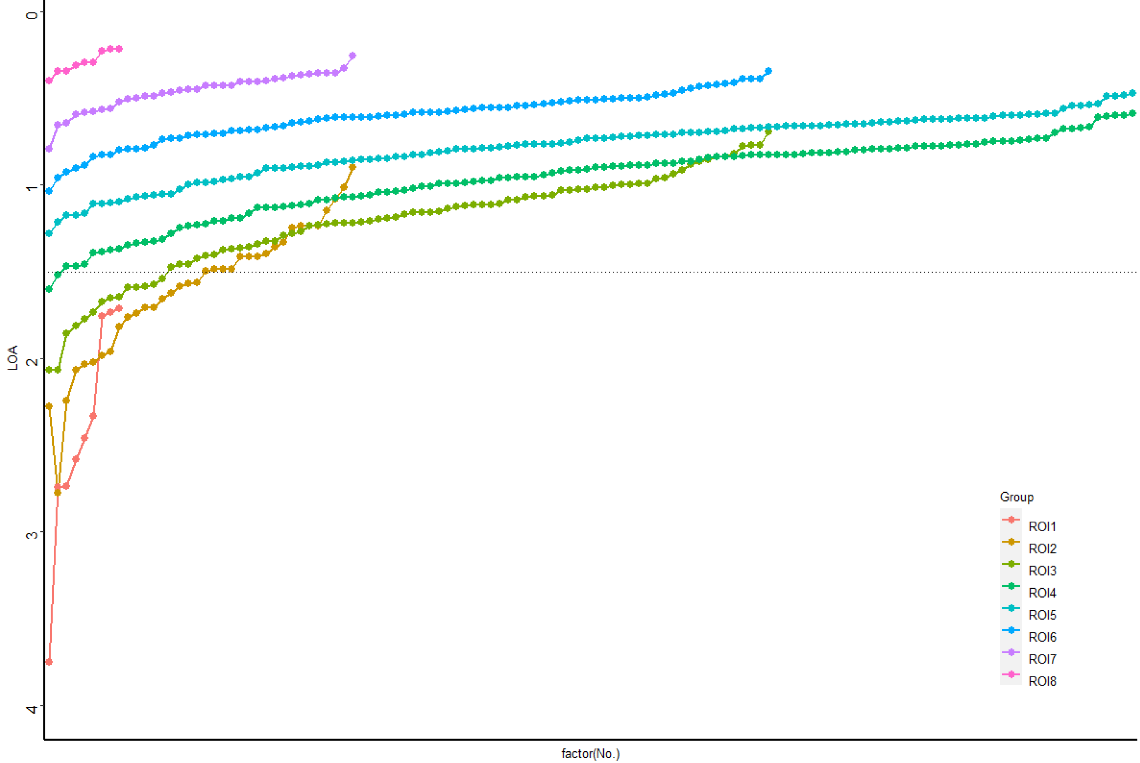
Fig. 4
Level of agreement (LOA) bounds (y-axis) for the different sampling strategies
by the number of regions of interests (ROIs). Each dot represents a particular
sampling strategy (511 in total). The LOA decreased as the number of ROIs per
strategy increased.
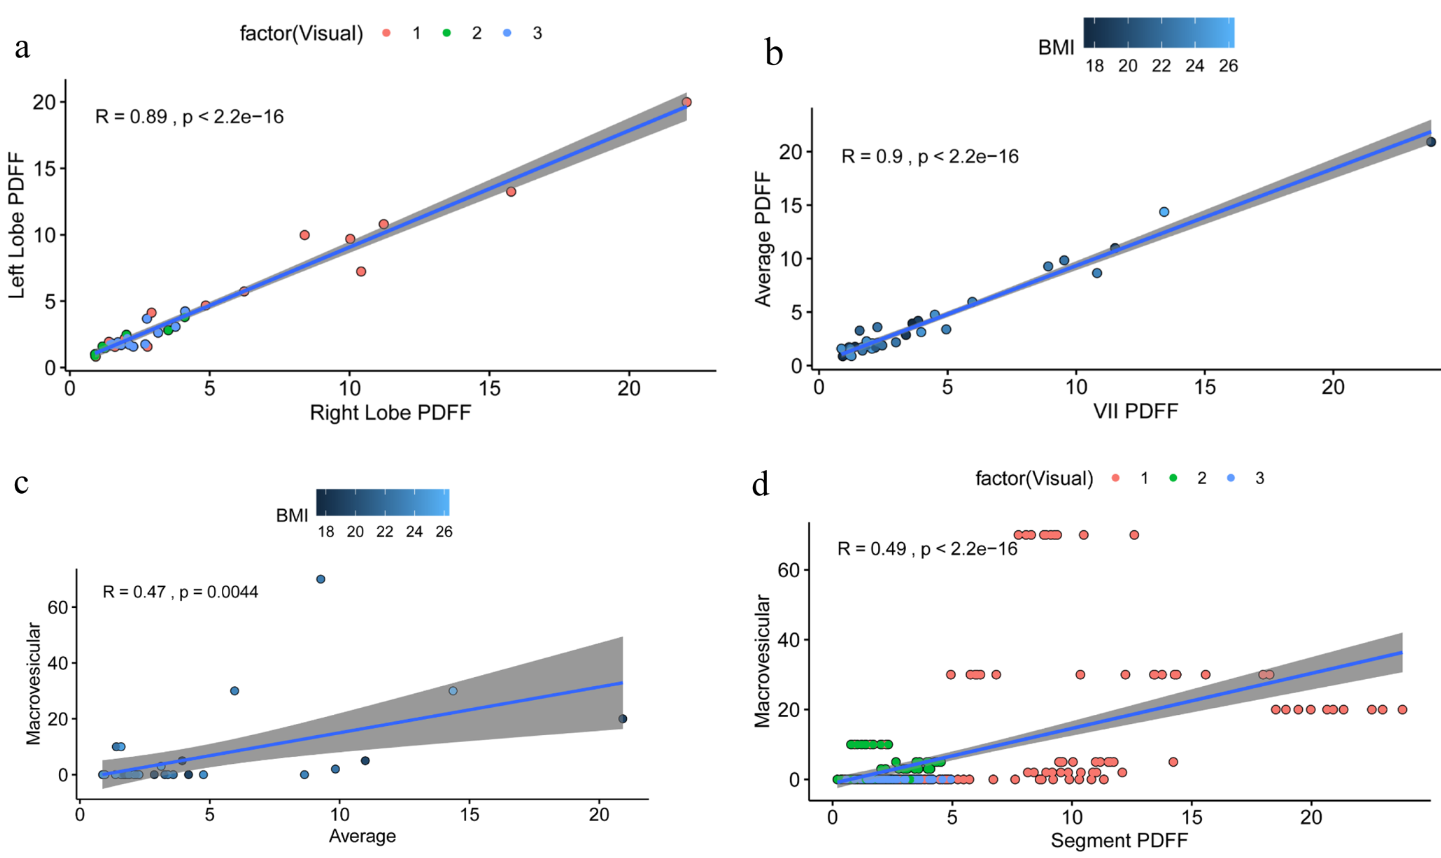
Fig. 5 Relationship between of the proton density
fat-fraction values (PDFF) of segments and histology results. (a) Right-lobe
PDFF showed a strong correlation with left-lobe PDFF (R = 0.89, P < 0.001); (b) Segment VII PDFF
showed a very strong correlation with the average PDFF (R = 0.9, P < 0.001); (c) A moderate
correlation was found between the average PDFF and the histological findings (R
= 0.47, P = 0.004). (d) Segment PDFF
showed a moderate correlation with the histological findings (R = 0.49, P < 0.001).