2786
Increased Hepatic FDG Uptake in Patients with Metabolic Associated Fatty Liver Disease on PET/MR
Zhaoting Meng1, Gang Feng1, Mingxiang Sun1, Liling Peng1, Min Zhu1, Mu Lin2, and Xin Gao1
1Shanghai Universal Medical Imaging Diagnostic Center, Shanghai, China, 2MR Collaboration, Diagnostic Imaging, Siemens Healthineers Ltd., Shanghai, China
1Shanghai Universal Medical Imaging Diagnostic Center, Shanghai, China, 2MR Collaboration, Diagnostic Imaging, Siemens Healthineers Ltd., Shanghai, China
Synopsis
Globally, nonalcoholic associated fatty liver (NAFLD) is the predominant chronic liver disease, and it correlates to metabolic syndrome and type 2 diabetes, leading to cardiac and cerebral arteriosclerosis. In 2020, metabolic associated fatty liver disease (MAFLD) was newly defined to clarify the pathogenic mechanisms of this disease and to better guide clinical treatment. We hypothesized that with MAFLD, previously contradictory imaging results could be better explained. Liver MRS and FDG PET imaging were conducted simultaneously on an integrated PET/MR platform, which improved data accuracy. The study also analyzed whether the liver could be used as a reference tissue for PET imaging.
INTRODUCTION
Previous studies found that fatty liver disease (FLD) and blood glucose (BG) may affect fluorodeoxyglucose (FDG) accumulation in the liver, which is often used as a reference tissue for semi-quantitative assessment, but the data are not consistent or somewhat controversial1-3. The purpose of this study was to evaluate hepatic FDG uptake with integrated PET/MR in the scope of metabolic associated fatty liver disease (MAFLD) which has been newly re-defined.METHODS
From July to September 2020, a total of 217 patients (136 males and 81 females) were evaluated on an integrated PET/MRI scanner (Biograph mMR, Siemens Healthcare, Erlangen, Germany). Besides whole-body imaging, the liver was scanned using a single-voxel MR spectroscopy sequence (HISTO, the LiverLab package, Siemens Healthcare, Erlangen, Germany). Before the examination, the patients were fasting for at least 6 hours, height, weight, and blood glucose (BG) were routinely measured, and blood biochemical tests, including triglycerides, HbA1c, and HDL were performed. Fourteen cases were excluded due to breath-holding failure, and a total of 203 cases were included in the study. PDFF and R2 water was given by HISTO from an ROI of 3 cm2 on the right liver lobe. Within a similar region, maximum and mean SUVs (corrected for both body weight [SUV] and lean body mass [SUL]) were measured (Figure 1).RESULTS
Body mass index (BMI) was significantly positively correlated with BG, PDFF, and R2 water (r=0.17, 0.42, 0.26, respectively. p=0.016, 0.000, 0.000, respectively). There was also a significantly positive correlation between BG and PDFF (r=0.2, p=0.004). (Figure 2)Hepatic steatosis was diagnosed using PDFF ≥5%4. In total, 118 of 203 patients were diagnosed as having FLD (58.1%). When grouped by PDFF (normal[PDFF < 5%], mild fatty liver[5% ≤ PDFF < 15%], moderate to severe fatty liver[PDFF ≥ 15%]), only the normal and the moderate to severe fatty liver groups showed statistically significant differences in SUVmax (p=0.024). (Figure 3)
According to the diagnostic criteria for MAFLD5, 109 patients were diagnosed as having MAFLD (53.7%). Compared with the non-MAFLD group, SUVmax, SUVmean, SULmax, and SULmean were all higher in the MAFLD group, and there were statistically significant differences in SUVmax and SUVmean (p=0.005, 0.032, respectively). (Figure 4)
DISCUSSION
Overweight, hyperglycemia, fatty liver disease, and other metabolic factors are related to each other. Hyperglycemia and overweight can lead to liver steatosis, along with iron deposition, suggesting the underlying process of inflammatory liver disease6. Compared with FLD, MAFLD suggested that traditional liver damaging factors such as obesity, metabolic disorders, insulin resistance, and alcohol abuse have synergistic effects on the liver5. The results showed that these factors may work together to affect FDG uptake in the liver. Hepatic SUV is more influenced by MAFLD than by FLD. Previous studies have found that liver fat deposition decreases FDG clearance rate. One alternative explanation can be the inflammation caused by hepatic steatosis. Inflammatory cells such as macrophages are metabolically active and may have a relatively low glucose-6-phosphatase levels compared with hepatocytes7. In addition, insulin resistance is one of the causes of FLD8. Associated hyperglycemia causes FDG redistribution. FDG and glucose compete with each other for organ clearance, so the FDG blood concentration and tissue uptake is determined by the blood glucose level.CONCLUSION
MAFLD is a more meaningful disease concept for clinical diagnosis and treatment strategies. The use of the liver as a reference tissue in the background of MAFLD should be done with caution.Acknowledgements
We acknowledge the support for this work from Shanghai Municipal Commission of Economy and Informatization Special Fund for Artificial Intelligence Innovation and Development (2019-RGZN-01079) and Scientific Research Subjects Fund of Shanghai Universal Medical Imaging Technology Limited Company (UV2020Z02).References
- Dunford A, Keramida G, Singh N, et al. Relationship between regional hepatic glucose metabolism and regional distribution of hepatic fat. Nucl Med Commun. 2019;40(3):212-218.
- Keramida G, Potts J, Bush J, et al. Hepatic steatosis is associated with increased hepatic FDG uptake. Eur J Radiol. 2014;83(5):751-755.
- Pak K, Kim SJ, Kim IJ, et al. Hepatic FDG Uptake is not Associated with Hepatic Steatosis but with Visceral Fat Volume in Cancer Screening. Nucl Med Mol Imaging. 2012;46(3):176-181.
- Zhao YZ, Gan YG, Zhou JL, et al. Accuracy of multi-echo Dixon sequence in quantification of hepatic steatosis in Chinese children and adolescents. World J Gastroenterol. 2019;25(12):1513-1523.
- Eslam M, Newsome PN, Sarin SK, et al. A new definition for metabolic dysfunction-associated fatty liver disease: An international expert consensus statement. J Hepatol. 2020;73(1):202-209.
- Marchisello S, Di Pino A, Scicali R, et al. Pathophysiological, Molecular and Therapeutic Issues of Nonalcoholic Fatty Liver Disease: An Overview. Int J Mol Sci. 2019;20(8):1948.
- Keramida G, Potts J, Bush J, et al. Accumulation of (18)F-FDG in the liver in hepatic steatosis. AJR Am J Roentgenol. 2014;203(3):643-648.
- Chalasani N, Younossi Z, Lavine JE, et al. The diagnosis and management of nonalcoholic fatty liver disease: Practice guidance from the American Association for the Study of Liver Diseases. Hepatology. 2018;67(1):328-357.
Figures
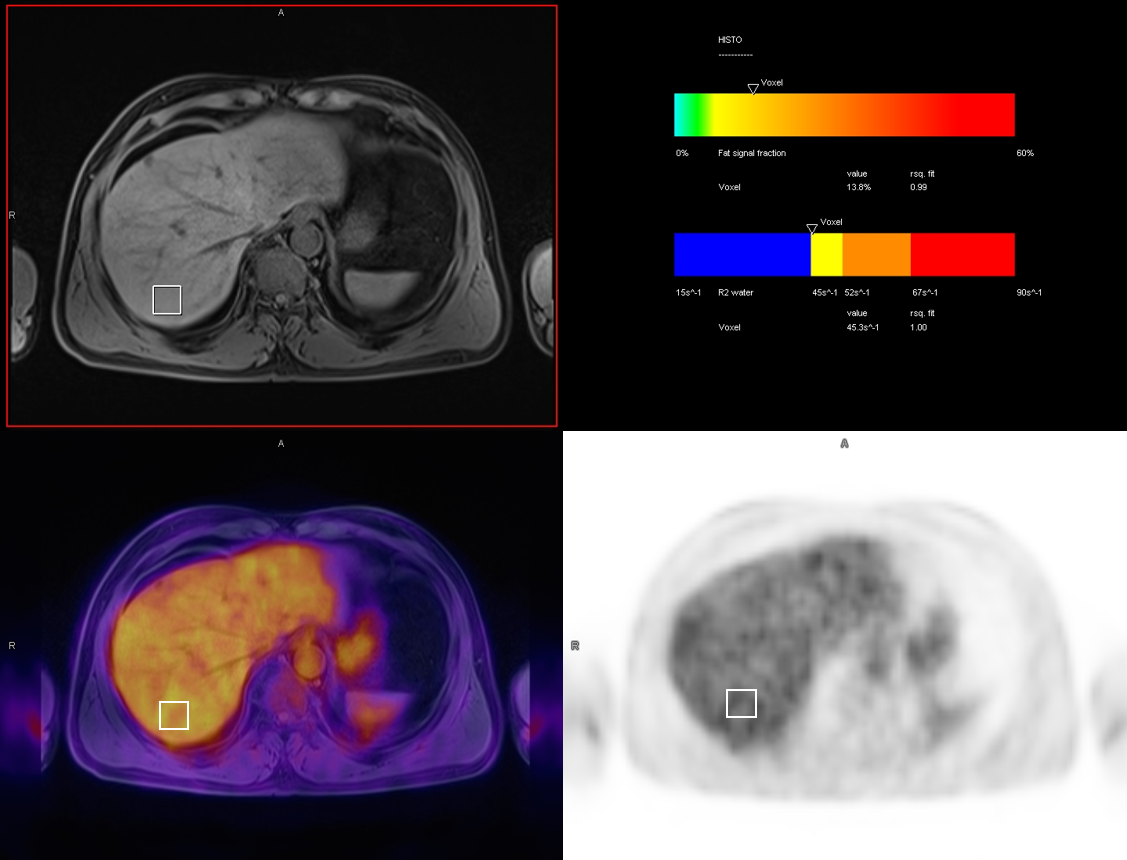
Figure 1. Male patient, 58
years old. PDFF and R2 water was given by HISTO from an ROI of 3 cm2
on the liver right lobe. Within a similar region, SUVs were measured.
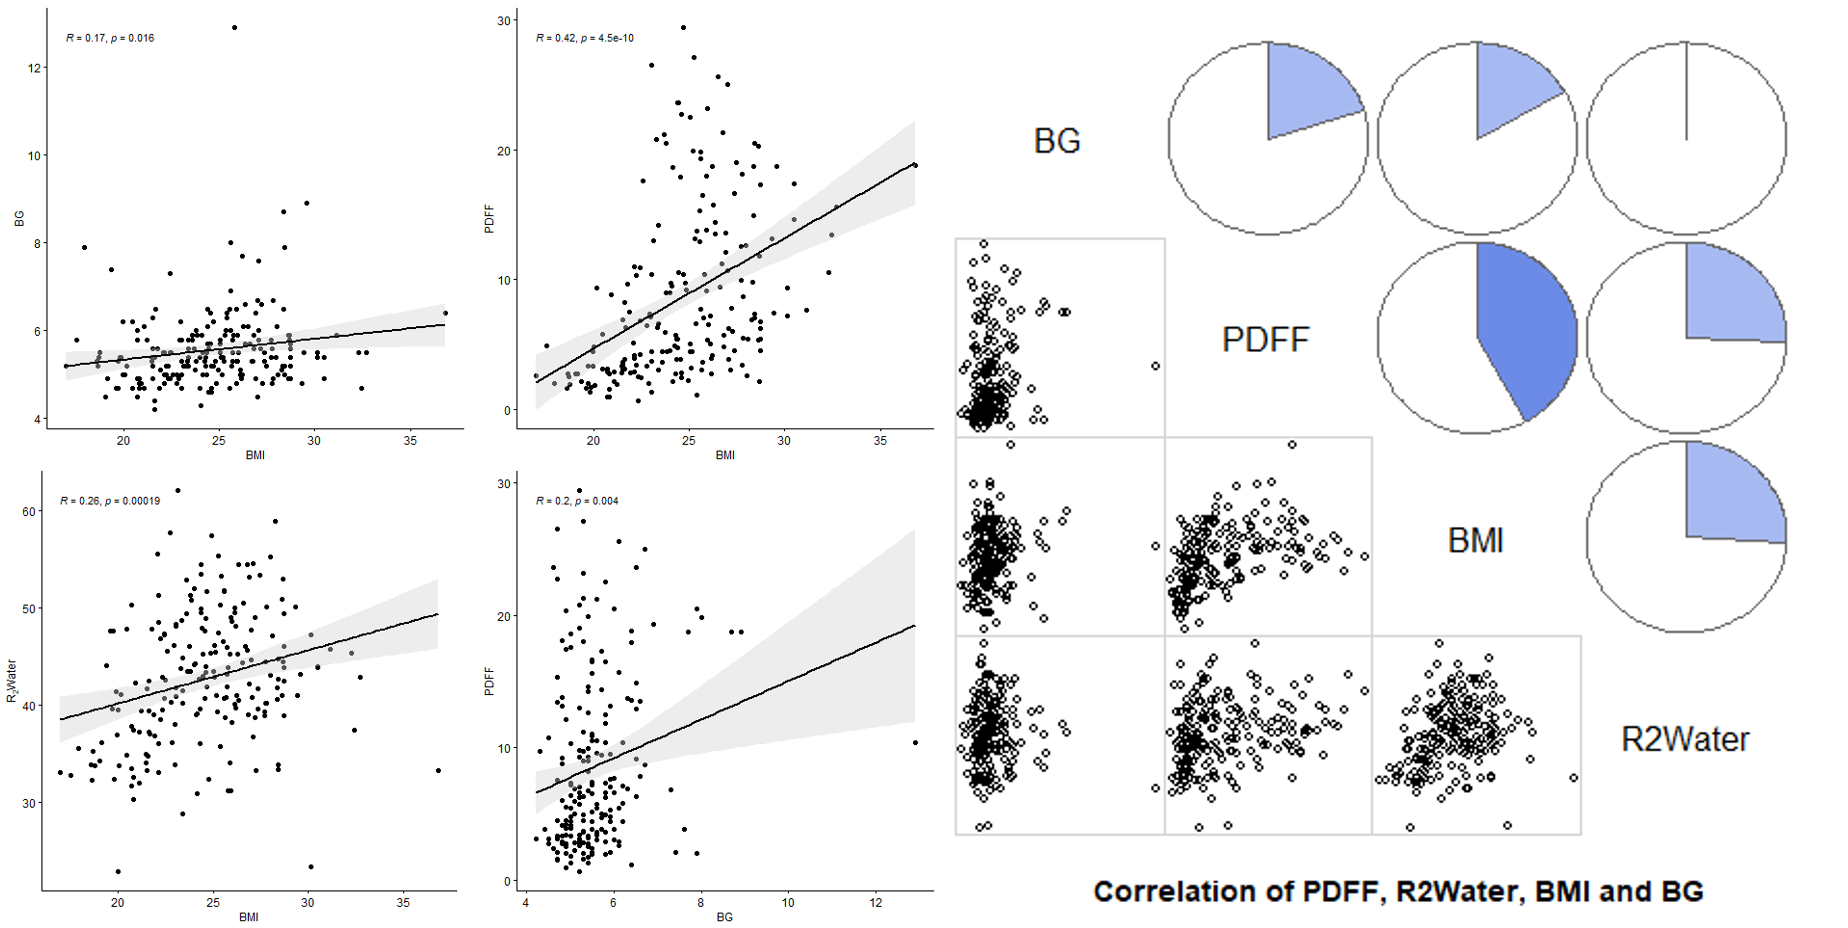
Figure 2. BMI was significantly
positively correlated with BG, PDFF, and R2 water (r=0.17, 0.42,
0.26, respectively. p=0.016, 0.000, 0.000, respectively). There was also a
significantly positive correlation between BG and PDFF (r=0.2, p=0.004).
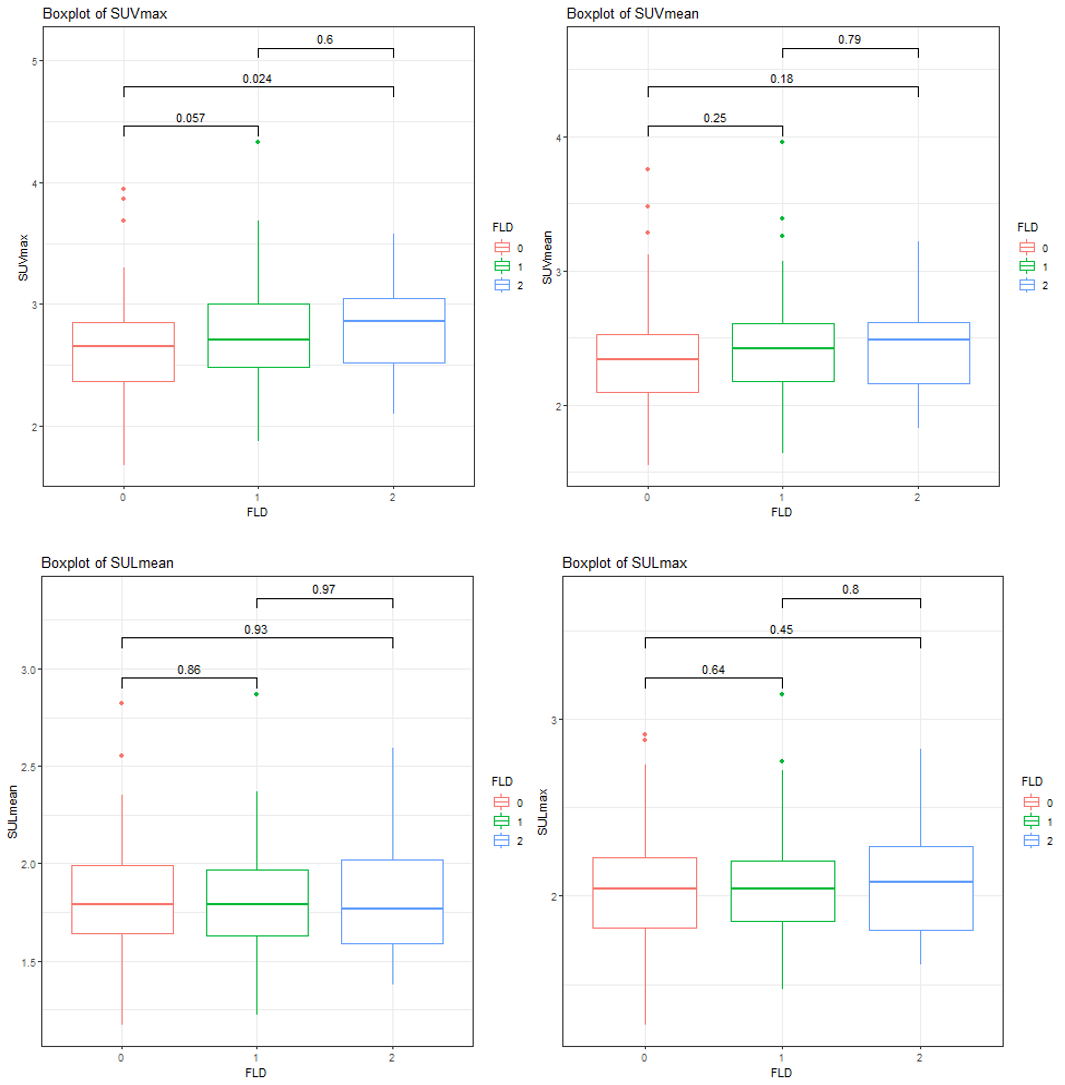
Figure 3. FLD 1 = normal [PDFF < 5%], FLD 2
= mild fatty liver [5% ≤
PDFF < 15%], FLD 3 = moderate to severe fatty liver [PDFF ≥ 15%]. Normal group and
the moderate to severe fatty liver group showed statistically significant
differences in SUVmax (p=0.024).
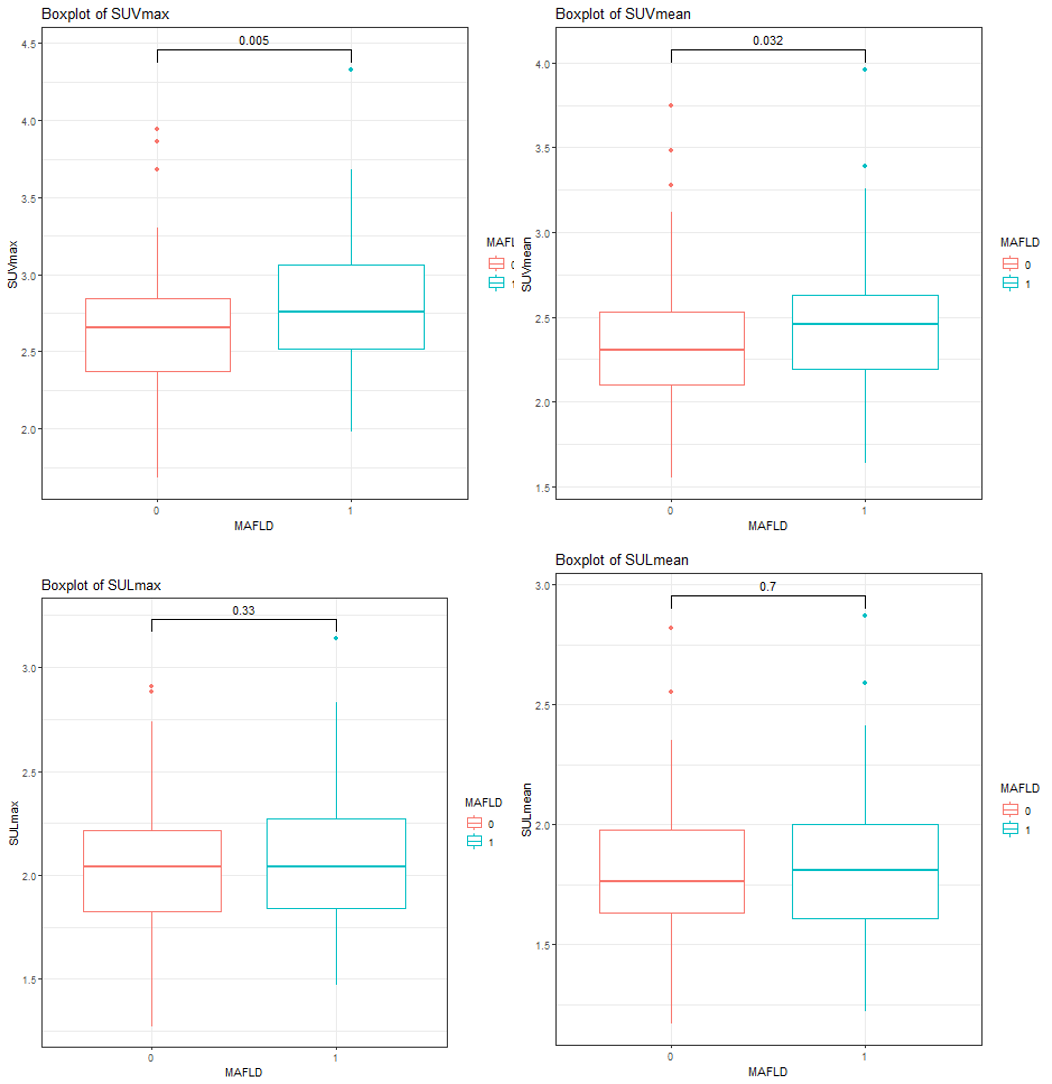
Figure
4. MAFLD 1 = non-MAFLD, MAFLD 2 = MAFLD.
SUVmax, SUVmean, SULmax, and SULmean
were all higher in the MAFLD group, and there were statistically significant
differences in SUVmax and SUVmean between the two groups (p=0.005,
0.032, respectively).