2785
Qualitative Assessment of Hepatic Fat and Iron as a Screening Method1Radiology, University of Washington, Seattle, WA, United States
Synopsis
Qualitative assessment of hepatic fat and iron from three radiologists were compared to the quantitative measurements from the mDIXON-quant sequences. There was a robust correlation providing support for the ability to use qualitative assessment to screen patients on routine abdominal MRI exams and recommend further evaluation with specialized quantitative sequences.
Introduction
The prevalence of chronic liver disease has increased in recent times1. Two of the most common disease processes leading to chronic liver disease are steatosis and hemochromatosis/hemosiderosis. Often, these diseases go unnoticed for years, until the patient develops cirrhosis, or other symptoms of chronic liver disease. Additionally, patients with non-alcoholic fatty liver disease (NAFLD) are also at risk for HCC and any patients that have progressed to advanced fibrosis or cirrhosis, including those with a history of chronic steatosis or iron deposition, are at risk for HCC as well2. Because of this, it is imperative to diagnose these patients early in the disease process to improve outcomes. Recent advancements in MRI have allowed for the development of sequences which can accurately quantify hepatic fat content through proton density fat fraction (PDFF) and the presence of hepatic iron, via T2* decay3,4. However, most MRI examinations of the abdomen still do not include these sequences routinely. The purpose of this work is to examine if qualitative assessment of hepatic iron and fat content from conventional MRI sequences can be accurate enough as a screening assessment in comparison to quantitative MRI methods.Methods
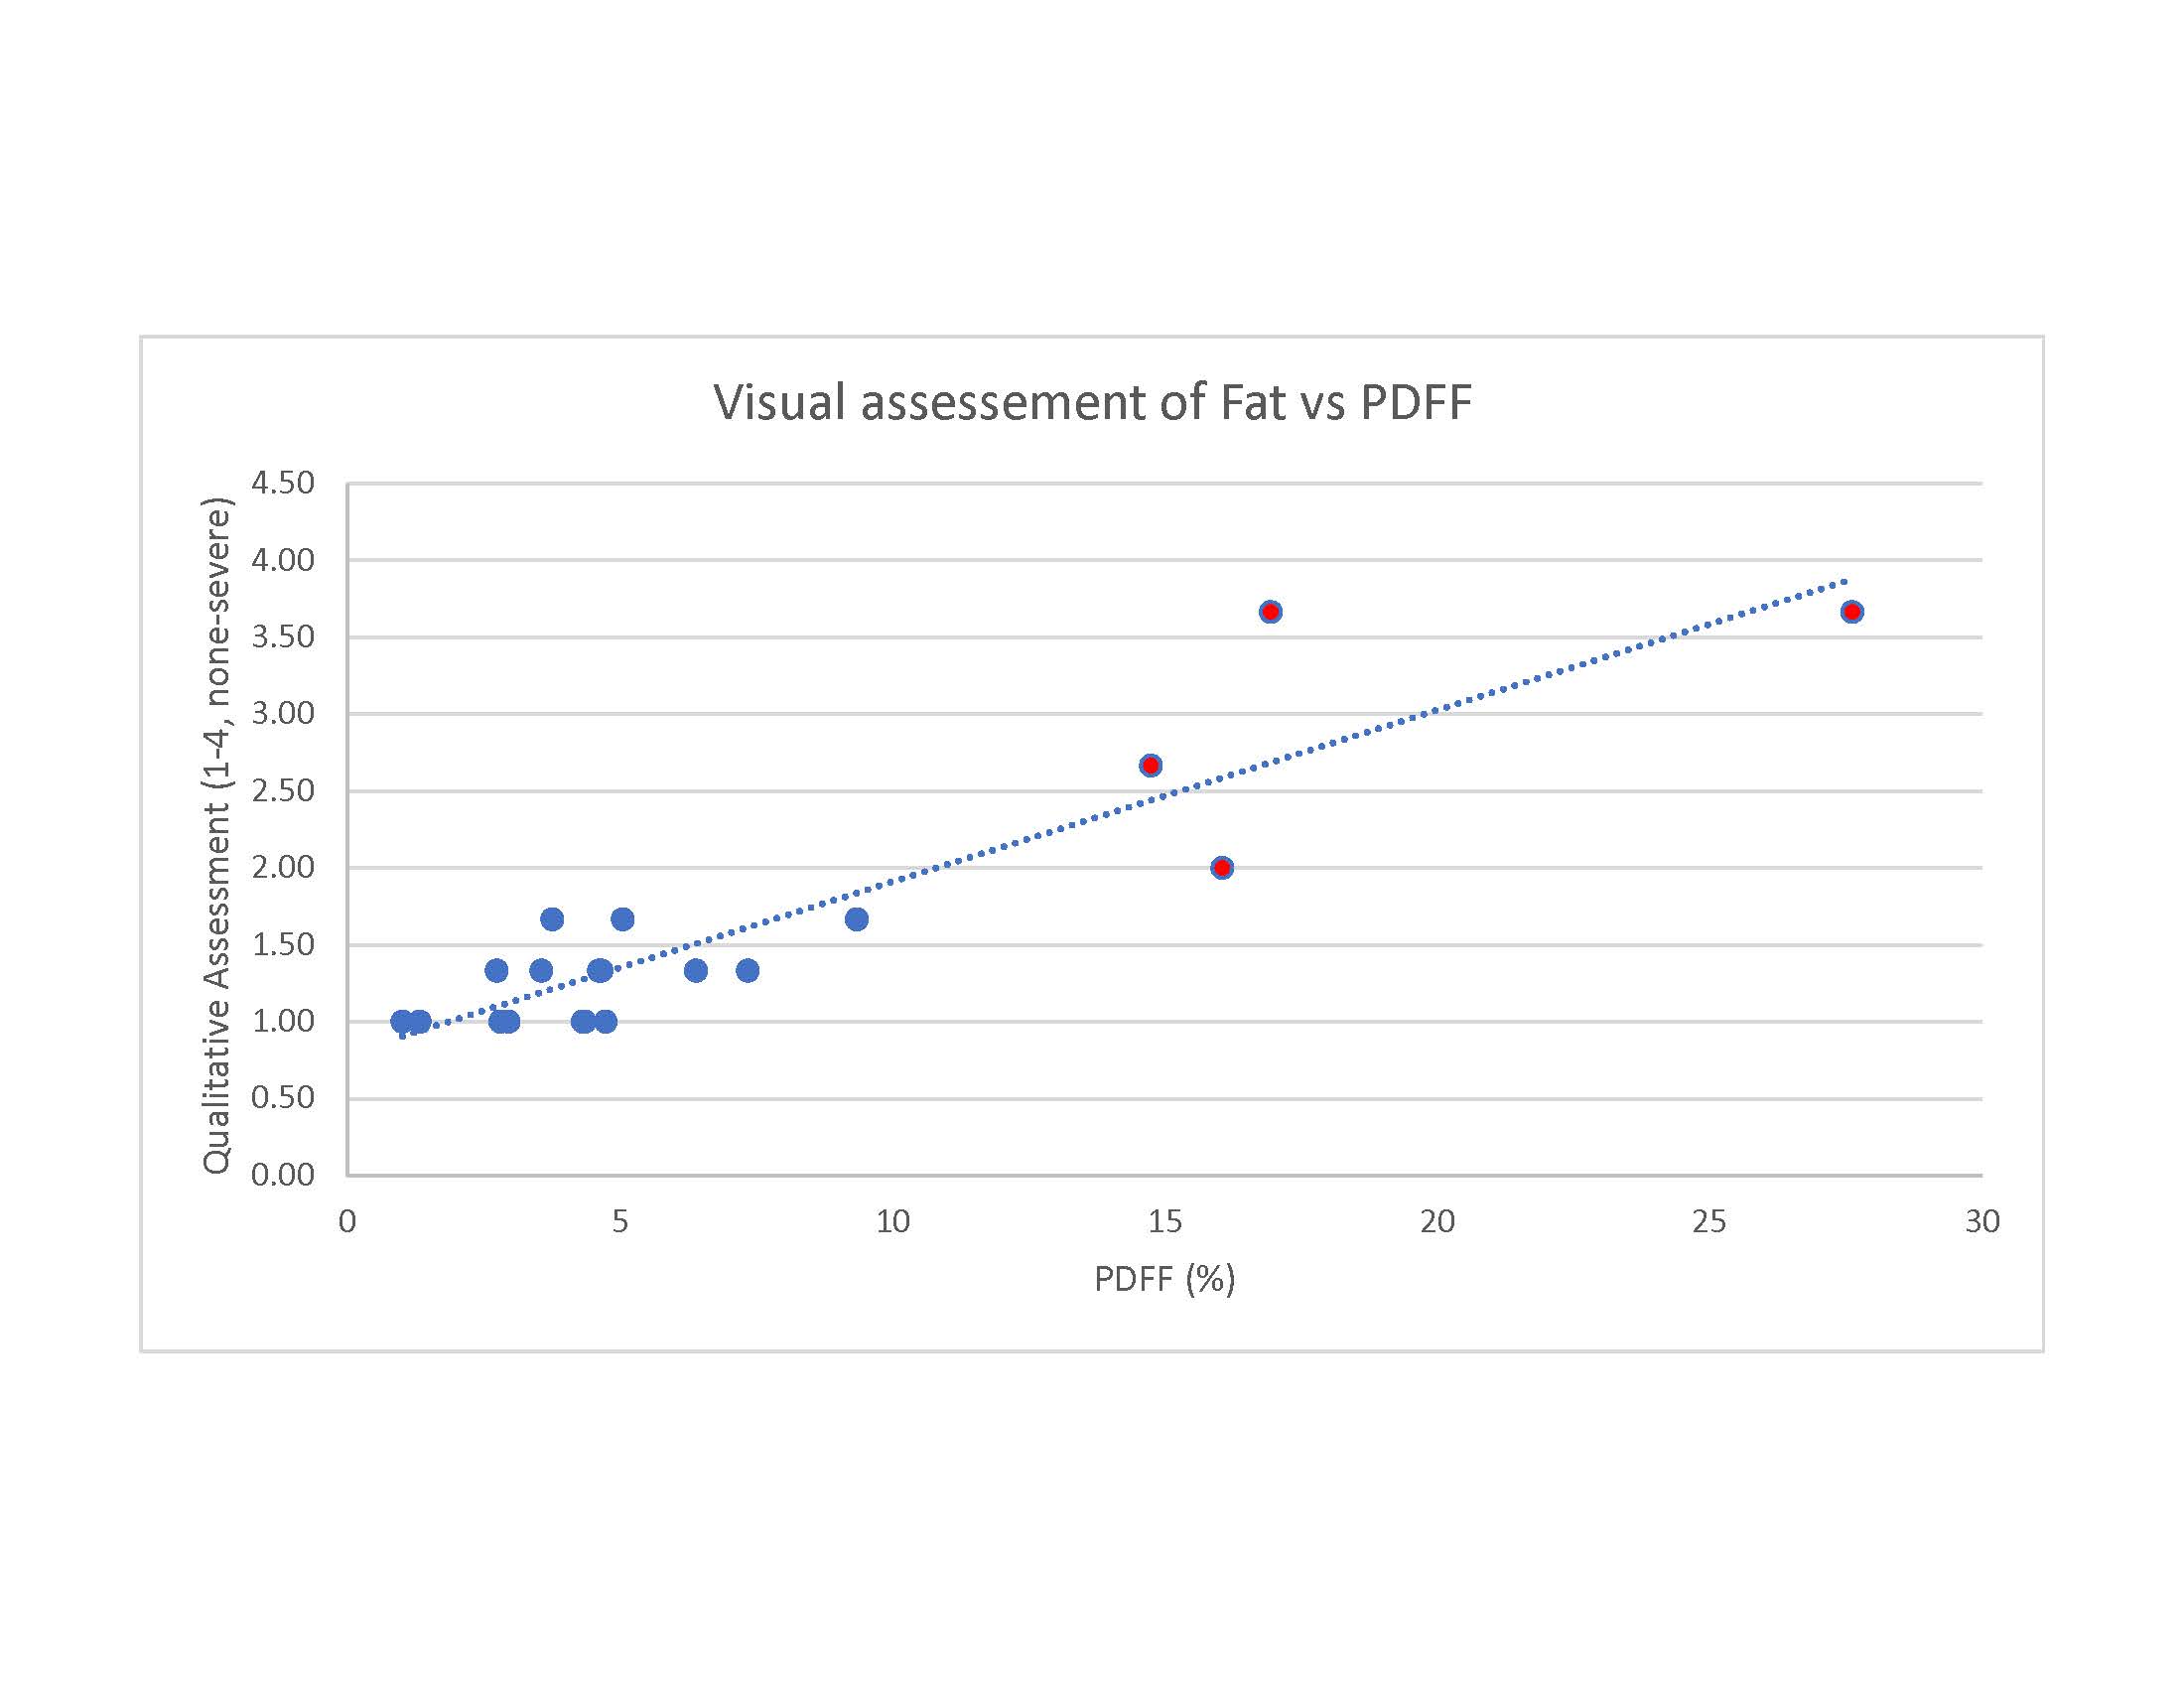
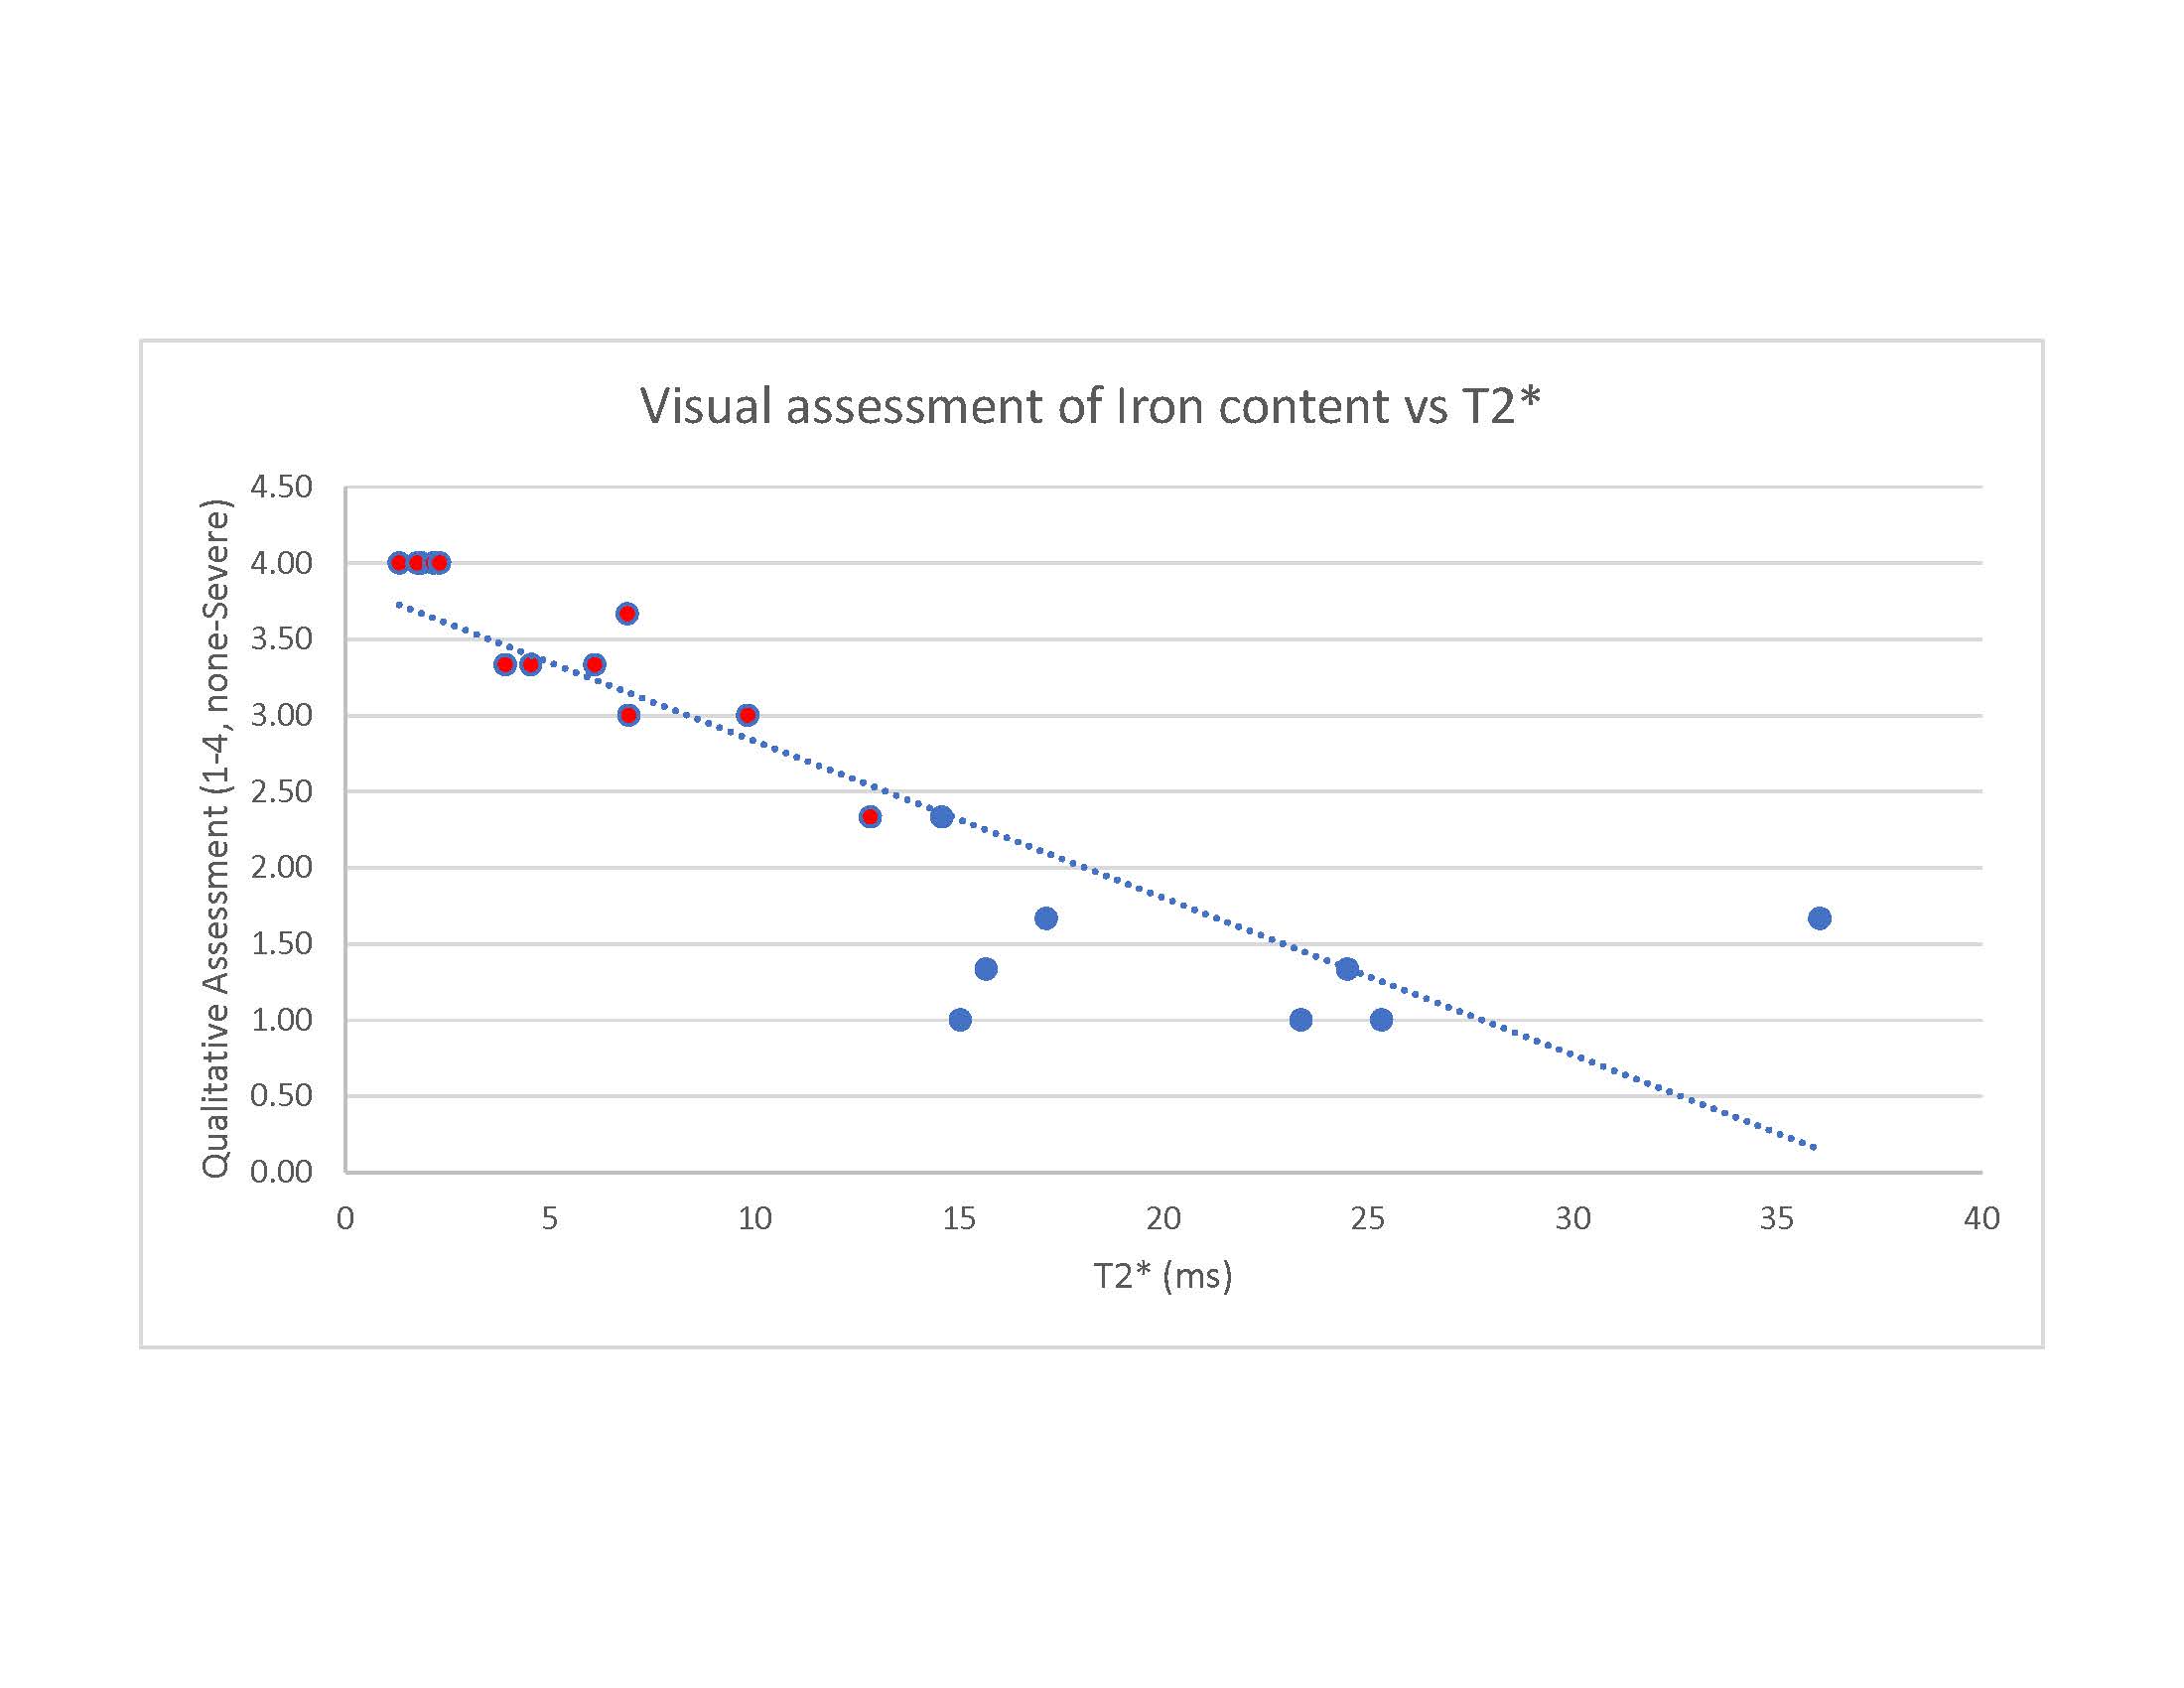
A retrospective review of 20 patients who underwent MRI assessment for hepatic iron content from August 2020 to December 2020 was conducted. The patients’ T2 weighted 2D single shot turbo spin echo images and 2D gradient echo in and out of phase images were isolated and reviewed by three radiologists independently to assess for the degree of fat and iron infiltration as none, mild, moderate, or severe (graded on a 1-4 scale). The proton density fat fraction PDFF and T2* values were recorded from the mDIXON-quant sequence (Philips Healthcare, Best, Netherlands). Additionally, the difference in signal intensity between the 2D gradient echo in and out of phase images was recorded in a large region of interest (ROI) within the liver parenchyma, along with the standard deviation of the pixel values. Statistical analysis was conducted to determine if a correlation was seen between the qualitative and quantitative assessments.Results
There was a positive correlation between the qualitative assessment of fat and PDFF values with a Pearson correlation coefficient of 0.91 (p < 0.001). In addition, there was a negative correlation between the qualitative assessment of iron and T2* of -0.87 (p < 0.001), as would be expected. When using the 2D in and out of phase images, a difference in the signal intensity, greater than two standard deviations, resulted in prediction of all PDFF values greater than 14% (4 patients) and identification of T2* values below 13 ms (11 patients).Discussion
The results demonstrate that it is possible to qualitatively assess the amount of fat and iron content in broad categories of none, mild, moderate, and severe, with accurate correlation to the quantitative measurements. This assessment was completed with T2-weighted images and the in and out of phase images without any quantified measurements. With additional images, such as T1 weighted or fat saturated images, this qualitative measurement could be even more robust. Additionally, drawing an ROI on the 2D gradient echo in and out of phase images and checking for a difference in signal of greater than two standard deviations was able to quantitatively distinguish moderate steatosis or presence of iron on a sequence which is part of most abdominal MRI protocols. Alternatively, no difference in signal would not exclude the presence of fat or iron and should not limit further evaluation using the more specific and accurate sequences. Limitations of this work include a small sample size of patients which were already coming in for iron evaluation. Additionally, presence of iron and fat together can impair quantification of each other, and can impair the qualitative assessment, which should be further investigated.Conclusion
This work begins to provide confidence in qualitative assessment for presence of liver fat and iron from traditional abdominal MRI sequences. Additionally, quick calculations on in and out of phase images can also provide a level of confidence for moderate and severe disease. This can be used as a screening method to identify early disease and subsequently recommend further accurate quantification using specialized sequences on subsequent or upcoming imaging.Acknowledgements
No acknowledgement found.References
References:
1. Moon AM, Singal AG, Tapper EB. Contemporary Epidemiology of Chronic Liver Disease and Cirrhosis. Clin Gastroenterol Hepatol. 2020 Nov;18(12):2650-2666.
2. Kulik L, El-Serag HB. Epidemiology and Management of Hepatocellular Carcinoma. Gastroenterology. 2019 Jan;156(2):477-491.e1.
3. Hernando D, Levin YS, Sirlin CB, Reeder SB. Quantification of liver iron with MRI: state of the art and remaining challenges. J Magn Reson Imaging. 2014;40(5):1003-1021.
4. Reeder SB, Sirlin CB. Quantification of liver fat with magnetic resonance imaging. Magn Reson Imaging Clin N Am. 2010 Aug;18(3):337-57, ix.
Figures