2782
The Effect of the Scanner's Frequency Variation on Estimating the Fatty Acid Composition in Adipose Tissue1Radiology, Weill Cornell Medicine, New York, NY, United States, 2Radiology, NYU Langone Health, New York, NY, United States
Synopsis
We assessed the influence of frequency variation on measurements of fatty acid composition in adipose tissue. A 3D bilateral gradient spectroscopic imaging sequence with a simultaneous dual-slab excitation followed by 128 monopolar echoes was used. The sequence included a short train of 12 navigator echoes without phase encoding at the beginning of each TR period to correct frequency variations due to hardware heating and patient respiration. The proposed method was tested in oil phantoms and ten postmenopausal women. Phase correction reduced measurement error in the phantom and spatial variation in estimates of fatty acid composition in vivo.
Purpose
To assess the effect of correcting for frequency variation on estimates of fatty acid composition (FAC) in mammary adipose tissue at 3T from data acquired with a 3D bilateral gradient-echo spectroscopic imaging sequence (1).Methods
We used the 3D gradient echo spectroscopic imaging sequence presented in (1), in which a dual-slab excitation (FA = 10°) pulse is followed by 128 monopolar gradient echoes. Frequency variation was monitored by placing a short train of 12 navigator echoes without phase or partition encoding at the beginning of each TR period. The spectroscopic imaging data were then corrected by multiplying the echoes in each line of k-space with a phase shift of (-2πΔf TE), where TE is the echo time of the echo being corrected, and Δf is the frequency offset during the TR period that the k-space line was acquired. The corrected k-space data were then reconstructed for each echo using a GRAPPA algorithm. Afterward, frequency spectra were generated for every voxel by applying a Fourier transform along the echo dimension. FAC parameters, including the number of double bonds (ndb), number of methylene-interrupted double bonds (nmidb), and chain length (cl) per triglyceride molecule, were estimated using a non-linear least squares approach. To assess the effect of frequency correction on FAC accuracy, we ran the sequence on a phantom containing tubes of walnut, grapeseed, almond, and peanut oil, immersed in a container of water. FAC estimates from images with and without phase correction were compared with reference values from the USDA Food Composition Database (2). GSI imaging was also performed on ten postmenopausal women (age: 59 ± 9 years) at average risk of breast cancer. All subjects provided written informed consent under an IRB-approved protocol. All scans were conducted on a whole-body 3T MRI scanner (TIM Trio; Siemens, Erlangen, Germany) with a dedicated 16-element bilateral breast coil (In vivo, Orlando, FL). Imaging parameters included: 2.8mm isotropic resolution, GRAPPA acceleration factor = 8, inter-echo spacing = 1.44ms, receiver bandwidth = 1410 Hz/pixel, flip angle =10° and TR = 213ms. The total scan time was 5:27 minutes.Results
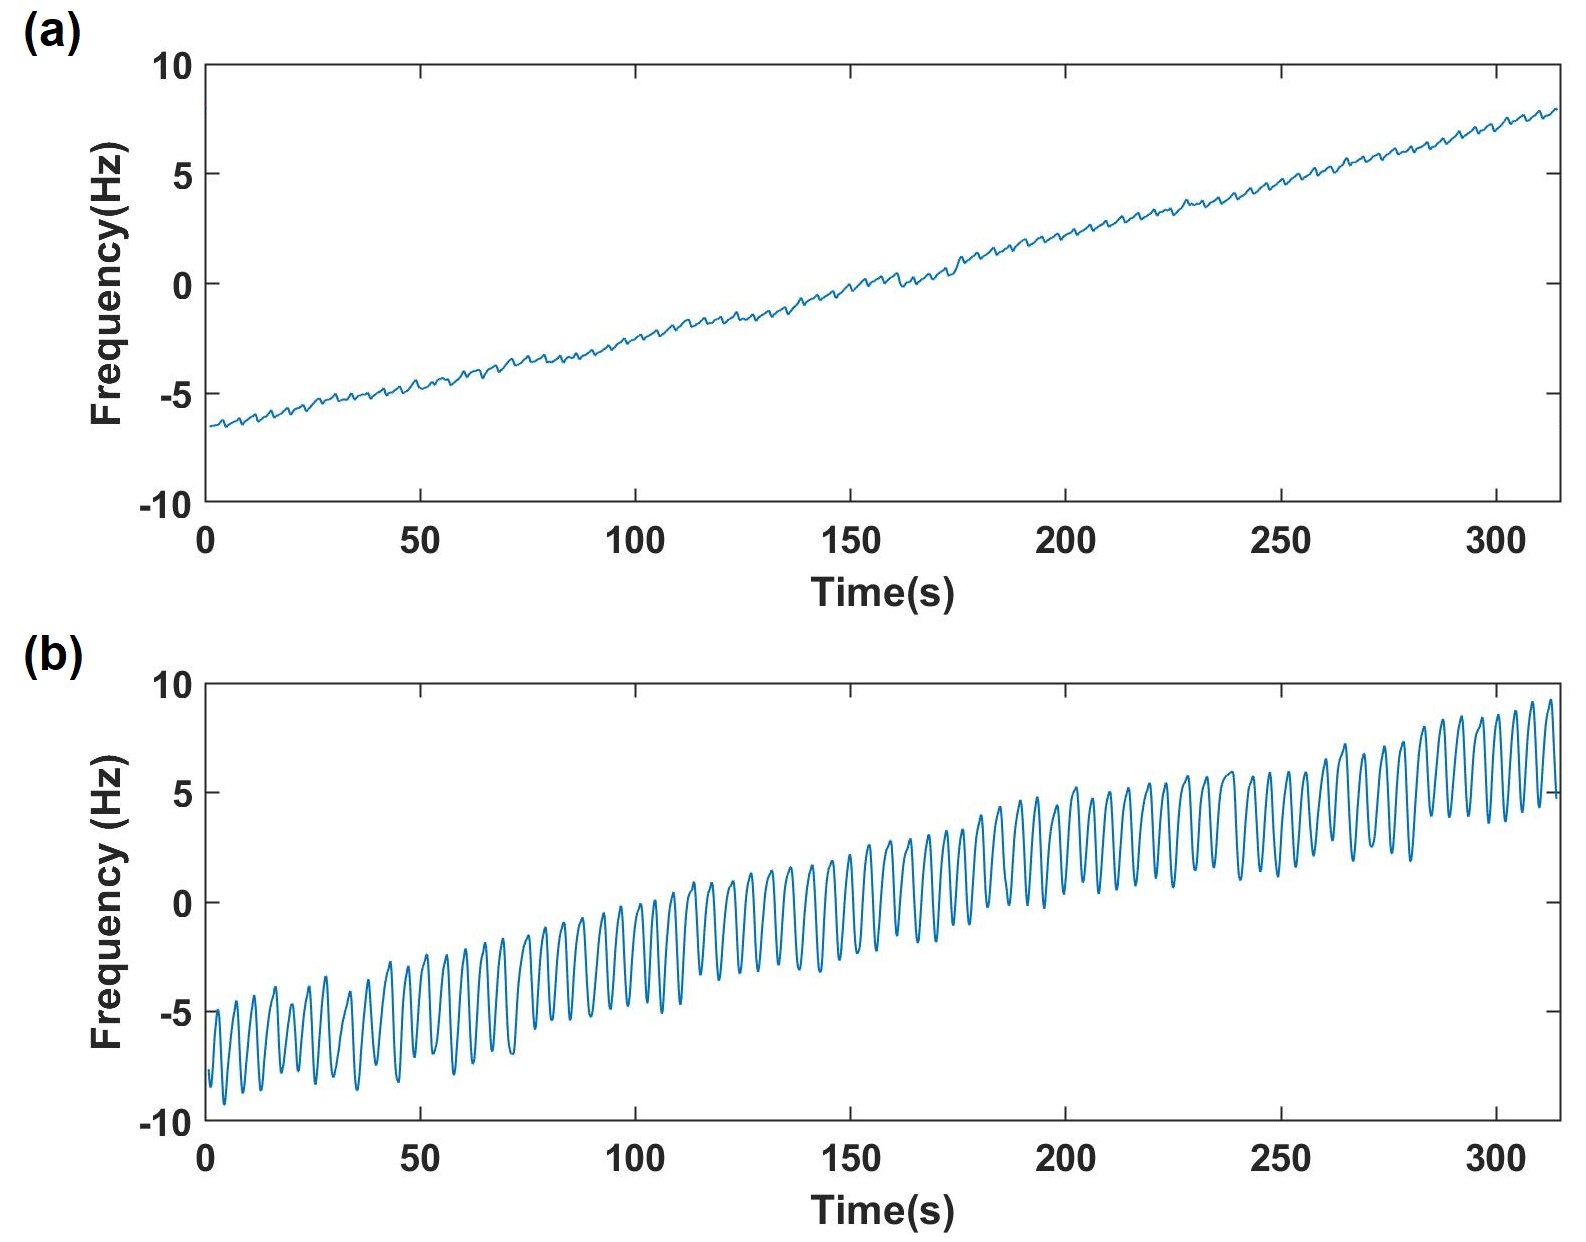
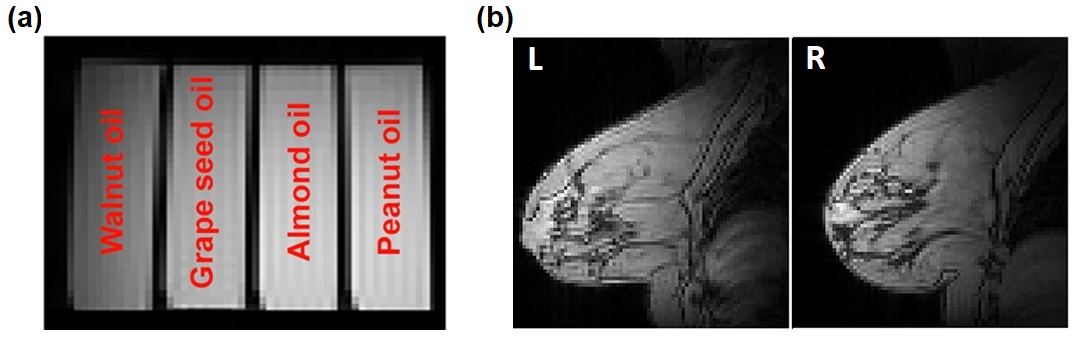
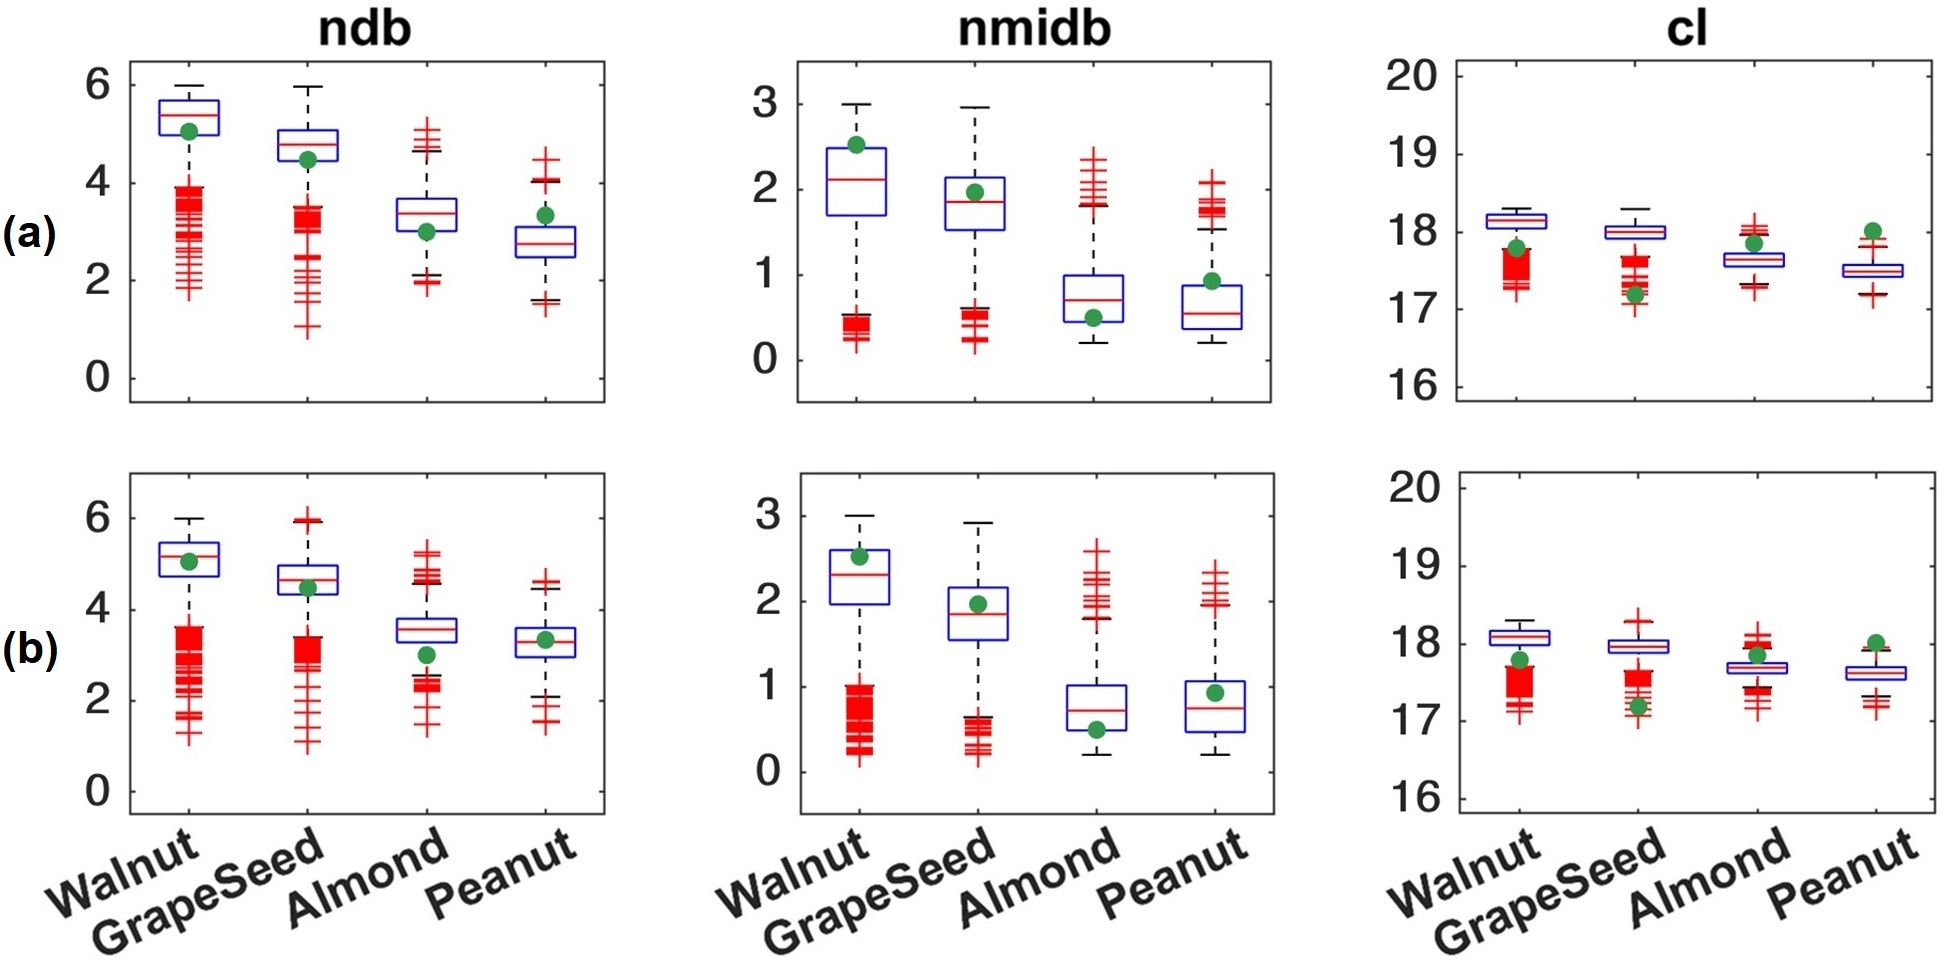
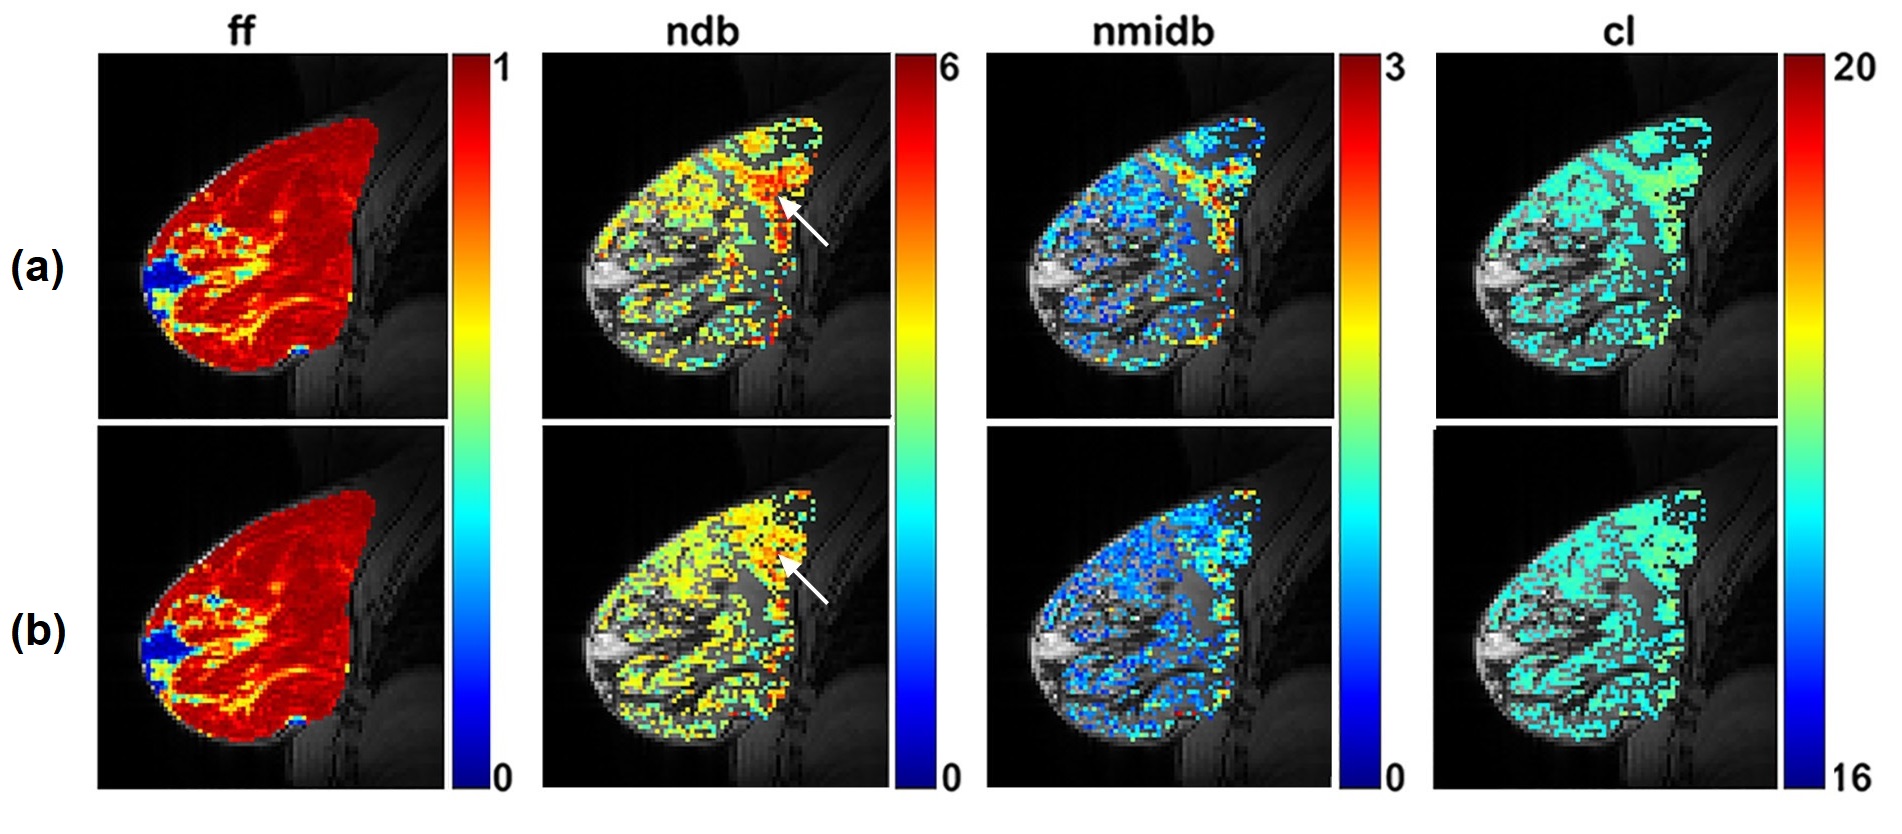
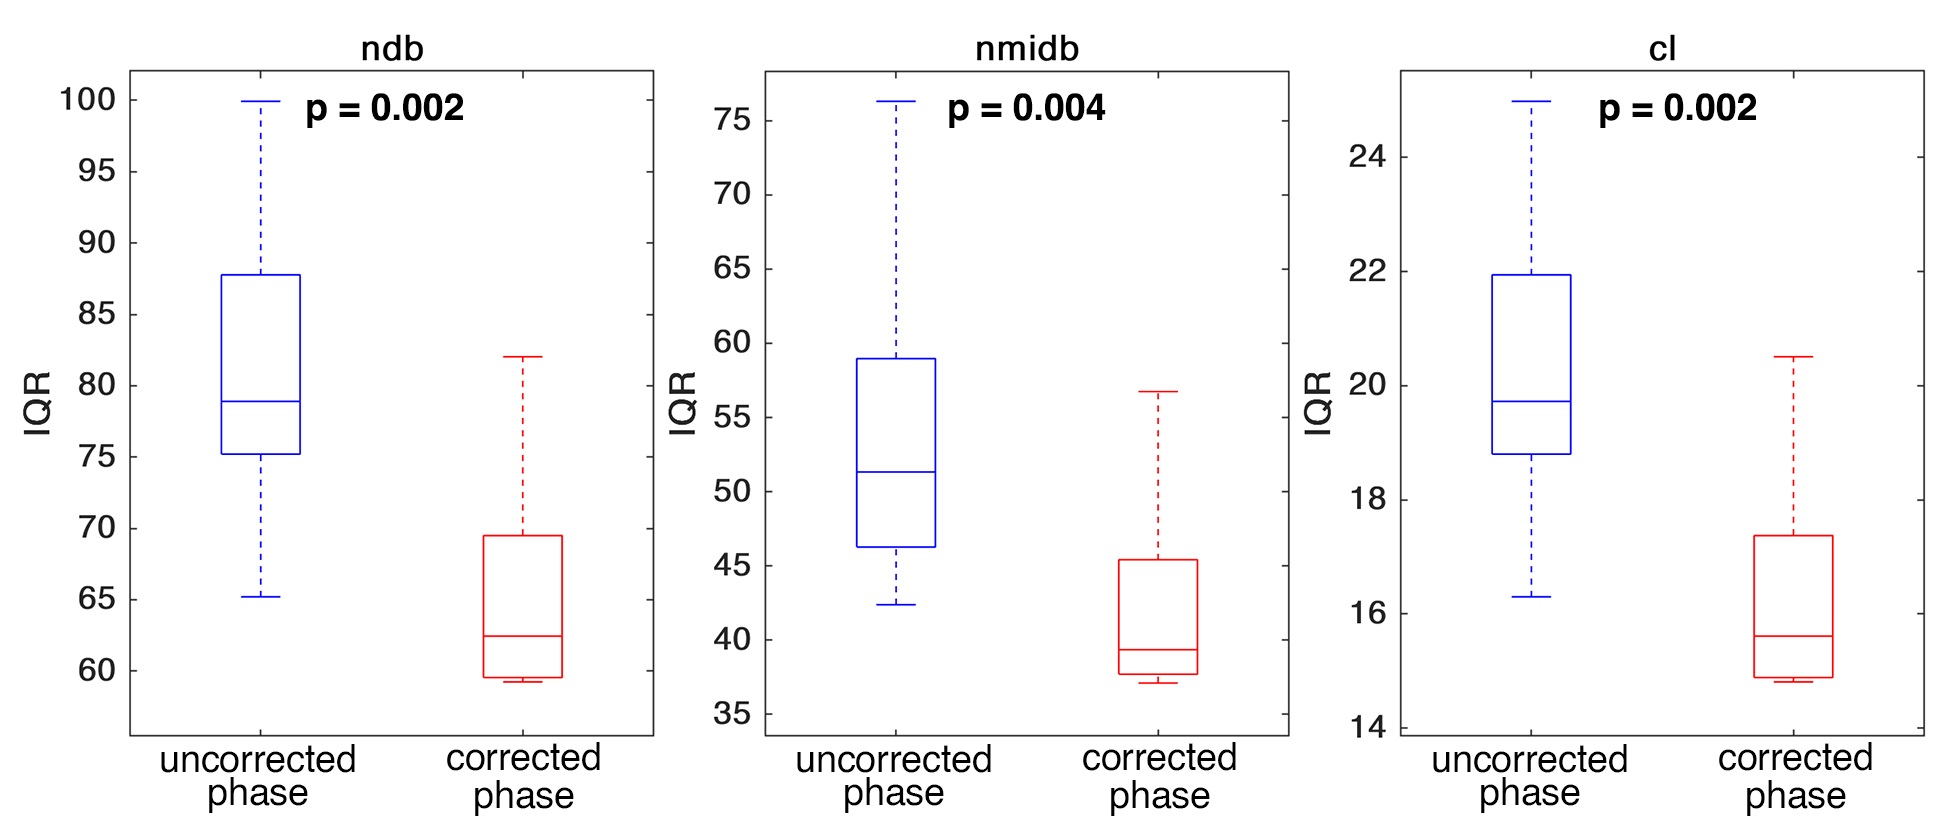
The sum of residuals from the spectral fitting was significantly reduced by applying phase correction (p=0.045) in both phantom and in-vivo studies. As shown in Figure 1a, we observed an overall drift of about 10Hz from the beginning to the end of the phantom scan. In the patient studies, we measured an average drift (Mean ± SD) of 17.42 ± 2.5 Hz over the ten subjects. Moreover, an additional fluctuation with an average rate of 0.27 ± 0.05Hz was present due to respiratory motion. Figure 2 shows magnitude images from the phantom (Figure 2a) and from both breasts in one of the patients (Figure 2b). The GRAPPA algorithm successfully separated the right and left breast signals without any noticeable residual aliasing. A boxplot comparison between FAC parameters estimated from images with and without phase correction in the phantom is shown in Figure 3. The outliers are shown with red pluses. Applying the phase correction resulted in a decrease of about 7% in the measurement error. Figure 4 shows an example of FAC parameter maps generated from data with and without phase correction in one of the patients. As shown in Figure 4b, the phase-corrected data exhibited less heterogeneity across the breast adipose tissue than those generated from uncorrected data, particularly near the chest wall (Figure 4a). Figure 5 provides a quantitative assessment of variability in FAC estimates across all subjects. The interquartile range was reduced after phase correction by 18.4 ± 10.6%, 18.5 ± 13.9%, and 18.4 ± 10.6% for ndb (p = 0.002), nmidb (p = 0.004), and cl (p = 0.002), respectively.Discussion and Conclusion
Our measurements of ndb, nmidb, and cl in mammary adipose tissue are consistent with previous reports concerning subcutaneous fat (3) and mammary adipose tissues (4). The voxel-wise spectral analysis used in this work can effectively account for spatial variation in B0 and T2* differences among lipid peaks. Our results demonstrate the advantage of correcting for frequency variation in estimating fatty acid composition. We plan to extend this study to a larger cohort of women and investigate FAC in postmenopausal women at average risk of breast cancer compared to women with breast cancer.Acknowledgements
This work was supported by grants R01CA160620, R01CA219964, UG3CA228699, and P41EB017183 from the National Institutes of Health.References
1. Storey P, Moy LM, Kim SG. A dual-slab 3D gradient-echo spectroscopic imaging sequence with correction of respiration- and hardware-related frequency variations for bilateral evaluation of lipid composition in the breast. ISMRM 2019; Montreal. p 1872.
2. USDA Food Composition Database | National Agricultural Library | USDA.
3. Peterson P, Månsson S. Simultaneous quantification of fat content and fatty acid composition using MR imaging. Magnetic Resonance in Medicine 2013;69(3):688-697.
4. Freed M, Storey P, Lewin AA, Babb J, Moccaldi M, Moy L, Kim SG. Evaluation of Breast Lipid Composition in Patients with Benign Tissue and Cancer by Using Multiple Gradient-Echo MR Imaging. Radiology 2016;281(1):43-53.
Figures