2777
Feasibility of amide proton transfer imaging on distinction of the vertebral body and paravertebral muscles in patients with CKD1Radiology, Tongji Hospital, Tongji Medical College, Huazhong University of Science and Technology, Wuhan, China, 2MR Research, GE Healthcare, Beijing, China, 31Radiology, Tongji Hospital, Tongji Medical College, Huazhong University of Science and Technology, Wuhan, China
Synopsis
Amide proton transfer-weighted (APTw) imaging is a molecular MRI technique that generates image contrast based predominantly on the amide protons in mobile cellular proteins and peptides that are endogenous in tissue. Due to decreased vascular perfusion and increased glycolytic metabolism, tissue hypoxia is usually accompanied by acidosis; however, osteoclasts show significant functional enhancement in hypoxia and acidosis. The present study demonstrates that APT had higher diagnostic performance on identifying the differences of both bone and muscles between patients with different levels of CKD. It may have potential in distinction patients with CKD in accompanied with Mineral bone disease (MBD).
Introduction
Amide proton transfer-weighted (APTw) imaging is a molecular MRI technique that generates image contrast based predominantly on the amide protons in mobile cellular proteins and peptides that are endogenous in tissue. This technique has been used successfully for imaging of protein content and pH, the latter being possible due to the strong dependence of the amide proton exchange rate on pH [1, 2] Studies on humans and animals with chronic kidney disease (CKD) have found that their skeletal muscle microvascular density is reduced by about 30%, suggesting that CKD can cause systemic microvascular disease.[3] Due to decreased vascular perfusion and increased glycolytic metabolism, tissue hypoxia is usually accompanied by acidosis; however osteoclasts show significant functional enhancement in hypoxia and acidosis.[4, 5] Therefore, it is very valuable to study the changes of skeletal muscle and bone tissue in CKD patients using APT.Materials and Methods
This study was approved by the Institutional Review Board of our hospital and all recruited subjects gave the informed consent. We have conducted two studies. In study A, a total of 18 patients were divided in to two groups, one including patients with 30<eGFR<90 ml/min/1.73m2 and without dialysis as well as the other with eGFR<15 ml/min/1.73m2 without dialysis; in the study B, a total of 24 patients were divided into two groups, patients with eGFR<15 ml/min/1.73m2 half with and half without dialysis . Patients with any disease known to affect bone or receive medication that may affect bone density were excluded. All blood biochemical indexes (blood routine, renal function, serum electrolyte, β-CTX [β-crosslaps], osteocalcin [OC], and, PTH [parathyroid hormone])[1] were obtained within one week before the MRI examinations. All patients underwent axial APT and T1 CUBE scans on second lumbar vertebra (L2) on a 3.0 T scanner (Signa Pioneer, GE Healthcare) with both abdomen and spine bed coils. ROIs were drawn on the T1 CUBE as the reference image of APT while avoiding the accidental inclusion of subcutaneous fat or the muscle fat-interface. The psoas major, multifidus, erector spinae and the central vertebra were drawn on both sides on the middle 3 layers of the L2 vertebra. The three layers were averaged as one value to be used. Statistical analyses within and between groups were carried out using IBM SPSS Statistics 26 (Armonk, NY, USA).Results
Significant differences between groups were shown in Table 1.In study A, the area under the curve (AUC) of mean and median of MTasym in the second lumbar vertebrae (L2-MTasym-mean, L2-MTasym-median) as well as kurtosis of 1-MTR of multifidus (MF-(1-MTR)-kurt) were 0.914, 0.926, and 0.84 (P = 0.003, 0.002, and 0.015), respectively. Pearson correlation coefficient between lumbar vertebrae as well as multifidus and Hb were found (Table 2).Discussion and Conclusions
The present study demonstrates the first attempt of 3D FSE APT MR imaging for lumbar vertebrae and paravertebral muscles in patients with CKD. We found that APT had higher diagnostic performance on identifying the differences of both bone and muscles between patients with different levels of CKD. With the progress of CKD, the number of tiny blood vessels is significantly reduced, consequently leading to hypoxia, that is decreased blood supply and increased regional acidity in regional tissue. Therefore, bone and muscle is lost as CKD progresses. [4]Osteoclasts are very sensitive to pH alteration and increased activity leads to bone loss. [5] APT imaging is very sensitive to changes in the acid-base of the tissue. [7] In our study, the biochemical indicators and APT variables showed highly correlated. The APT variables of the vertebral body and paraspinal muscles were highly correlated with hemoglobin as well as creatine kinase and PCV, respectively. Since hemoglobin and PCV in reflection of anemia as well as kinase in reflection of metabolism in the skeletal muscle, APT indeed demonstrated a good diagnostic ability of distinguishing the patients with different grades of CKD. Previous studies of the CKD effects on osteo-muscular system mostly focused on bone, but few studies focused on musculoskeletal aspect.[6] This study underpinned the importance of observation on both muscle and skeletal of patients with chronic diseases. To sum up, APT imaging may have potential in distinction patients with CKD in accompanied with Mineral bone disease (MBD).Acknowledgements
No acknowledgement found.References
[1]. Sun, P.Z., E. Wang and J.S. Cheung, Imaging acute ischemic tissue acidosis with pH-sensitive endogenous amide proton transfer (APT) MRI--correction of tissue relaxation and concomitant RF irradiation effects toward mapping quantitative cerebral tissue pH. Neuroimage, 2012. 60(1): p. 1-6.
[2]. Yu, L., et al., Amide Proton Transfer MRI Signal as a Surrogate Biomarker of Ischemic Stroke Recovery in Patients With Supportive Treatment. Front Neurol, 2019. 10: p. 104.
[3]. Querfeld, U., R.H. Mak and A.R. Pries, Microvascular disease in chronic kidney disease: the base of the iceberg in cardiovascular comorbidity. Clinical Science, 2020. 134(12): p. 1333-1356.
[4]. Marenzana, M. and T.R. Arnett, The Key Role of the Blood Supply to Bone. Bone Res, 2013. 1(3): p. 203-15.
[5]. Archives of Biochemistry and Biophysics.
[6]. Nickolas, T.L., M.B. Leonard and E. Shane, Chronic kidney disease and bone fracture: a growing concern. Kidney Int, 2008. 74(6): p. 721-31.
[7]. Zhou, J., et al., APT-weighted MRI: Techniques, current neuro applications, and challenging issues. J Magn Reson Imaging, 2019. 50(2): p. 347-364.
Figures
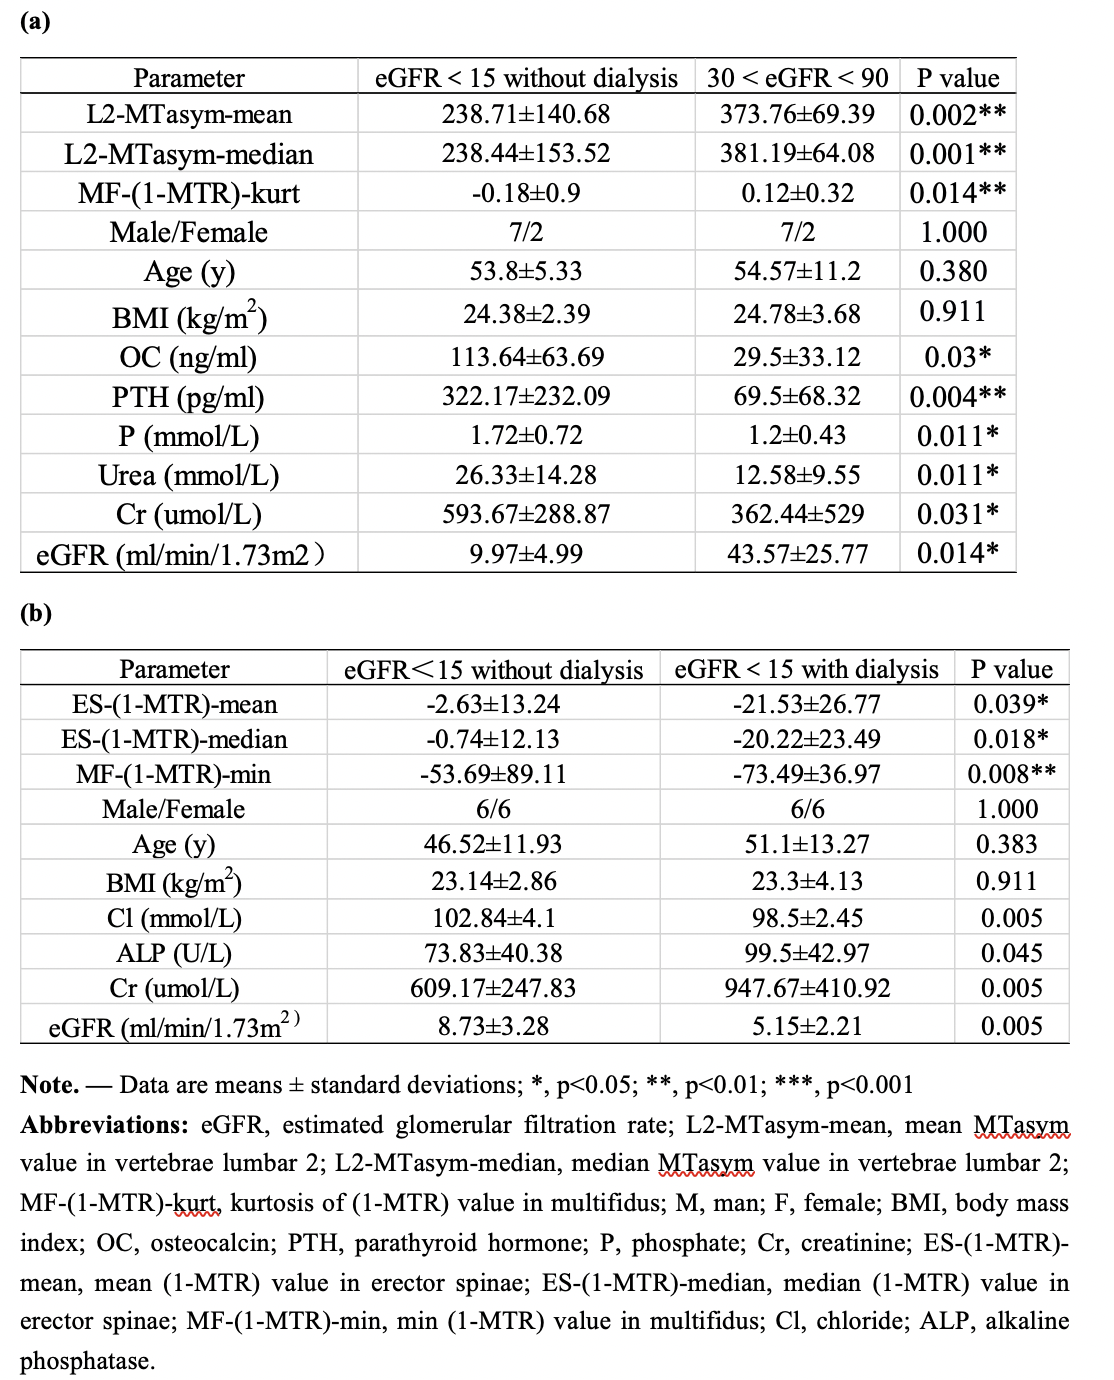
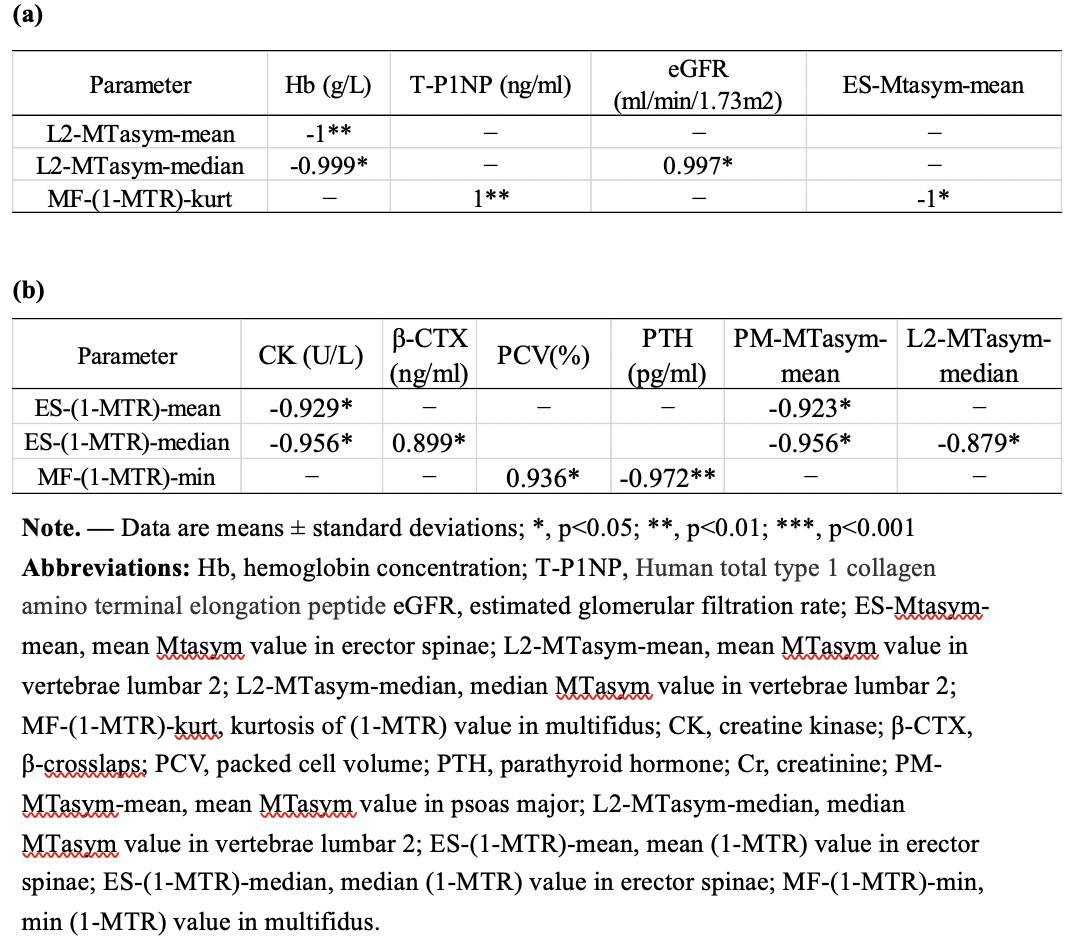
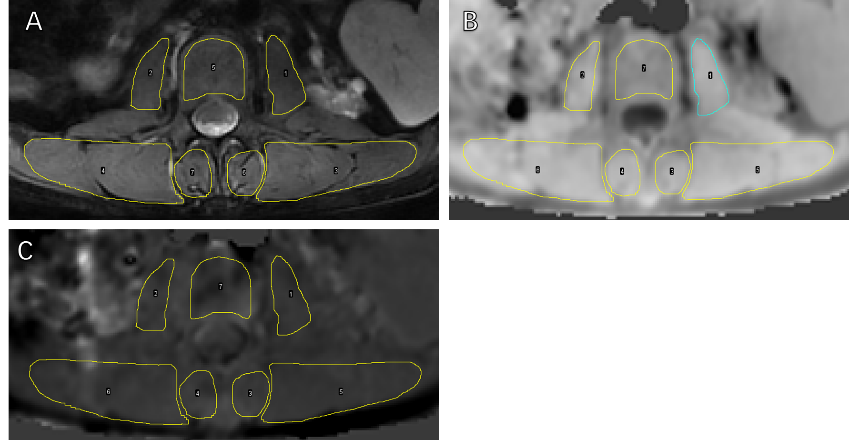
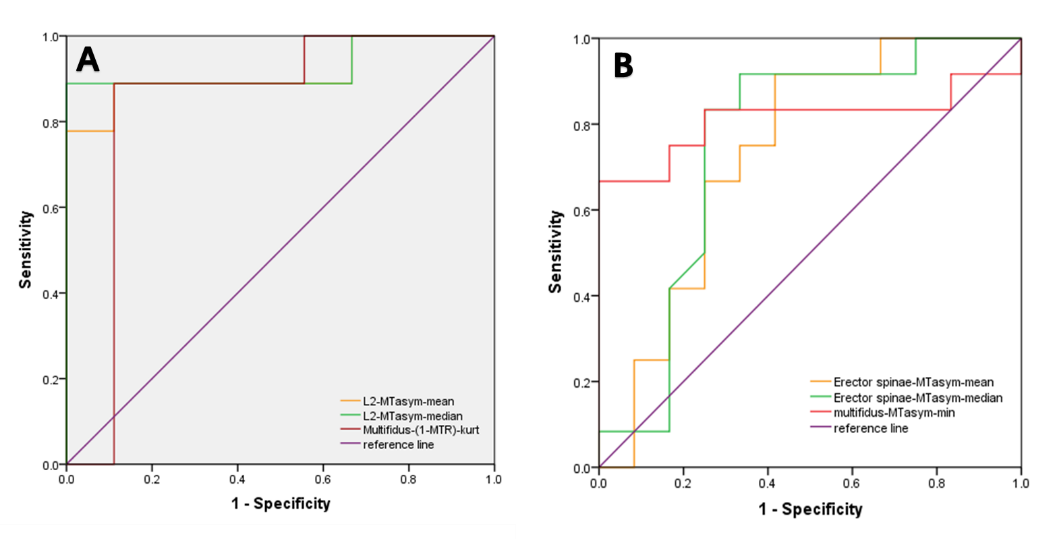
Figure 3 ROC curve of APT for differentiating patients (a) with eGFR<15 without dialysis vs. 30 < eGFR < 90 from (b) eGFR<15 without dialysis vs. eGFR<15 with dialysis.