2767
Whole-Liver Histogram Analysis of Diffusion Kurtosis Imaging Metrics in Predicting Acute Rejection After Orthotopic Liver Transplantation
Chang Li1, Mengzhu Wang2, and Canhui Sun1
1The First Affiliated Hospital, Sun Yat-Sen University, Guangzhou, China, 2MR Scientific Marketing, Siemens Healthcare, Guangzhou, China
1The First Affiliated Hospital, Sun Yat-Sen University, Guangzhou, China, 2MR Scientific Marketing, Siemens Healthcare, Guangzhou, China
Synopsis
Acute cellular rejection (ACR) occurs in 10-40% patients following liver transplantation (LT). Diffusion kurtosis imaging (DKI) provides more information about microstructure than standard monoexponential diffusion method. We analyzed the whole-liver volume histogram metrics of D map, K map, and ADC map with comparison those of the ACR and non-ACR group. Statistical analysis shows that most metrics of D maps were significantly lower in the ACR group than those in the non-ACR group, while most metrics of K maps were significantly higher in the ACR group those in the non-ACR group. None of the metrics of ADC maps were significantly different.
Purpose
To investigate the diagnostic value of whole-liver volume histogram analysis of diffusion kurtosis imaging (DKI) metrics in acute cellular rejection (ACR) after orthotopic liver transplantation (OLT).Method
During 2014 to 2019, 109 patients underwent MR examination with DKI sequence following OLT. A total of 18 patients were diagnosed with ACR (reference standard: biopsy). The remaining 91 patients were as follows: 56 with biliary complications (reference standard: ERC or PTC), 11 with vascular complications (reference standard: surgery or DSA), 2 with drug induced liver injury (DILI), 13 normal (excluded), and 9 tumor recurrence (excluded). Finally 87 patients were included in this study. They were divided into the ACR group and non-ACR group. For each patient, DKI was performed with a 3.0T MRI system (MAGNETOM Trio 3.0T, Siemens Medical Solutions, Erlangen, Germany) with b values of 0, 200, 500, 1000, 1500, and 2000 sec/mm2. Corrected diffusion (D), Kurtosis (K), and apparent diffusion coefficient (ADC) values were measured using dedicated software (Body Diffusion Toolbox, Siemens) with whole-liver volume histogram analysis. Mean, median, skewness, kurtosis, the 25th and 75th percentiles were generated and compared. Student's t-test or Mann-Whitney U-test, and receiver operating characteristic (ROC) curves were used for statistical analysis.Results
Mean, median, 25th, and 75th percentiles of D values were significantly lower in the ACR group than those in the non-ACR group (P = 0.012-0.027). Mean, median, skewness, 25th, and 75th percentiles of K values in the ACR group were significantly higher compared to those in the non-ACR group (P = 0.003-0.022). No significance were found in ADC parameters between the ACR and non-ACR group. Regarding the comparison of the diagnostic performance of all statistically significant histogram parameters, K75th showed the highest AUC value of 0.895, and the corresponding values for sensitivity and specificity were 0.947 and 0.789, respectively.Conclusion
DKI metrics with whole-liver volume histogram analysis show a promising potential in diagnosing ACR after OLT compared to traditional imaging modalities.Acknowledgements
We thank Prof. Bingsheng Huang and his team for providing help with data postprocessing.References
1. Rosenkrantz AB, Padhani AR, Chenevert TL, Koh DM, De Keyzer F, Taouli B, Le Bihan D (2015) Body diffusion kurtosis imaging: Basic principles, applications, and considerations for clinical practice. J Magn Reson Imaging 42 (5):1190-1202. doi:10.1002/jmri.24985 2. Sheng RF, Wang HQ, Jin KP, Yang L, Liu H, Ji Y, Fu CX, Zeng MS (2018) Histogram analyses of diffusion kurtosis indices and apparent diffusion coefficient in assessing liver regeneration after ALPPS and a comparative study with portal vein ligation. J Magn Reson Imaging 47 (3):729-736. doi:10.1002/jmri.25793 3. Demetris AJ, Ruppert K, Dvorchik I, Jain A, Minervini M, Nalesnik MA, Randhawa P, Wu T, Zeevi A, Abu-Elmagd K, Eghtesad B, Fontes P, Cacciarelli T, Marsh W, Geller D, Fung JJ (2002) Real-time monitoring of acute liver-allograft rejection using the Banff schema. Transplantation 74 (9):1290-1296. doi:10.1097/00007890-200211150-00016 4. Banff schema for grading liver allograft rejection: an international consensus document (1997). Hepatology (Baltimore, Md) 25 (3):658-663. doi:10.1002/hep.510250328 5. Yoshimaru D, Takatsu Y, Suzuki Y, Miyati T, Hamada Y, Funaki A, Tabata A, Maruyama C, Shimada M, Tobari M, Nishino T (2019) Diffusion kurtosis imaging in the assessment of liver function: Its potential as an effective predictor of liver function. The British journal of radiology 92 (1094):20170608. doi:10.1259/bjr.20170608 6. Wang J, Dou W, Shi H, He X, Wang H, Ge Y, Cheng H (2020) Diffusion kurtosis imaging in liver: a preliminary reproducibility study in healthy volunteers. Magnetic Resonance Materials in Physics, Biology and Medicine. doi:10.1007/s10334-020-00846-4 7. Yang L, Rao S, Wang W, Chen C, Ding Y, Yang C, Grimm R, Yan X, Fu C, Zeng M (2018) Staging liver fibrosis with DWI: is there an added value for diffusion kurtosis imaging? Eur Radiol 28 (7):3041-3049. doi:10.1007/s00330-017-5245-6Figures
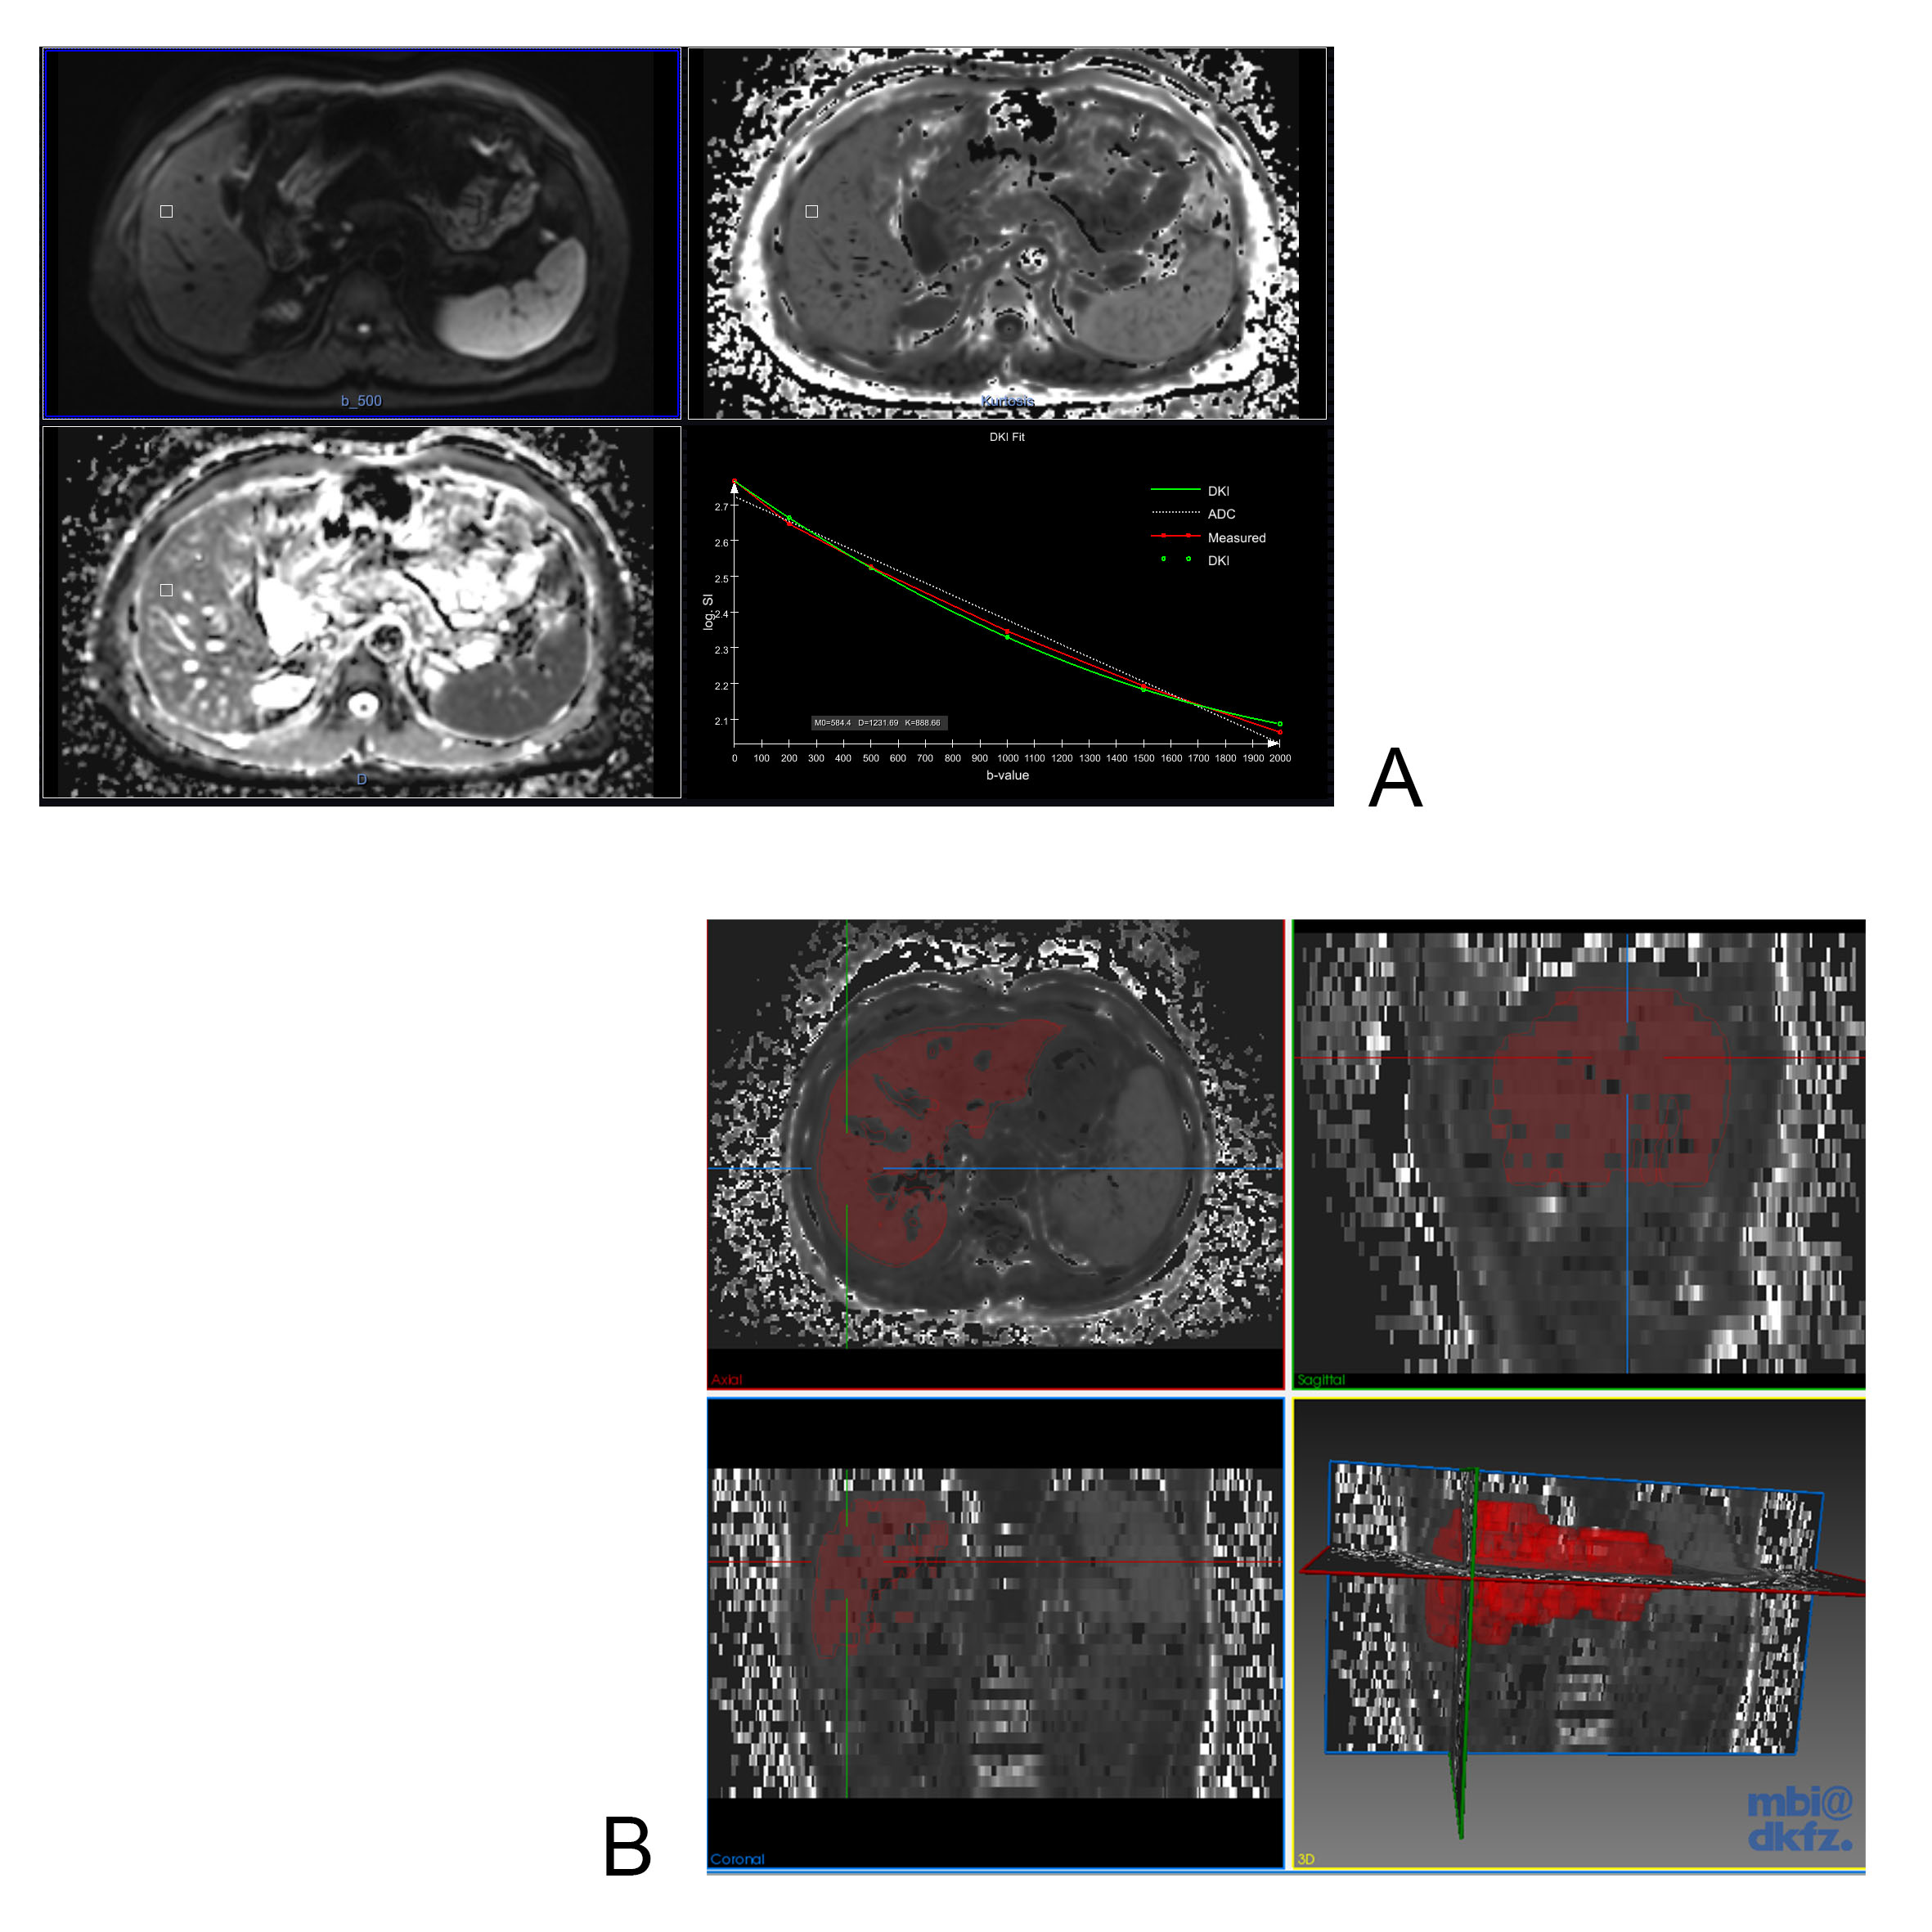
D map, K map, ADC map and fitting curve (A) and demonstration of whole-liver ROI (B) manually delineated by using the ITK-SNAP software.
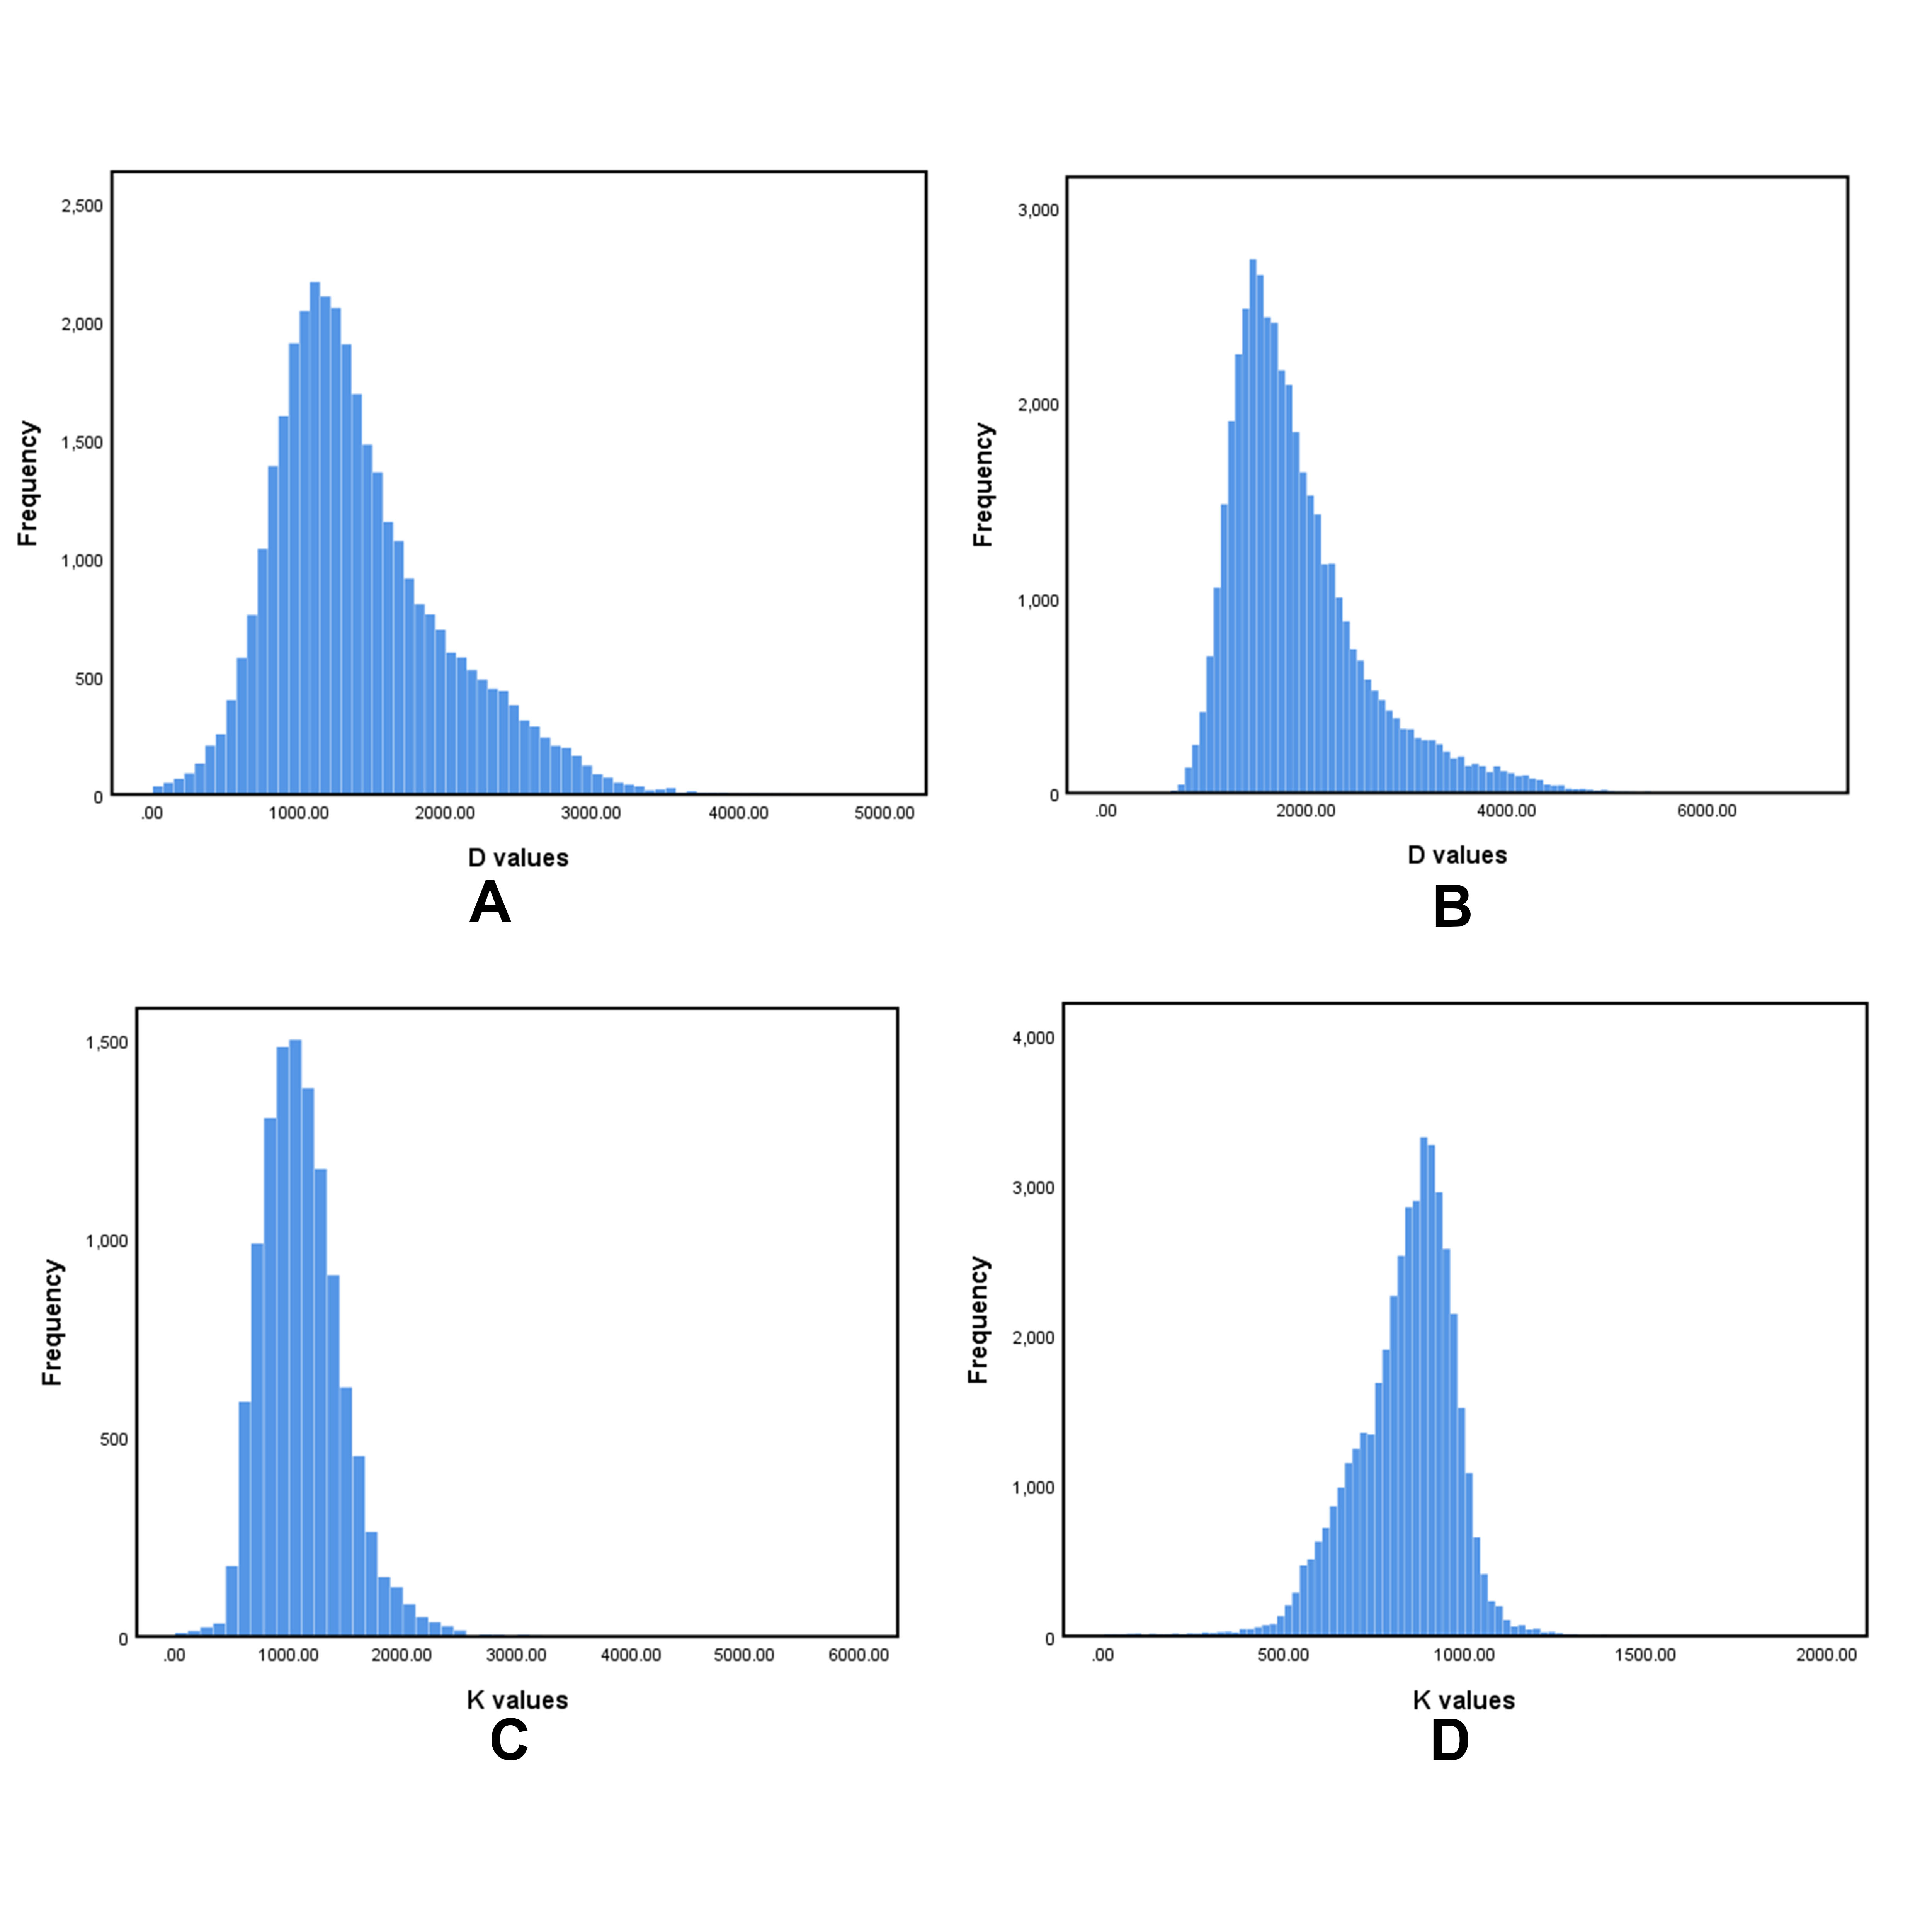
Histogram analysis for D values (A & B) and K values (C & D).
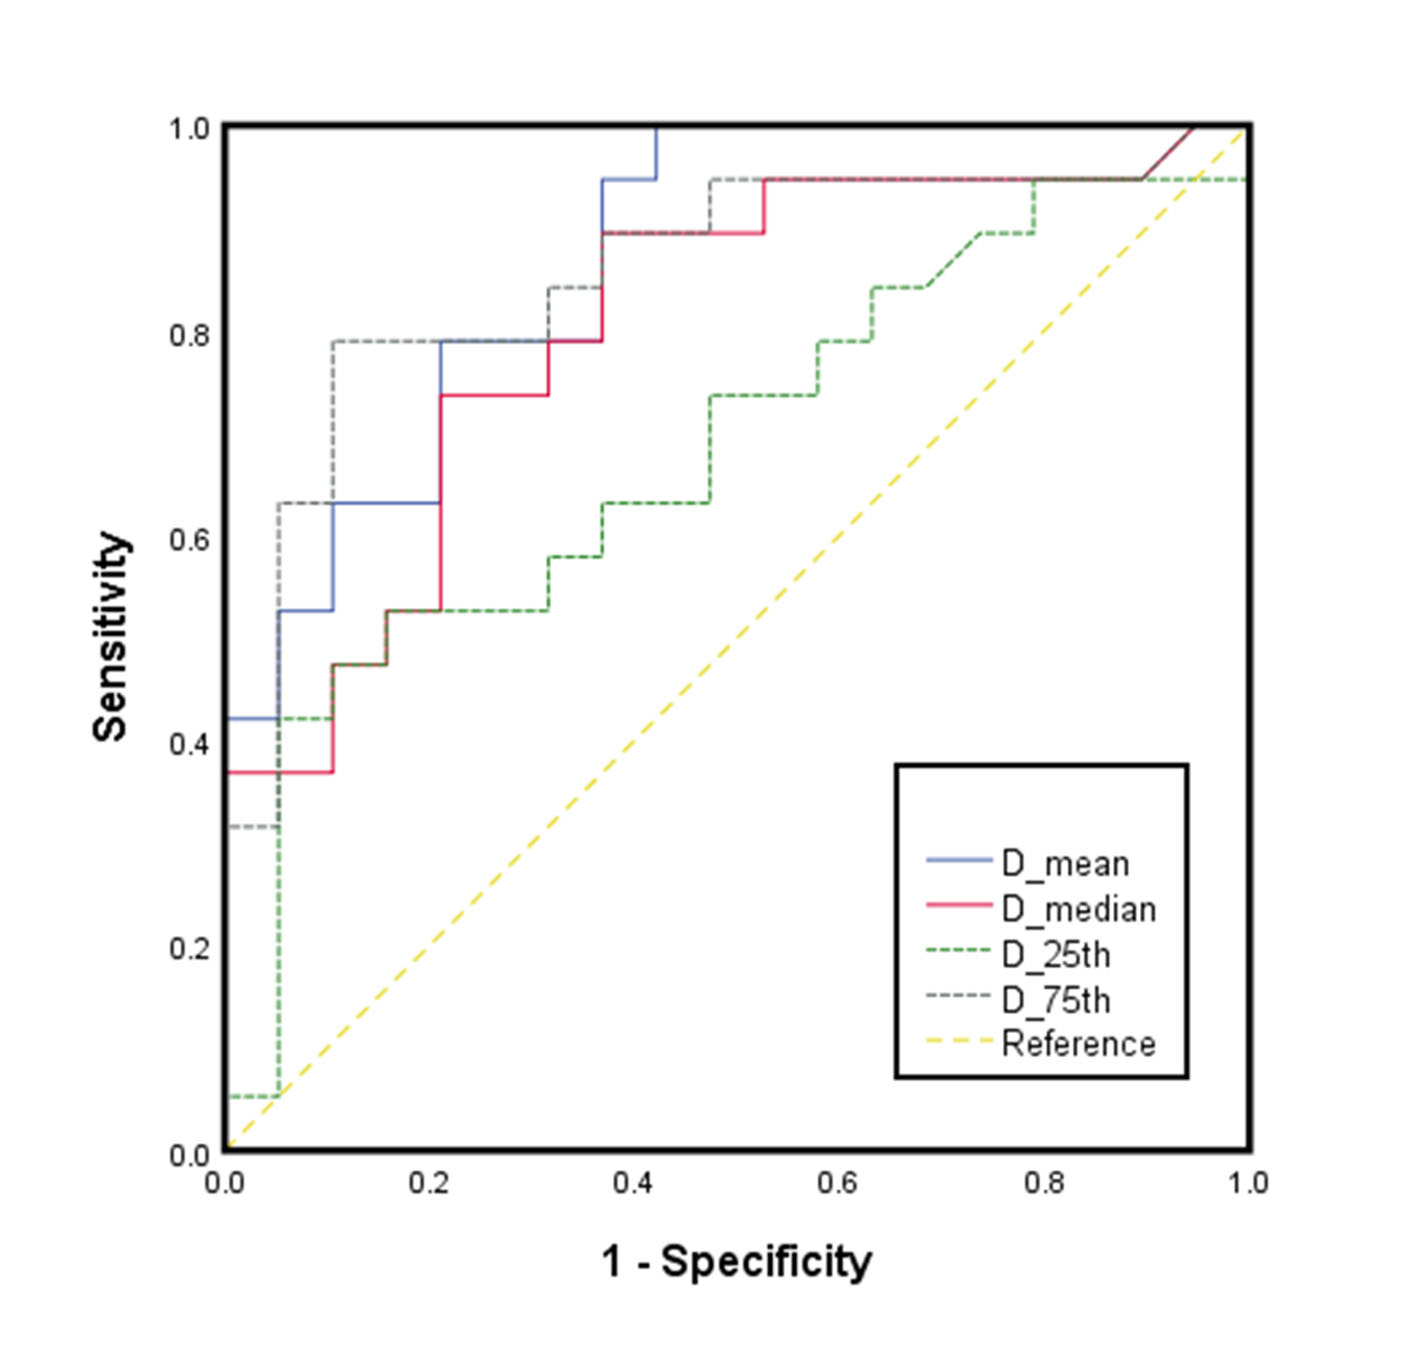
ROC curves for D map metrics.
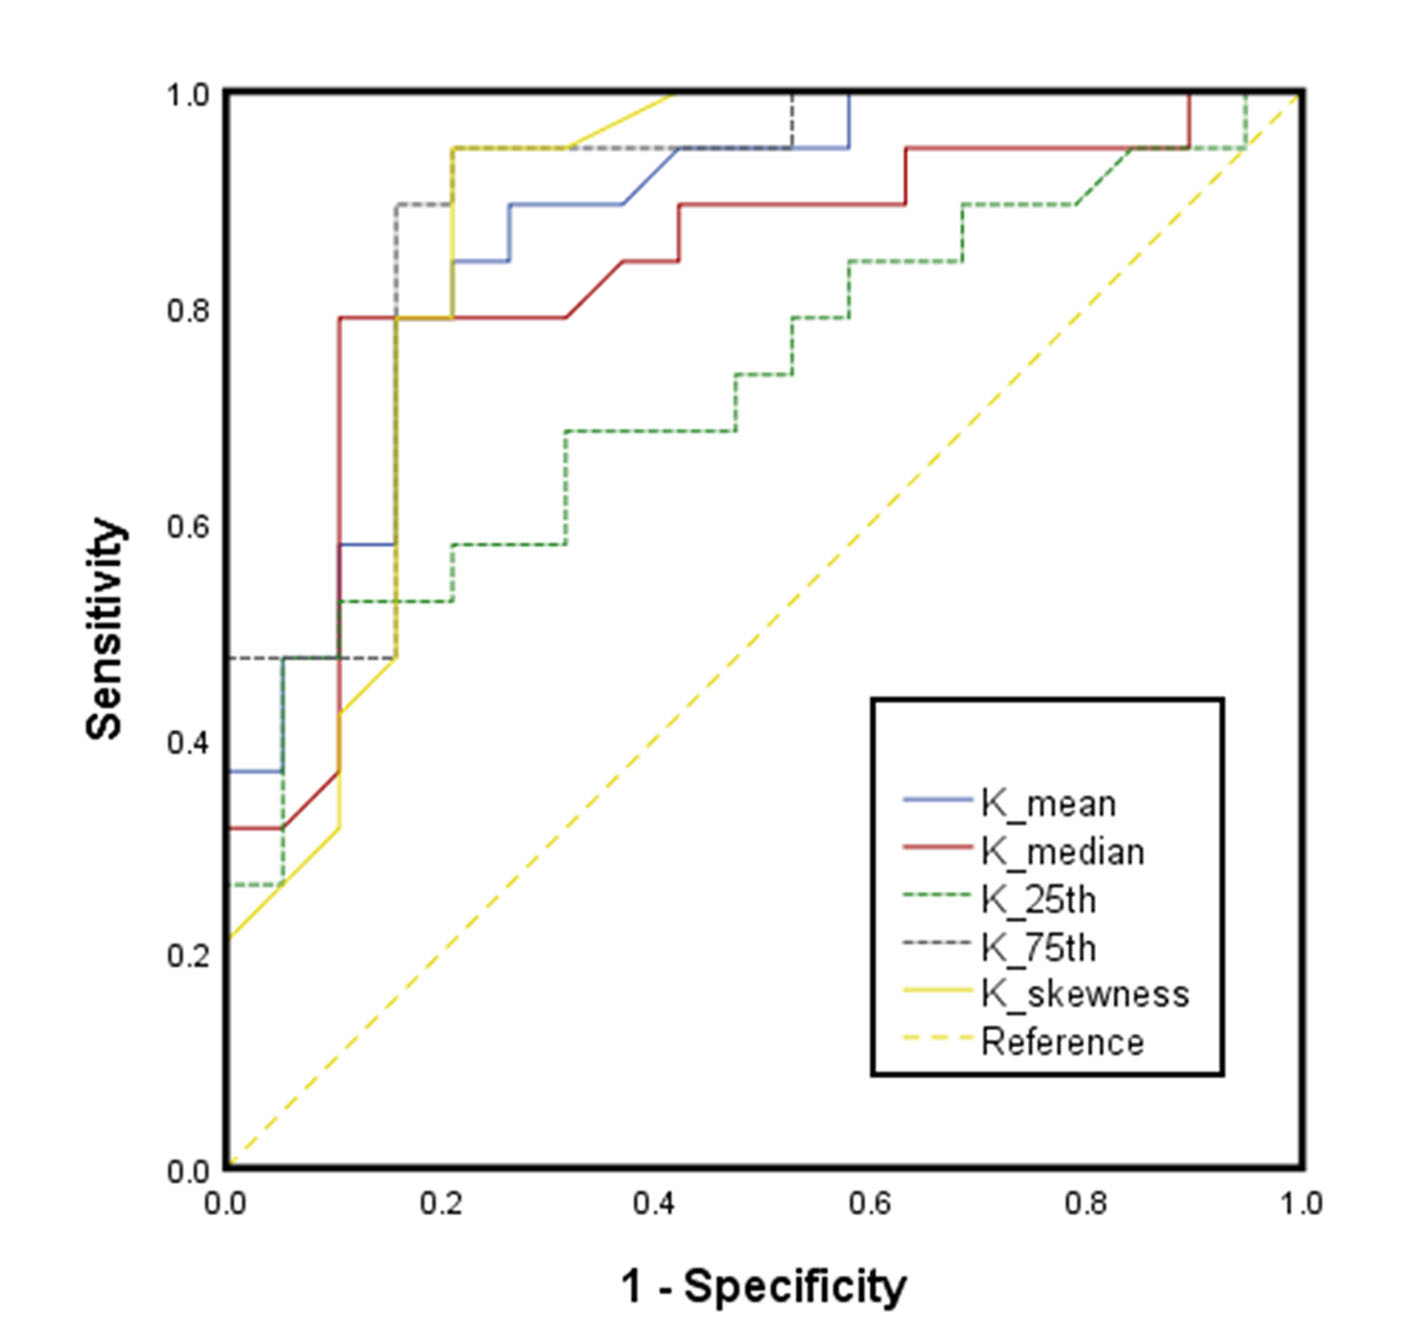
ROC curves for K map metrics.