2764
Acute and chronic rifampicin effect on gadoxetate uptake in rats using gadoxetate DCE-MRI1Antaros Medical, BioVenture Hub, Mölndal, Sweden, 2University of Sheffield, Sheffield, United Kingdom, 3University of Manchester, MANCHESTER, United Kingdom, 4Bayer Pharma AG, BERLIN, Germany, 5Bioxydyn, Manchester Science Park, MANCHESTER, United Kingdom
Synopsis
Drug Induced Liver Injury causes liver failure and impedes drug development, and Drug-Drug Interactions affect the pharmacokinetics of drug metabolism and excretion. Non-invasive biomarkers are needed to monitor these processes. We used gadoxetate DCE-MRI to measure clinical and high dose rifampicin effects on hepatocellular uptake in acute and chronic dosing regimens in rats. High dose rifampicin caused significantly reduced gadoxetate uptake acutely, whereas uptake rates returned to baseline values after chronic dosing. Similar but non-significant effects were seen at clinical dose levels. We demonstrated the potential of gadoxetate DCE-MRI to non-invasively assess drug-induced inhibition of hepatocellular transport and DDIs.
Introduction
Drug Induced Liver Injury (DILI) accounted for 11% of acute liver failures in the USA in 20131 and causes withdrawal of otherwise successful drugs when it appears in clinical studies. The few specific biomarkers available suffer from poor sensitivity to the degree of liver damage, or manifest after irreversible damage. Drug-Drug Interactions (DDIs) occur when one drug alters the pharmacokinetics of another drug and is a common problem for those taking multiple medications. New methods to assess transport function in vivo are needed.Gadoxetate is a clinically used contrast agent transported into the hepatocyte by Organic Anion Transporter Protein (OATP1/Oatp1) and excreted by Multidrug Resistance Associated protein (MRP2/Mrp2). Gadoxetate DCE-MRI consequently provides MR biomarkers with unique molecular specificity, exquisite sensitivity to transporter inhibition, and immediate availability in man. It was recently shown to detect acute effects of a clinical dose of rifampicin (RIF) on Oatp1 function in rats2.
The aim of the current study was to examine whether gadoxetate DCE-MRI can measure the effects of clinical and high dose RIF after acute and chronic treatment.
Methods
This study was approved by the Ethical Committee on Animal Experiments in Gothenburg, Sweden.Rifampicin (Orifarm, 300 mg capsules) was suspended in an 85% sugar solution (vehicle) for oral administration. Gadoxetate (Primovist, 0.25 mmol/ml, Bayer) was diluted 1:5 in saline, and dosed at 0.5 ml/kg i.v.
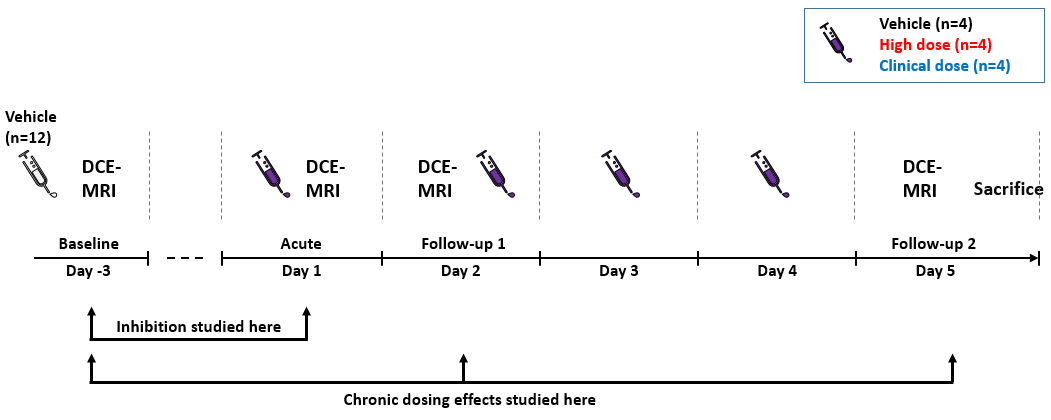
Male rats (Wistar Han, ~300g) were separated in three groups (n=4/group): vehicle (sugar solution), clinical RIF dose (10 mg/kg) and high RIF dose (67 mg/kg). The dose of 67 mg/kg was predicted to be the highest dose for which plasma AUC and Cmax were expected to be within the observed clinical range3. All animals received oral vehicle on day -3 (baseline) followed by once daily group specific oral dosing on days 1-4. Dosing was preceded by 2h fasting.
Rats were imaged at 4 timepoints. Baseline and acute imaging were performed 3h after oral dosing. The 3h interval was chosen for maximum liver RIF concentration (pilot study, data not shown). Day 2 and Day 5 follow-up imaging were performed 24h after the previous dose, i.e. immediately before the 2nd dose on day 2, and 24h after the last dose on day 5 (Figure 1).
Isoflurane anesthesia (~1.8-2.2% to maintain ~60 breaths/min) was used and breathing and temperature monitored (SA Instruments). The tail vein was cannulated to draw blood and administer contrast agent.
Animals were imaged at 7T (Bruker Biospec, PV 5.1) using a 72-mm transmit/receive volume coil. Two 2D IntraGateFLASH images covered spleen and liver, with navigator positioned over the heart (TR/TE 36/1.5 ms, FA 30°, matrix 192×192, FOV 60×60 mm2, slice thickness/separation 1.5/~5 mm).
Retrospective triggering was used to create frames of 1min resolution from the quiescent 70% of the respiratory cycle. Total acquisition time was 30 min. Contrast was injected during 13 sec, starting 4:49 min into the acquisition. Rats were sacrificed by cardiac puncture under anesthesia immediately after the experiment.
The mean signal from manually drawn regions in liver and spleen were used to calculate the change in relaxation rates induced by gadoxetate using the inverted signal equation for a spoiled gradient-echo in steady state. ROIs were drawn to exclude visible vasculature and collecting ducts. Hepatocellular uptake rate (khe) was then determined as described by Ziemian et al.4, with literature values for precontrast relaxation rates and volume fractions5.
The repeated measures ANOVA analysis with Bonferroni post hoc testing was used to evaluate acute and chronic effects of RIF on uptake rates (IBM SPSS Statistics, Armonk, USA).
Results & Discussion
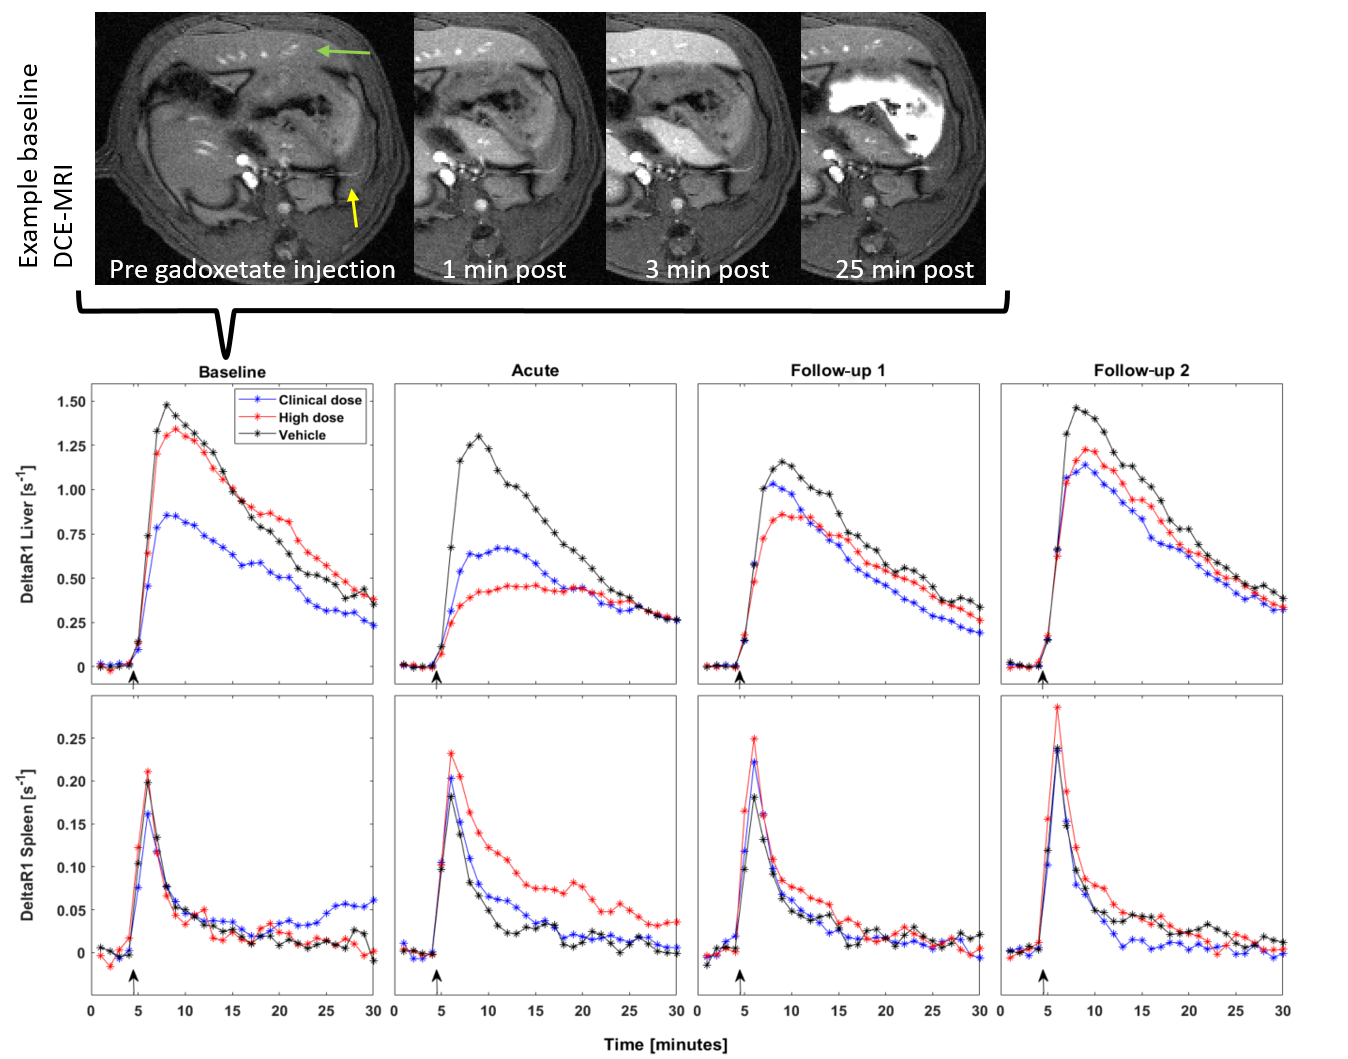
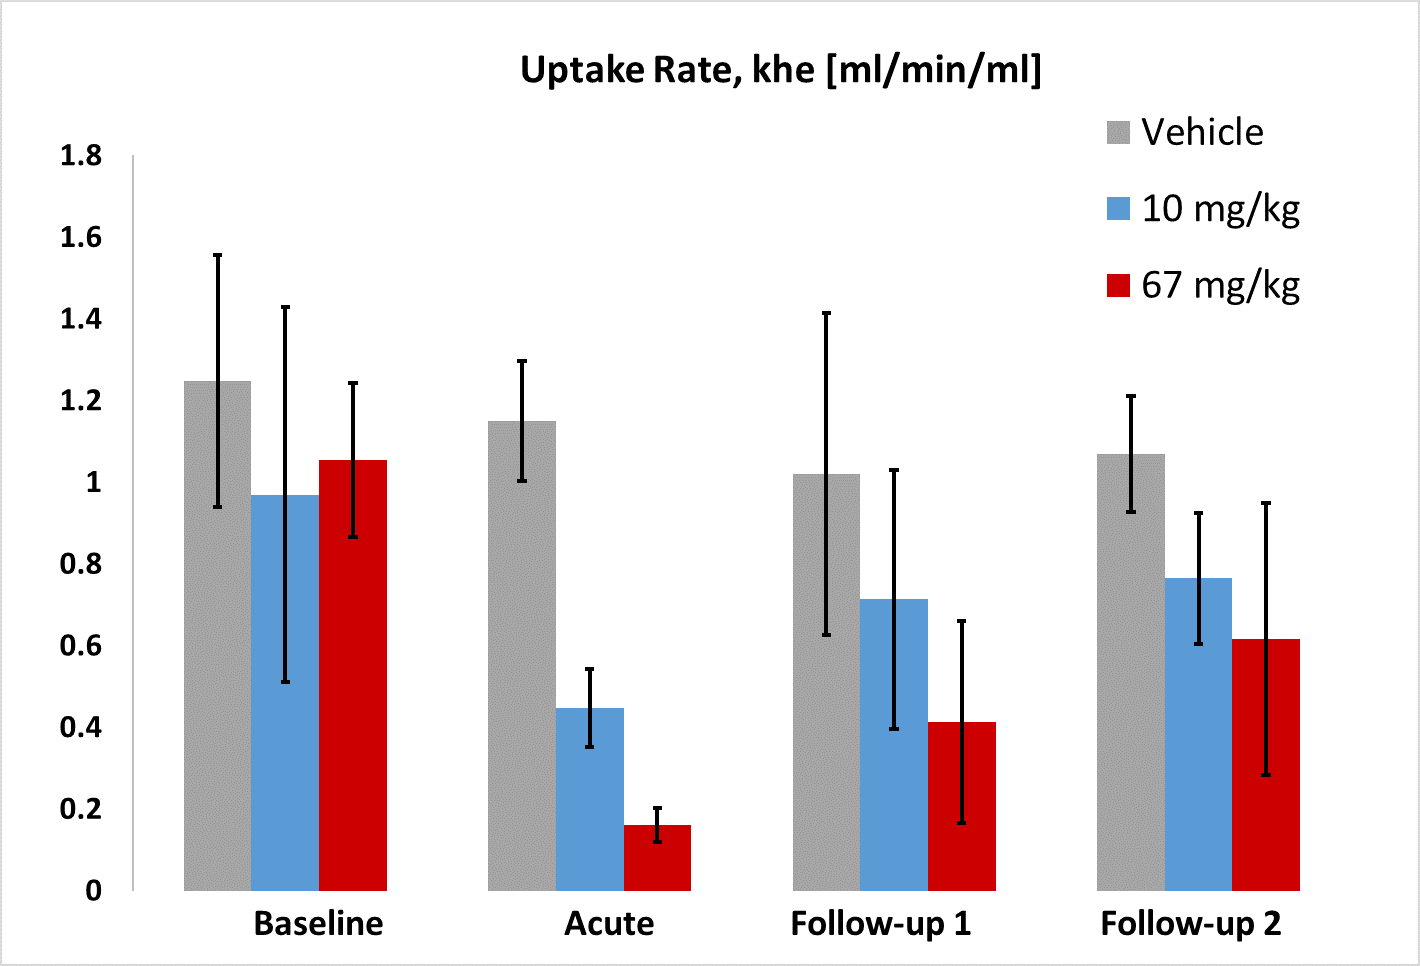
No adverse effects of rifampicin treatment or imaging were detected by clinical observation.Figure 2 shows an example of gadoxetate uptake in liver and spleen, and the group mean deltaR1 over the DCE-MRI experiments. The effects of rifampicin on uptake rate are shown in Figure 3.
The acute high dose had a statistically significant inhibitory effect on the mean khe at day 1 (reduced by 85%, p=0.025). khe was not significantly different from baseline in the chronic dose setting (reduced by 61% and 42% on day 2 and 5, respectively, p>0.05). The clinical dose effects on khe were not statistically significant (p>0.05), although there was a tendency towards inhibition at day 1. No statistically significant effects on khe were seen in the vehicle treated group .
More than n=4/group may be required to further understand chronic dosing effects and dose dependency, and 24h may be too short to allow complete rifampicin clearance 24h post dosing. Studies to evaluate hepatic rifampicin clearance and/or increased post dosing DCE-MRI interval are currently planned.
Conclusion
This is the first study to examine the effects of both clinical and high dose rifampicin after chronic dosing.Our results demonstrate the potential of gadoxetate DCE-MRI to non-invasively assess drug-induced inhibition of hepatocellular transport and Drug-Drug interactions. The method also shows sensitivity to dose-dependent effects.
The uptake rate tended to return to baseline values in the chronic dosing regime.
Acknowledgements
The research leading to these results received funding from the Innovative Medicines Initiatives 2 Joint Undertaking under grant agreement No 116106. This Joint Undertaking receives support from the European Union’s Horizon 2020 research and innovation programme and EFPIAReferences
1. Reuben A. et al. Outcomes in adults with acute liver failure between 1998 and 2013: an observational cohort study. Ann. Intern. Med. 164, 724–732 , 2016
2. Karageorgis A. et al. A multi-center preclinical study of gadoxetate DCE-MRI in rats as a biomarker of drug induced inhibition of liver transporter function. PLoS ONE 13(5): e0197213. https://doi.org/10.1371/journal.pone.0197213 , 2018
3. Abulfathi A.A. et al. Clinical Pharmacokinetics and Pharmacodynamics of Rifampicin in Human Tuberculosis. Clin Pharmacokinet 58, 1103–1129 (2019). https://doi.org/10.1007/s40262-019-00764-2
4. Ziemian S et al., Ex vivo gadoxetate relaxivities in rat liver tissue and blood at five magnetic field strengths from 1.41 to 7 T. NMR in Biomedicine. 2020;e4401. https://doi.org/10.1002/nbm.4401
5. Waterton J, Survey of water proton longitudinal relaxation in liver in vivo, submitted to ISMRM 2021
Figures