2763
Multiparametric magnetic resonance imaging of liver regeneration in rabbits with warm ischemia-reperfusion injury1First Central Clinical College of Tianjin Medical University, Tianjin, China, 2Department of Radiology, Tianjin First Central Hospital, Tianjin, China, 3Department of Transplantation, Tianjin First Central Hospital, Tianjin, China, 4MR Collaboration, Siemens Healthcare, Beijing, China, 5Siemens Healthcare GmbH, Erlangen, Germany
Synopsis
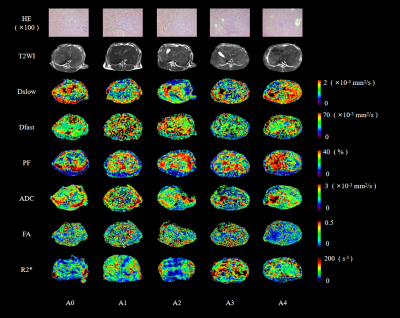
Multiparametric magnetic resonance imaging (MRI) provides various noninvasive and quantitative diagnostic information. This study assessed the value of multiparametric MRI in liver regeneration after warm ischemic-reperfusion injury (WIRI) in a rabbit model with different warm ischemia and reperfusion times. The results showed that the tissue diffusivity (Dslow), pseudo-diffusion coefficient (Dfast), perfusion fraction (PF), apparent diffusion coefficient (ADC), fractional anisotropy (FA), and R2* maps reflected changes in hepatic microcirculation perfusion, micro-dispersion, and oxygenation of hepatic WIRI after partial hepatectomy. Liver regeneration capacities were enhanced when warm ischemia times were 30 minutes or less; however, they were diminished after 30 minutes.
Introduction
Liver regenerative capacities after resection are sensitive to warm ischemia-reperfusion injury (WIRI)1-3. Although serum analytes have been considered reliable liver function indicators, 3D spatial distributions after liver injury generate informative data. Recently, multiparametric magnetic resonance imaging (MRI) has shown promise in assessing hepatic regenerative capacities after various WIRI intensities 4-7. This study aimed to (1) obtain liver volumes and imaging characteristics after various WIRIs using multiparametric MRI, including routine MR, intravoxel incoherent motion (IVIM), diffusion tensor imaging (DTI), and blood oxygenation level-dependent (BOLD) MRI at different reperfusion times; (2) investigate WIRI effects on liver regeneration after partial hepatectomy in a rabbit model; and (3) explore corresponding mechanisms.Methods
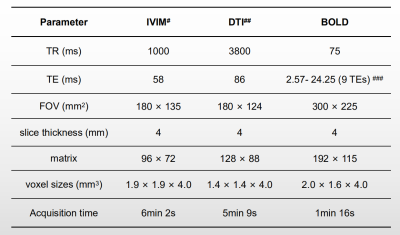
Thirty New Zealand white rabbits were randomly divided into 5 groups (n=6, each group), including a sham operation (A0) and four operation (A1-A4) groups with different warm ischemia times (10, 20, 30, and 40 min, respectively). All rabbits underwent hepatic caudate lobectomy and MRI examinations. Routine MRI, IVIM, DTI, and BOLD MRI examinations were subsequently performed at different time points (6h, 3d, 7d, 14d, and 30d after reperfusion, respectively). After the last MRI examination, venous blood samples were collected from all rabbits. Then, the rabbits were euthanized to obtain liver specimens for biochemical and histopathologic analyses. All MRI examinations were performed on a 3-Tesla MR scanner (MAGNETOM Trio a Tim system, Siemens Healthcare, Erlangen, Germany) with a 6-channel phased-array body coil. The functional MR imaging parameters are detailed in Figure 1. Quantitative parameters (including ADC, Dslow, Dfast, PF, FA, and R2*) and the liver volumes of all animals were measured. The corresponding liver regeneration ratios (LRRs) were also calculated. Serum ALT, AST, and LDH levels and frozen liver tissue MDA, SOD, MPO, TNF-α, IL-6, and PCNA were measured. Histopathologic tissue sections of liver were also obtained. Repeated measures ANOVA was used to evaluate MR parameter changes and LRRs of each group at different warm ischemia and reperfusion times. The least significant difference (LSD) method was used to make comparisons within the groups. The Pearson or Spearman correlation analysis was used to analyze associations between each parameter and LRR. Alternatively, correlations were assessed between each parameter and the biochemical indicators. A P <0.05 was considered statistically significant.Results
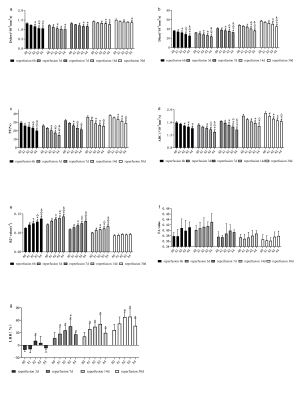
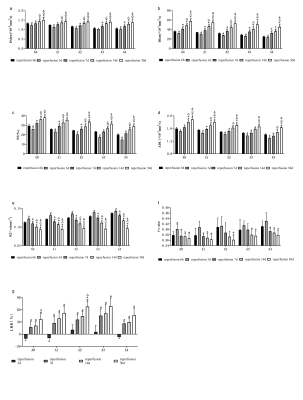
(1) Using similar reperfusion times, Dslow, Dfast, PF, and ADC of the A0-A4 groups showed downward trends (Figure. 2a, 2b, 2c, and 2d, respectively). The R2* values tended to increase in the A0-A4 group except at 30d post operations, and on the 30th day, differences among groups with different warm ischemia times were not different (Figure. 2e). The FA reperfusion times were not statistically different among the groups (Figure. 2f). The LRRs increased initially and decreased with prolonged warm reperfusion times (Figure. 2g).(2) At each ischemic time, the Dslow, Dfast, PF, and ADC values first decreased \and then gradually increased with prolonged reperfusion times. The lowest value was found 3d post operations (Figure. 3a, 3b, 3c, and 3d, respectively). The R2* and FA values increased initially and then decreased (Figure. 3e, and 3f). Similarly, peak values were observed 3d post operations. The LRRs showed an obvious upward trend with reperfusion time durations (Figure. 3g).
(3)Weak negative correlations were found between the Dslow (3d, 30d), Dfast (7d), P (7d), ADC (7d, 30d), and LRR values at similar reperfusion times. Dslow was moderately correlated with LRR (all P <0.05) 7d post operations. R2* values were moderately correlated with LRRs except for the A4 group (P <0.05). Dslow, Dfast, PF, and ADC values were positively correlated with LRRs, at similar ischemia times (all P <0.05). FA (expect for A3) and R2* values were negatively correlated with LRRs (both P <0.05).
(4)Dslow, Dfast, PF, and ADC values were negatively correlated with AST and ALT activities (all P <0.05). ADC was positively correlated with PCNA (P = 0.044). FA was negatively correlated with IL-6 (P = 0.045). No correlations were found between R2* values and biochemical indices 30d post operations (all P > 0.05).
Discussion/Conclusions
Multiparametric MRI could detect changes in hepatic microcirculation perfusion, micro-dispersion, and oxygenation levels after WIRI. This non-invasive and quantitative method detected hepatic regeneration after partial hepatectomy in rabbits. WIRI (≤30 min) promoted liver regeneration, which became more obvious as WIRI times increased. Liver regeneration decreased considerably after 30 min of WIRI.Acknowledgements
NoneReferences
1.Jay CL, Lyuksemburg V, Ladner DP, et al. Ischemic cholangiopathy after controlled donation after cardiac death liver transplantation: a meta-analysis. ANN SURG 2011;253(2):259-264.
2. Teoh NC, Farrell GC. Hepatic ischemia reperfusion injury: pathogenic mechanisms and basis for hepatoprotection. J Gastroenterol Hepatol 2003;18(8):891-902.
3. Jaeschke H, Woolbright BL. Current strategies to minimize hepatic ischemia-reperfusion injury by targeting reactive oxygen species. Transplant Rev (Orlando) 2012;26(2):103-114.
4. Wong OL, Leung T, Lo GG, Yuan J, Li WW, Noseworthy MD. Intrasession and Intersession Repeatability of Diffusion Tensor Imaging in Healthy Human Liver. J Comput Assist Tomogr 2017;41(4):578-585.
5. Wengler K, Wang J, Serrano SM, et al. Mapping hepatic blood oxygenation by quantitative BOLD (qBOLD) MRI. MAGN RESON MED 2019;81(5):3272-3282.
6. Andreou A, Koh DM, Collins DJ, et al. Measurement reproducibility of perfusion fraction and pseudodiffusion coefficient derived by intravoxel incoherent motion diffusion-weighted MR imaging in normal liver and metastases. EUR RADIOL 2013;23(2):428-434.
7. Ji Q, Chu ZQ, Ren T, et al. Multiparametric functional magnetic resonance imaging for evaluation of hepatic warm ischemia-reperfusion injury in a rabbit model. BMC GASTROENTEROL 2017;17(1):161.
Figures

Figure 1.Magnetic Resonance Imaging Acquisition Parameters.
# 8 b values (0, 50, 100, 150, 200, 400, 600, and 800 s/mm2) were applied in 3 orthogonal directions for IVIM.
## 2 b values (0 and 500 s/mm2) were applied in 12 diffusion gradient directions for DTI.
### 9 echoes were used for BOLD MRI: 2.57, 5.23, 7.52, 9.81, 12.1, 14.39, 16.68, 18.97, and 24.25ms.


