2761
T1 and T2 mapping for Monitoring Liver Regeneration in Normal and Cirrhotic Liver Rats after Partial Hepatectomy1Radiology Department, Tianjin First Center Hospital, TIANJIN, China, 2MR Collaboration, Siemens Healthcare Ltd., BEIJING, China
Synopsis
In this study, we used T1 and T2 mapping to quantify the microscopic changes of residual liver in normal and cirrhotic liver rats after partial hepatectomy (PH). The results showed that liver regeneration activity was more active in the rats with 70% PH than 30% PH, consistent with changes in T1 and T2 values. Furthermore, regeneration in cirrhotic liver was slower than in normal liver. However, in the process of regeneration, liver cirrhosis may be reversed to different degrees. The results suggested that T1 and T2 mapping can be used to assess liver regeneration after PH.
Introduction
Partial hepatectomy (PH) is an important treatment method for patients with liver tumors and is a vital step in living-donor liver transplantation [1]. Liver regeneration depends on the extent of hepatectomy; chronic liver disease or cirrhosis affect this process [2、3]. Residual liver regeneration relates to prognosis in liver tumor patients, donors, and recipients. T1 and T2 relaxation times determine generation of contrast in MRI, reflecting tissue properties, e.g., macromolecular composition and water content [4]. We aimed to elucidate the relationship between T1 and T2 relaxation times of remnant liver and the degree of liver regeneration in normal and cirrhotic liver rats after PH.Materials and methods
Thirty-six rats were divided into four groups: 70% PH (n=10), 30% PH (n=10), cirrhotic liver rats with 30% PH (30% cPH, n=10), and the controls (n=6). All underwent MRIs on a 3T MR scanner (MAGNETOM Prisma, Siemens Healthcare, Erlangen, Germany) with an 8-channel animal coil (Chenguang, Shanghai, China). MRIs were conducted at multiple time points: before PH, at baseline, and at days 1, 2, 3, 5, 7, 14, and 21 after surgery. The T1 map was acquired using a 3D gradient echo sequence with the volumetric interpolated breath-hold examination (VIBE) sequence with dual-flip-angle method. Sequence parameters were: TR = 6.30 ms, TE = 2.88 ms, Flip angles = 3°and 12°, bandwidth = 300 Hz/px, FOV = 120 × 120 mm2, slice thickness = 3 mm, and voxel size = 0.6 × 0.6 × 3 mm3. T2 mapping was acquired using a multi-echo spin echo sequence, with parameters: TR = 2000 ms, 6 TEs = 13/26/39/52/65/76 ms, bandwidth = 201Hz/px , FOV = 120 × 120 mm2, slice thickness = 3 mm, and voxel size = 0.5 × 0.5 × 3 mm3. Parametric T1 and T2 maps were generated inline after data acquisition using Maplt software (Siemens Healthcare, Erlangen, Germany). Liver T1 and T2 values and different time points were compared among the groups using one-way ANOVA with Fisher’s least significant difference (LSD) test. P<0.05 indicated statistical significance.Results
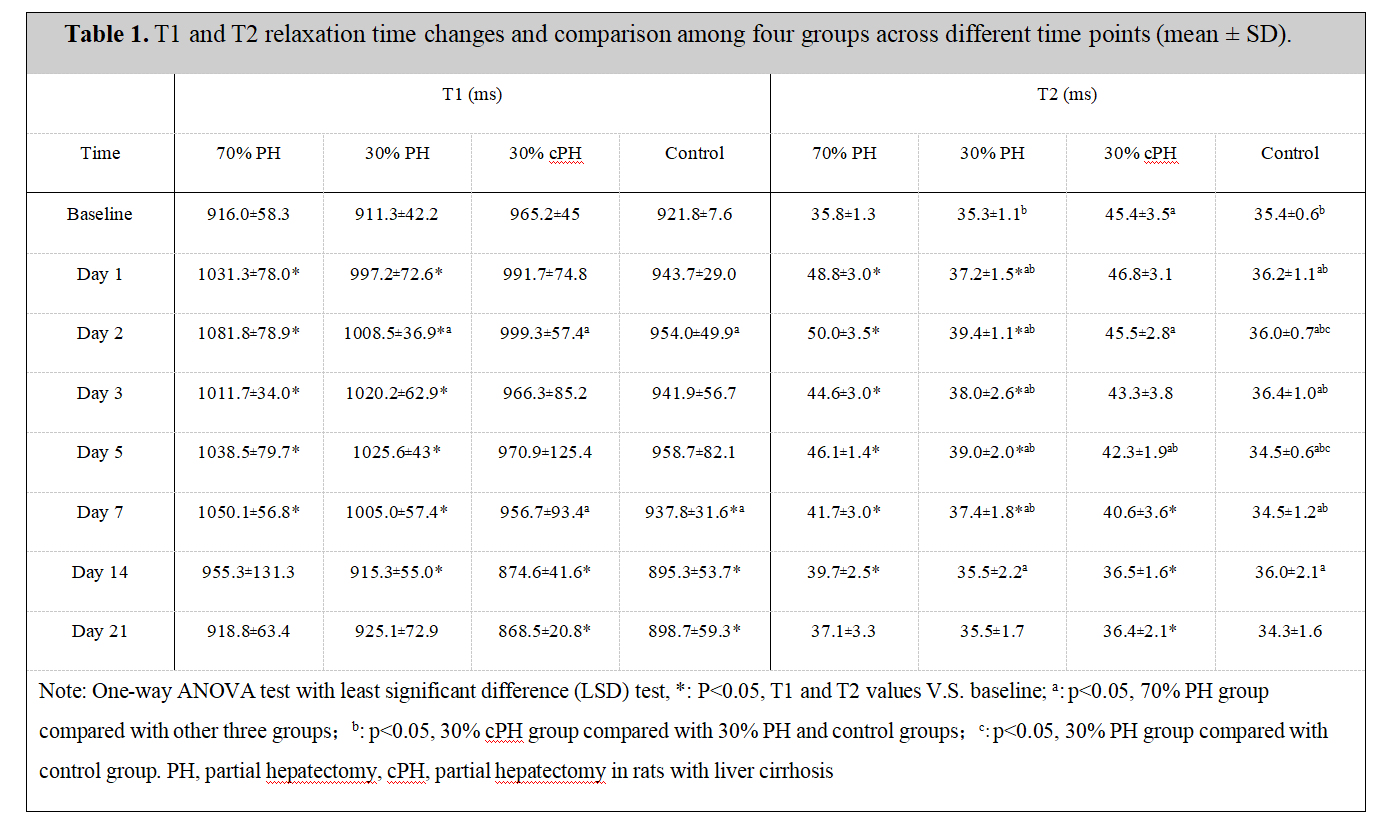
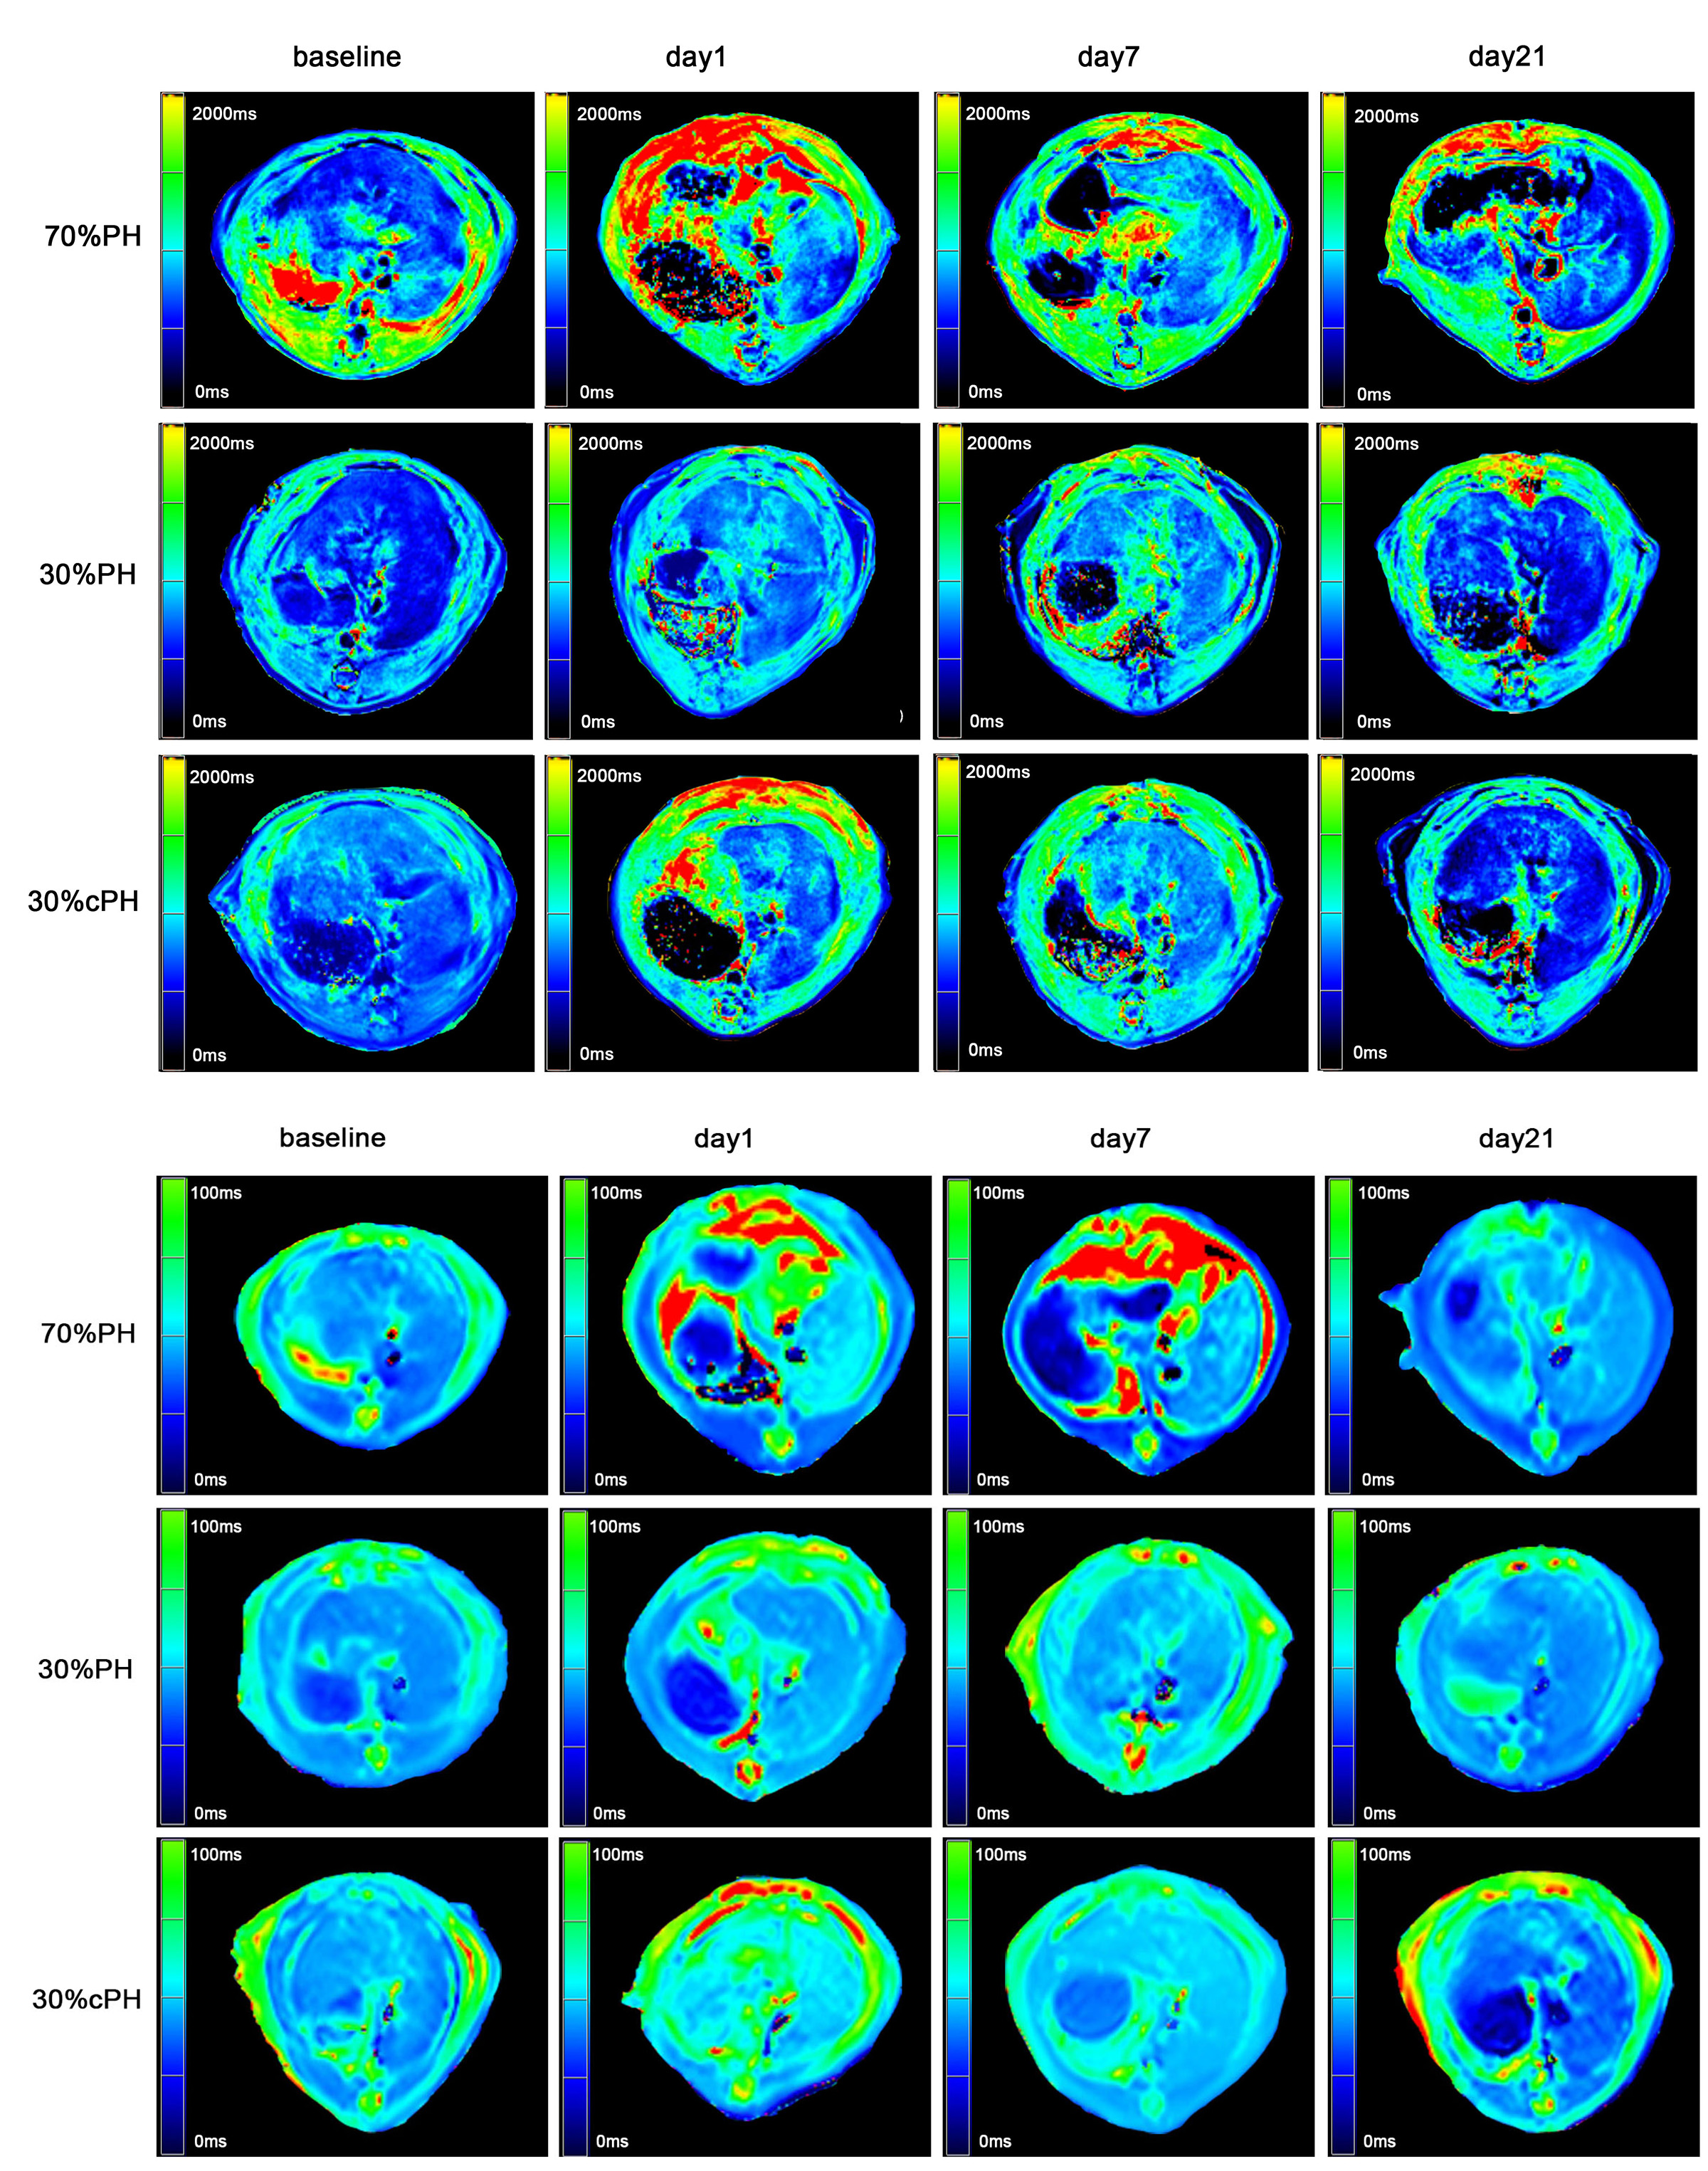
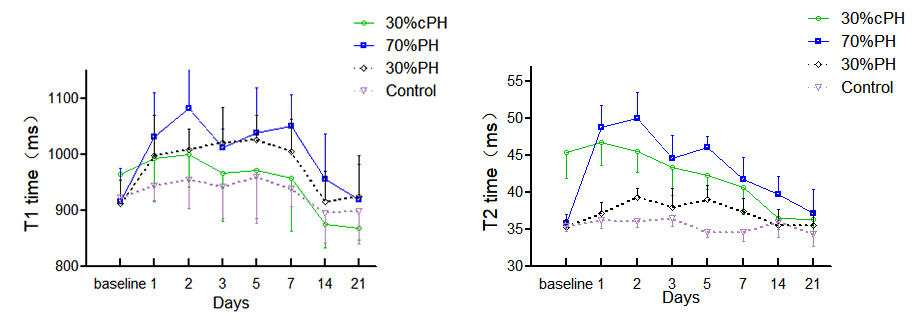
Three rats in the 70% PH group and three cirrhotic rats died during modeling. Figure 1 shows representative parametric T1 and T2 maps for one rat with 30% PH, 70% PH, and 30% cPH. T1 and T2 relaxation times in the 30% PH and 70% PH groups increased after hepatectomy, plateaued, then converged toward the baseline (Table 1, Fig 2). T1 and T2 in the 30% cPH group increased on days 1 and 2 before decreasing to less than baseline (Fig 2).The increase in T1 was significant for animals after 70% PH on days 1 - 7 (all P<0.05), returning to baseline after day 14 (both P>0.05). On day 2, the 70% PH group showed significant differences in T1 relaxation time compared to the remaining groups (all P<0.05), and at day 7, was different from the 30% cPH and control groups (both P<0.05).T2 relaxation time was significantly increased in the 70% PH and 30% PH groups compared to baseline (Table 1). The rats after 70% PH showed a significant difference in T2 from the 30% PH and control groups (days 1 - 14, P<0.05) and from the 30% cPH group on days 2, 7, and 14 (all P<0.05) .In the 30% cPH group, T1 and T2 times were increased compared to the control group at baseline (P<0.05) (Table 1). The 30% cPH group showed significant differences in T1 relaxation time on days 14 and 21 compared to baseline (both P<0.05). The 30% cPH group showed a significantly different T2 relaxation time at baseline compared to days 7, 14, and 21 (all P<0.05) and 30% PH on days 1 - 7 (all P<0.05). A difference was seen compared to the control group on days 1 - 14 (all P<0.05); also, the T2 values for 30% cPH were significantly lower than at baseline after day 7 (all P<0.05).Discussion
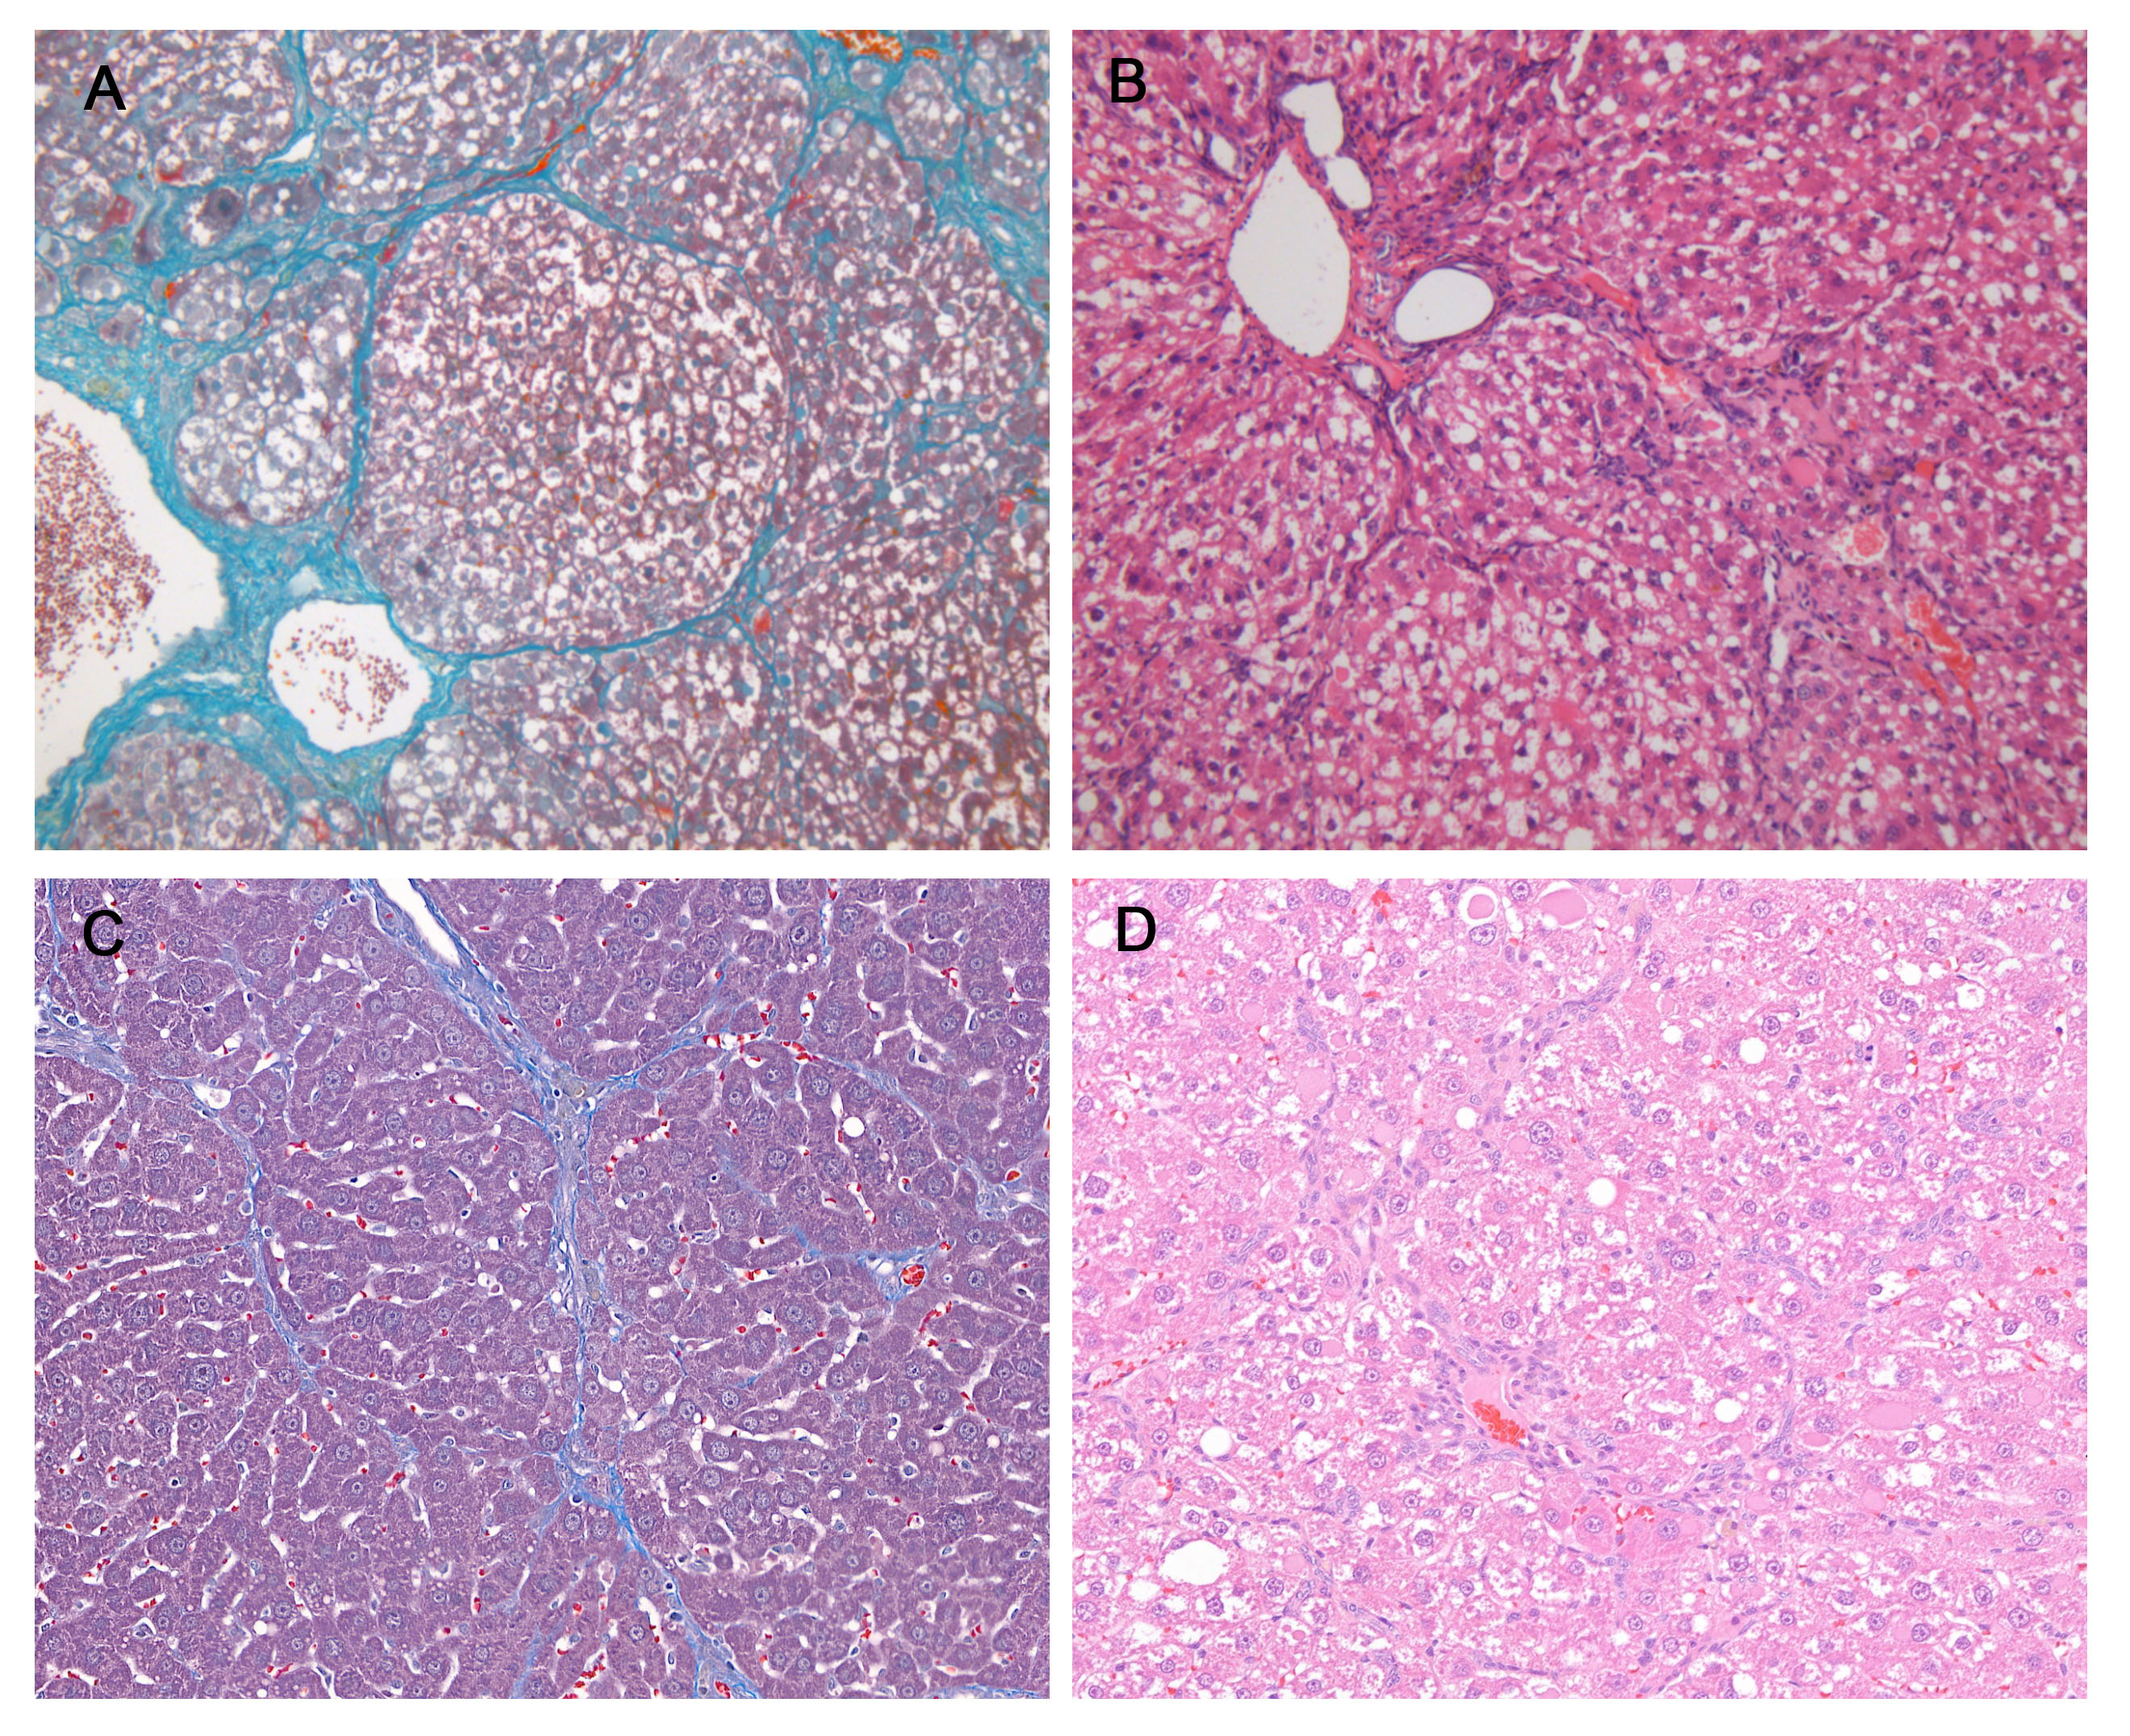
Changes in T1 and T2 across different time points represented activity trends in residual liver parenchyma that could determine liver regeneration activity. T1 and T2 values in the 70% PH group significantly increased after PH, and there were significant differences at multiple time points and in the 30% group, suggesting that a higher ratio of liver resection led to more obvious liver regeneration and higher T1 and T2 values.T1 and T2 values in cirrhotic liver were higher than in normal liver, possibly due to structural changes in liver tissue, hepatocyte edema, over-deposition of extracellular matrix fiber, and inflammation in cirrhosis [8、9]. However, T1 and T2 did not increase significantly after PH, possibly due to slow regeneration of residual liver in cirrhotic rats [10]. T1 and T2 values of postoperative residual liver were lower than preoperative values, possibly because regeneration of residual liver after partial resection would reverse the structure in early cirrhosis [11].Conclusions
T1 and T2 mapping demonstrated the potential for assessing changes in residual liver parenchyma after PH, indicating liver regeneration. This was dependent on the extent of the hepatectomy; regeneration of residual liver was slow. The degree of cirrhosis may be reversed after 30% PH.Acknowledgements
This study was supported in part by grants from The National Natural Science Foundation of China ( 81901710 ) and Key Laboratory of Organ Transplantation of TianjinReferences
1. Clavien PA, Oberkofler CE, Raptis DA, Lehmann K, Rickenbacher A, El-Badry AM. What is critical for liver surgery and partial liver transplantation: size or quality? Hepatology. 2010;52(2):715–29.
2. Michelle M, Kasper JA, Anders RK, et al. Liver regeneration is dependent on the extent of hepatectomy[J]. Journal of Surgical Research, 2016,205(1).
3. Lin TY, Chen CC. Metabolic function and regeneration of cirrhotic and non-cirrhotic liver after hepatic lobectomy in man[J]. Ann Surg. 1965;162(6):959-972.
4. Eberhardt C, Wurnig MC, Wirsching A, et al. Prediction of small for size syndrome after extended hepatectomy: Tissue characterization by relaxometry, diffusion weighted magnetic resonance imaging and magnetization transfer[J]. PLoS One, 2018;13(2):e0192847.
5. Sostman HD, Gore JC, Flye MW, et al. Time course and mechanism of alterations in proton relaxation during liver regeneration in the rat[J]. Hepatology, 1985;5(4):538-543.
6. Patrizio G, Pietroletti R, Pavone P, et al. An animal model for the study of liver regeneration by magnetic resonance imaging[J]. La Radiologia medica, 1990;79(5):453-457.
7. Miyaoka Y, Ebato K, Kato H, et al. Hypertrophy and unconventional cell division of hepatocytes underlie liver regeneration[J]. Current biology: CB., 2012;22(13):1166-75.
8. Cassinotto C, Feldis M, Vergniol J, et a1. MR relaxometry in chronic liver diseases:Comparison of T1 mapping, T2 mapping, and diffusion-weighted imaging for assessing cirrhosis diagnosis and severity[J].Eur J Radiol, 2015,84(8):1459-65.
9. Chow AM, Gao DS, Fan SJ, et al. Measurement of liver TI and T2 relaxation times in an experimental mouse model of liver fibrosis [J] . J Magn Reson Imaging, 2012,36(1):152-158.
10. Aierken Y, Kong LK, Li B, et al. Liver fibrosis is a major risk factor for liver regeneration: A comparison between healthy and fibrotic liver[J]. Medicine, 2020,99(22):e20003-e20003.
11. Benyon RC, Iredale JP. Is liver fibrosis reversible? Gut, 2000;46(4):443-446.
Figures