2758
Regional variation of liver surface nodularity scores for evaluating hepatic fibrosis on a single axial MR image
Tae-Hoon Kim1, Youe Ree Kim2,3, Chang-Won Jeong1, Chungsub Lee1, SiHyeong Noh1, Ji Eon Kim1, Young Hwan Lee2,3, and Kwon-Ha Yoon2,3
1Medical Convergence Research Center, Wonkwang University, Iksan, Korea, Republic of, 2Radiology, Wonkwang University School of Medicine, Iksan, Korea, Republic of, 3Radiology, Wonkwang University Hospital, Iksan, Korea, Republic of
1Medical Convergence Research Center, Wonkwang University, Iksan, Korea, Republic of, 2Radiology, Wonkwang University School of Medicine, Iksan, Korea, Republic of, 3Radiology, Wonkwang University Hospital, Iksan, Korea, Republic of
Synopsis
The assessment of liver surface nodularity (LSN) is emerging importance to diagnose hepatic fibrotic changes in clinical. The imaging techniques MRI and CT are gold-standard methods to estimate LSN scores. However, in clinical practice, the manual LSN assessment of whole liver is time-consuming. Therefore, it is powerful for assessing LSN score from a single slice image instead of whole liver images. This study compared the regional variation of LSN score for assessing fibrotic changes on a single liver MR image in chronic liver disease (CLD).
Introduction
To diagnose and stage hepatic fibrotic and cirrhotic changes within the liver, the assessment of liver surface nodularity (LSN) is emerging importance in clinical. The imaging techniques MRI and CT are gold-standard methods to estimate LSN scores. The LSN can be measured on routine liver CT and MR images using post-processing software to generate a LSN score. However, in clinical practice, the manual LSN assessment of whole liver is time-consuming. Thus, it is powerful for assessing LSN score from a single slice instead of whole liver images. To our knowledge, no study has investigated one common measurement method to assess LSN value from a single slice MR image, which would be an enormous progress for the assessment of, for example, chronic hepatitis B and non-alcoholic fatty liver disease (NAFLD).Therefore, the purpose of this study was to compare regional variation of LSN score for assessing liver fibrosis on single axial liver MR images in chronic liver disease (CLD).
Subjects and Methods
Overall, histopathologically proven 123 subjects consisting of 111 CLD patients (mean age 41.8±11.2 years) and 12 normal controls (mean age 35.5±13.8 years) were enrolled. All the subjects divided to four groups (F0-F3) based on pathologic information: Group 1 (F0; normal control n=12), Group 2 (F1, n=9), Group 3 (F2, n=54), and Group 4 (F3, n=47). MR images were obtained from 3-T liver axial MR imaging with three-dimensional T1 high-resolution isotropic volume excitation (THRIVE) sequence. The processing procedures for quantifying LSN are as follows: bias field correction, semi-automatic liver boundary detection, liver segmentation; and LSN measurements with multipolynomial curve fitting (Fig. 1). Mean LSN score calculated as an averaged value measured from representative three slice images (see Fig. 2). And, to measure regional LSN scores on a single axial MR image, five different regions of interests (ROI1-5) were analyzed to measure LSN score as shown in Fig. 2. LSN scores among fibrosis grades in CLD were compared by using ANOVA with Tukey’s test. Weighting value (Lwn) of LSN scores in different ROIs was calculated as an averaged value derived from (Mean LSN / averaged LSN score in ROIn) within each group.Results
Mean LSN scores and regional LSN scores in each ROI were summarized in Table 1. Regional LSN scores on ROI1-3 are not significant different whereas the scores on ROI4 and ROI5 and mean LSN score were significant difference between fibrosis groups (ANOVA; ROI4 LSN p=0.006; ROI5 LSN p=0.004; mean LSN p<0.001, respectively). Figure 3 shows weighting values (Lwn) of each ROI derived from mean LSN score, and their Lwn values were listed in Table 2. For LSN scores in a single axial MR image, mean weighting values in ROIs were Lw1 0.864±0.048, Lw2 1.252±0.091, Lw3 0.972±0.038, Lw4 0.999±0.049 and Lw5 0.954±0.016, respectively. Especially, mean LSN scores showed the strong correlation with regional ROI4 and ROI5 scores (inferior region in right lobe, r=0.376; r=0.524), giving significant difference within fibrosis grades (Table 3). Thus, the regional LSN quantification can be a simple technique capable of detecting fibrotic changes as a single measurement region, and moreover, our data focusing on fibrosis grades of CLD can provide the evidence that LSN score is a useful quantitative imaging biomarker that can be used to diagnose and stage hepatic fibrosis.Conclusion
Regional LSN scores and their weighting values demonstrate regional variations in the liver. These findings would provide useful information for assessing the liver fibrosis. Moreover, the LSN scores in the inferior region of right lobe (ROI4-5) would be helpful for rapidly differentiating hepatic fibrosis in clinical practice as a single measurement region.Acknowledgements
This study was supported by the grants of the National Research Foundation of Korea (NRF) (2016M3A9A7918501) and the Korea Health Technology R&D Project through the Korea Health Industry Development Institute (KHIDI), funded by the Ministry of Health & Welfare (HI18C1216).References
- Smith, A. D. et al. Liver Surface Nodularity Quantification from Routine CT Images as a Biomarker for Detection and Evaluation of Cirrhosis. Radiology 2016; 280: 771-781.
- Pickhardt, P. J., Malecki, K., Kloke, J. & Lubner, M. G. Accuracy of Liver Surface Nodularity Quantification on MDCT as a Noninvasive Biomarker for Staging Hepatic Fibrosis. AJR Am. J. Roentgenol. 2016; 207: 1194-1199.
- Smith, A. D. et al. Liver Surface Nodularity Score Allows Prediction of Cirrhosis Decompensation and Death. Radiology 2017; 283: 711-722.
- Venkatesh, S. K. et al. Non-invasive detection of liver fibrosis: MR imaging features vs. MR elastography. Abdom. Radiol. 2015; 40: 766-775.
Figures
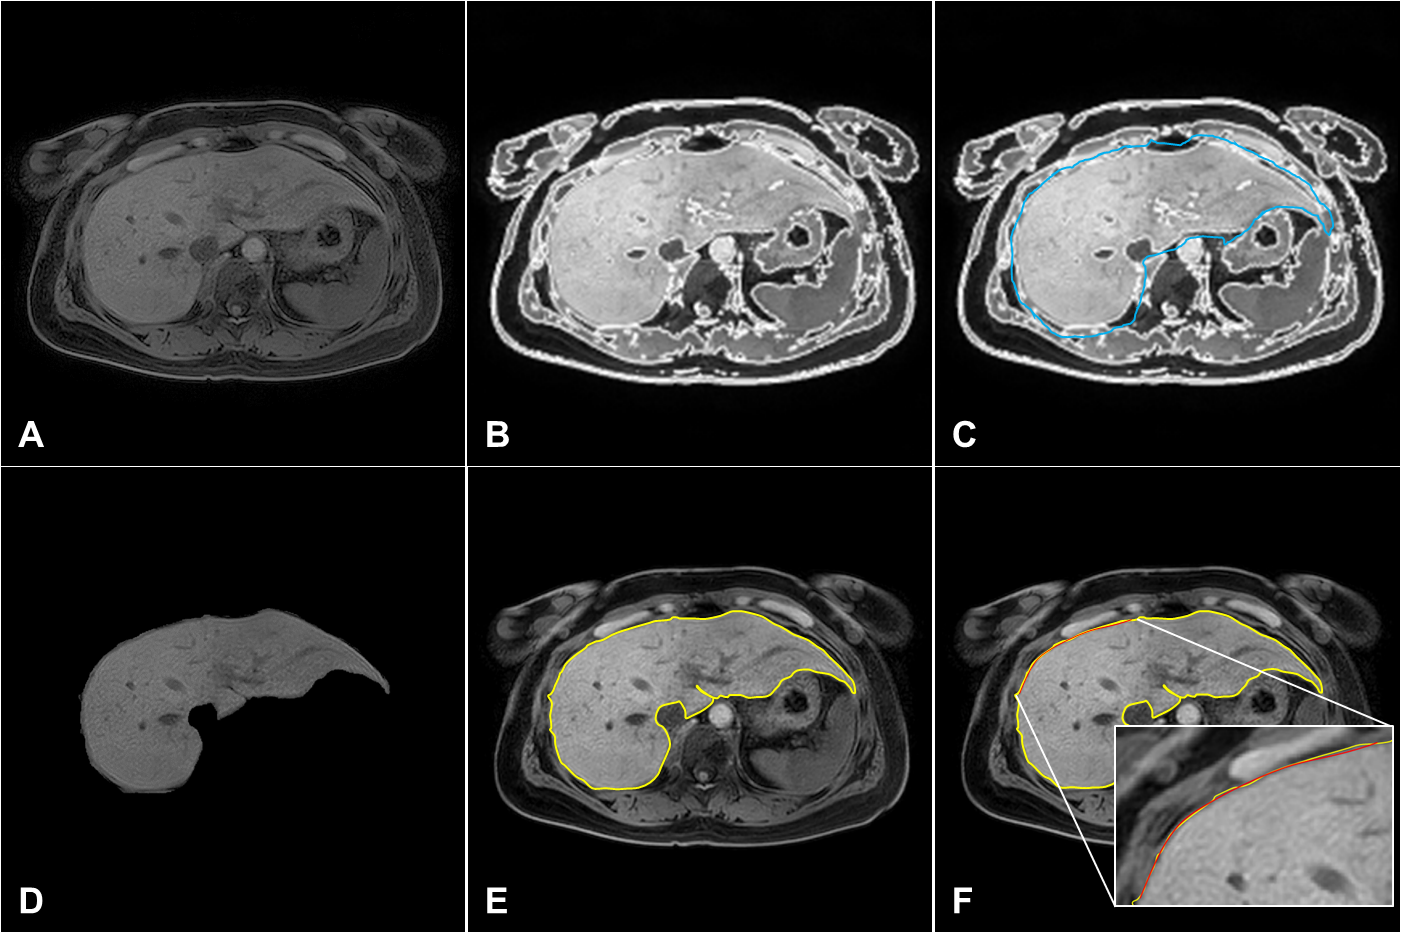
Figure 1. Representative
post-processing images for liver surface nodularity (LSN) quantification in a
CLD patient: (A) MRI data, (B) liver contour
detection, (C) ROI drawing,
(D) segmented ROI extraction, (E) final liver surface line (yellow-line) and (F) LSN measurement (curve-fitting line= red-line).
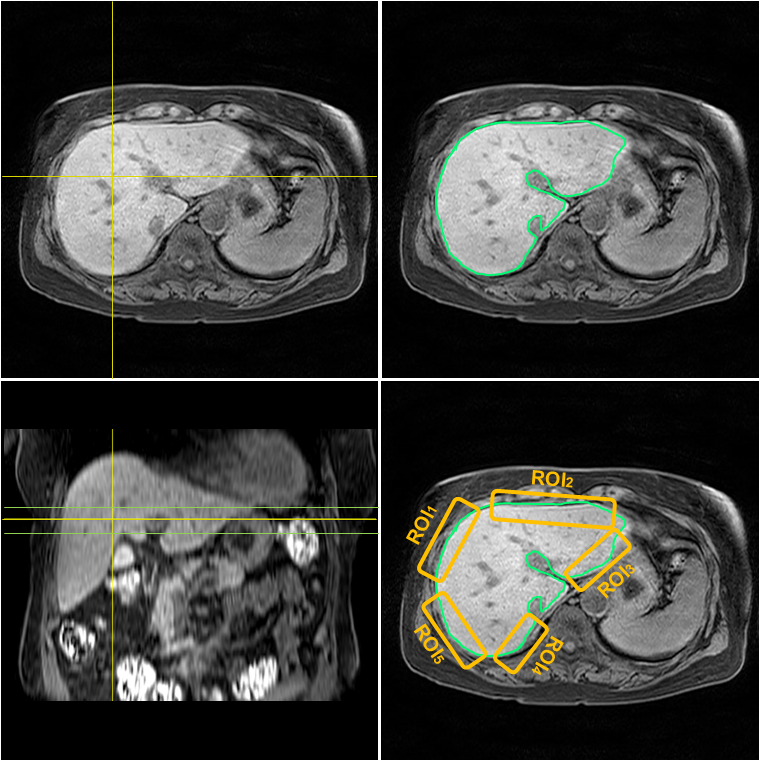
Figure 2. Schematic drawing for
selection of region of interests (ROIs). Regional LSN scores calculate from five
different ROIs on a single axial MR image. Mean
LSN score in each subject calculates from three slices (vertical lines as shown
in sagittal sectional image).
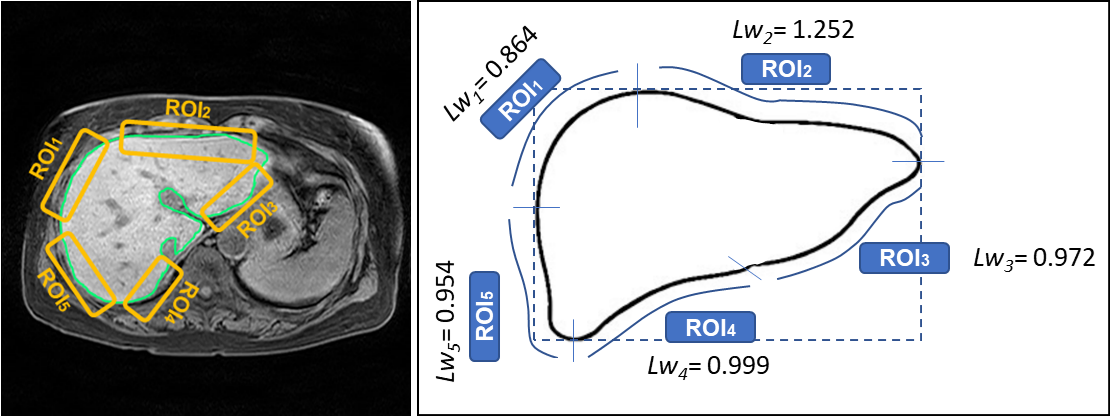
Figure 3. Weighting values (Lwn) of ROIs derived from
mean LSN score for a single measurement in a single MR image
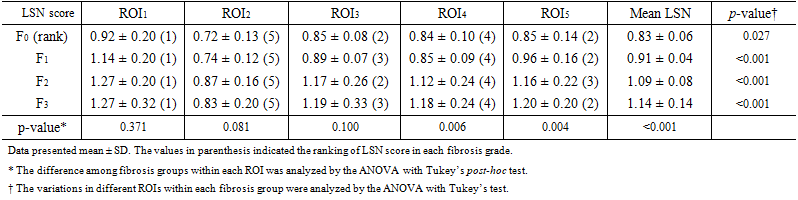
Table 1. Comparison
of LSN scores in different region of interests (ROIs)
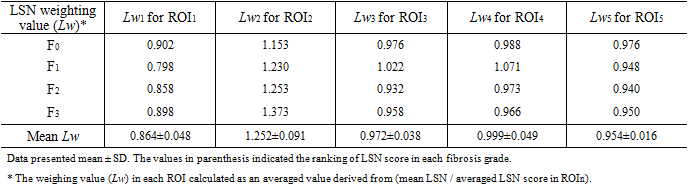
Table 2. Weighting
values (Lwn) of LSN scores in different region of interests
(ROIs) for mean LSN scores
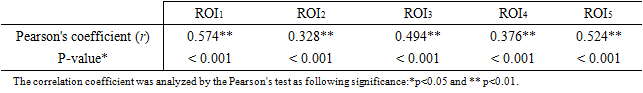
Table 3. Correlation
between mean LSN score and each ROI LSN score