2756
Correlation between liver function indicators in patients with cirrhosis and quantitative parameters of MRI---4D flow and T1/T2 relaxation time
Wenjun Zhang1, Nan Wang1, Ailian Liu1, Jiazheng Wang2, Qingwei Song1, Renwang Pu1, and Lihua Chen1
1the First Affiliated Hospital of Dalian Medical University, Dalian, Dalian, China, 2Philips Healthcare, Dalian, China
1the First Affiliated Hospital of Dalian Medical University, Dalian, Dalian, China, 2Philips Healthcare, Dalian, China
Synopsis
Liver function information plays an important role in the decision-making of treatment strategy in liver cirrhosis and in the prevention of liver failure after treatment. In recent years, more and more evidence of Gd-EOB-DTPA MRI T1mapping can be used to the liver and partial liver function. As cirrhosis often leads to changes in liver-related blood flow, we demonstrate the feasibility of 4D Flow MRI on quantitative assessment of the disease.
Introduction
Liver function evaluation can provide important information for the selection of treatment strategy for patients with liver cirrhosis and for the prevention of liver failure after treatment [1]. The changes of blood flow and intrahepatic perfusion in patients with liver cirrhosis will affect the process of liver metabolism, and then affect the abnormality of liver function indicators, such as total bilirubin, prealbumin and albumin [2,3]. This study aims to evaluated the correlations between the quantitative measurements by 4D flow, T1/T2 mapping and clinical functional indicators of liver in patients with liver cirrhosis.Methods
Retrospective analysis of 3.0 T magnetic resonance (Ingenia CX) scans admitted to our hospital from October 2019 to October 2020, and diagnosed as patients with cirrhosis after clinical manifestations, laboratory examination and imaging examination (Table1). Liver function-related tests, including total bilirubin (TBIL), total bile acid (TBA), prealbumin (PLB), albumin (ALB), gamma glutamyl transpeptidase (GGT), aspartate aminotransferase (AST), alanine aminotransferase (ALT), alkaline phosphatase (ALP), prothrombin time (PT), were recorded for patients. 11 cases (7 men, 4 women, and 54 years of median age) were finally admitted to the group. Two observers (MR diagnosis for three and two years) completed data measurements at Philips Intelli Space Portal (ISP). T1/T2 relaxation time were generated from the T1/T2 mapping scan. Three ROIs were placed at the maximum level of the left lobe of the liver, the right anterior lobe of the liver and the right posterior lobe of the liver, respectively (Figure1). The acquired images were processed on CVI42 package (Canada Circle Cardiovascular Imaging)by an experienced radiologist to obtain the 3D angiogram. Four cut planes were manually placed to measure the flow,the flow rate (cm/s), the axial-wall shear stress (WSS, Pa), and the pressure gradient (mmHg) in the targeted vessel segments. Three planes were placed at the proximal, middle, and distal of the main portal vein and one at the splenic vein confluence as reference (Figure 2). The measured data are averaged for reduced error. SPSS22.0 statistical analysis software was used for statistical analysis. Spearman was used to analyze the correlation between various quantitative parameters and results of liver function tests.Results
The T1 relaxation time is positively correlated with GGT and AST (r = 0.531 and 0.525, P<0.05). The T1 relaxation time is negatively correlated with PLB (r = 0.510, P<0.05). The Flow is positively correlated with TBIL, TBA (r = 0.798 and 0.881, P<0.05). The Flow rate is positively correlated with TBA (r = 0.881, P<0.05). There was no significant difference in other parts of the quantitative parameters (Table 2).Conclusion and Discussion
The quantitative parameters of permeability analysis and 4D flow were observed to be significantly related to results of liver function in patients with cirrhosis. Flow and Flow rate reflects the blood supply of the liver, thereby affecting liver function. The correlation among T1/T2 times of liver cirrhosis and liver meritorious service is observed. Quantitative parameters of magnetic resonance is necessary in clinical practice.Acknowledgements
No acknowledgement found.References
1. Rassam F, Uz Z, van Lienden KP, Ince C, Bennink RJ, van Gulik TM. Quantitative assessment of liver function using hepatobiliary scintigraphy: the effect of microcirculatory alterations after portal vein embolization. Nucl Med Commun. 2019 Jul;40(7):720-726.2. Liao YY, Teng CL, Peng NF, Jia RR, Cui J, Chen K, Ma L, Xiang BD, Zhong JH, Li LQ. Serum Prealbumin is Negatively Associated with Survival in Hepatocellular Carcinoma Patients after Hepatic Resection. J Cancer. 2019 Jun 2;10(13):3006-3011.3. Chen PC, Chen BH, Huang CH, Jeng WJ, Hsieh YC, Teng W, Chen YC, Ho YP, Sheen IS, Lin CY. Integrated model for end-stage liver disease maybe superior to some other model for end-stage liver disease-based systems in addition to Child-Turcotte-Pugh and albumin-bilirubin scores in patients with hepatitis B virus-related liver cirrhosis and spontaneous bacterial peritonitis. Eur J Gastroenterol Hepatol. 2019 Oct;31(10):1256-1263.Figures
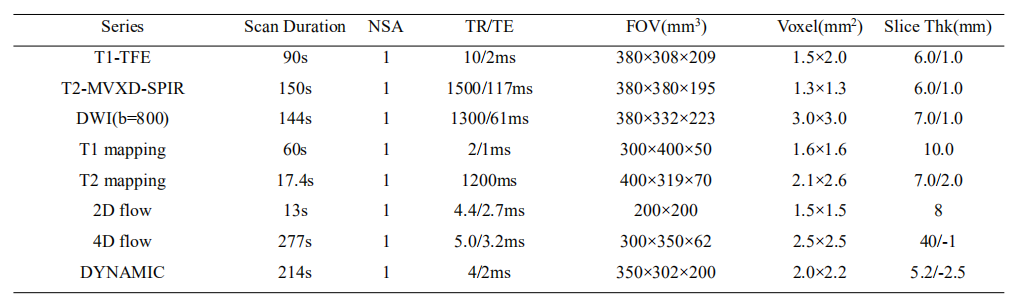
Table1 Detailed scan parameters for all used sequences
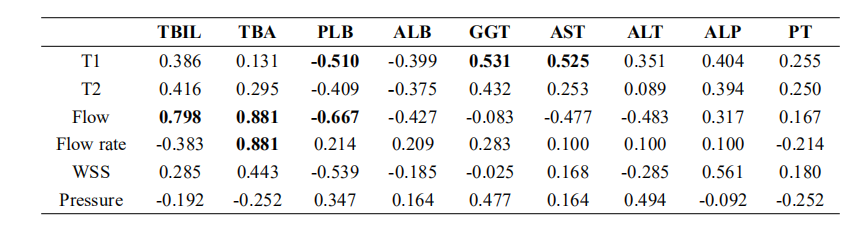
Table2 Correlation between quantitative parameters of permeability and liver function indicators
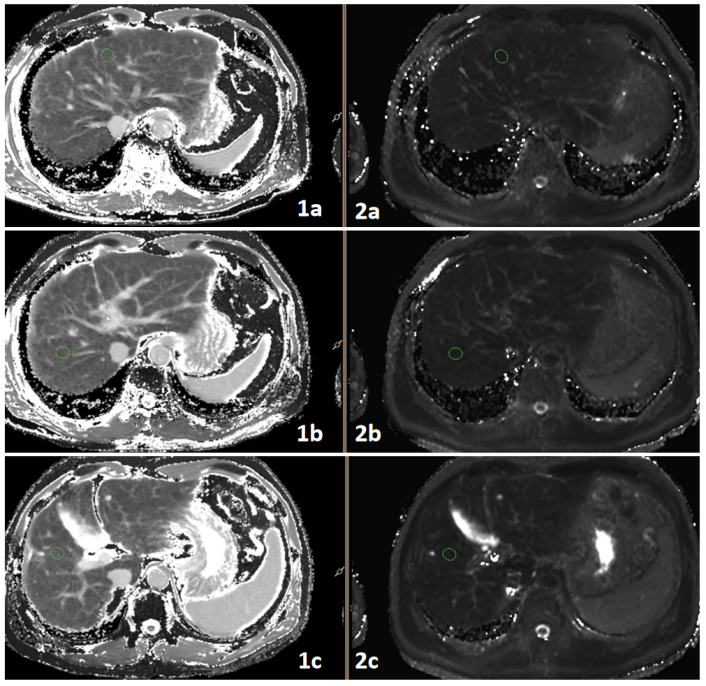
Figure1 1a-2c was a 58-year-old man with liver cirrhosis1a-1c: T1 mapping 2a-2c: T2 mapping
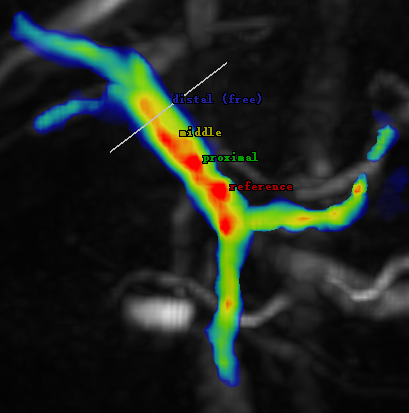
Figure 2 oblique frontal view 4D flow MRI image in a 53-year-old man with liver cirrhosis.