2754
Comparison of multi-echo Dixon andmulti-echo MRS sequences to quantify hepatic iron overload in rabbits with or without fatty liver1Radiology Department, The First Affiliated Hospital of Guangxi Medical University, Nanning, China, 2Siemens Healthcare Ltd, MR Scientific Marketing, Wuhan, China, 3Siemens Healthcare GmbH, MR Application Development, Erlangen, Germany
Synopsis
Feasibility and accuracy of confounder-corrected 3D multi-echo-Dixon (ME-Dixon) imaging and T2-corrected multi-echo single-voxel (HISTO) spectroscopy for the quantification of liver iron content at 3T MRI were investigated in rabbits with or without fatty liver, compared with conventional 2D multi-gradient-echo (2D GRE) imaging, using histopathology as a reference. The results showed that compared with HISTO (R2_water) method, the multi-echo Dixon (R2*) method was found to be superior for liver iron and fat evaluations. AUC calculations showed that both the ME-Dixon and 2D GRE values had high accuracy for diagnosing liver iron overload in the rabbit model for LICs up to 7mg/g.
Introduction
3D multi-echo-Dixon (ME-Dixon) and multi-echo MR spectroscopy (MRS) sequences have been shown to simultaneously quantify iron and fat deposits in the liver without interferences[1-3]. Since the advent of these techniques,it has seldom been possible to use liver tissue pathology or chemical analyses as a reference standard to quantify liver iron content and fat deposition simultaneously, and data from 3T are especially scarce.The purpose of this study was toinvestigate the feasibility and accuracy of ME-Dixon and T2-corrected multi-echo single-voxel (HISTO) MRS for the quantification of hepatic iron overload at 3T MRI in rabbits with or without fatty liver at 3T.Method
This prospective study was approved by the Animal Research Committee of our institution. The care of laboratory animals and all animal experiments adhered to the Guide for the Care and Use of Laboratory Animals published by the U.S. National Institutes of Health. Forty-four adult New Zealand white rabbits were obtained and randomly divided into a control group and experimental groups. ME-Dixon, HISTO, and conventional 2D multi-gradient-echo (GRE) sequences were performed ona 3T MRI system (MAGNETOM Prisma, Siemens Healthcare, Erlangen, Germany)for rabbits with different degrees of hepatic iron deposition induced by dextran feeding. The parameters of ME-Dixon were as follows:TE1/spacing/TE6=1.26/1.34/7.96ms, repetition time (TR)=9.25ms, slice thickness =3.5mm, a low flip angle (4°) to reduce T1 effects, matrix size = 160×120, field of view (FOV)= 120×100 mm2, bandwidth =1200Hz/pixel, accelerate factor =4, scan time = 16s. The HISTO sequence was executed twice with different TE ranges: 12/24/36/48/72ms (HISTO) and 12/15/18/21/24ms (HISTO_H). All other parameters remained the same: TR=3000ms, bandwidth =1200Hz, averages=1, voxel sizes =3~5cm3, and acquisition time=15s. The spectroscopy voxel was positioned on three-plane localizing images avoiding the main vessels and liver edges with edge lengths from 1.4cm to 1.7cm. The parameters ofthe conventional GRE sequence were as follows(for R2*): TR=200ms, TE1/spacing/TE12=0.96/1.42/16.48ms, bandwidth =1950Hz/Pixel, FOV = 120×100 mm2, matrix size =128×128, 10 slices with a 5mm thickness. Dixon_R2* and proton density fat fraction (PDFF) were calculated from the ME-Dixon sequence, GRE_R2*was calculated from the 2D_GRE data, HISTO_R2_water and HISTO_H_R2_water were calculated from HISTO (for moderate iron load) and HISTO-H (for high iron load) sequences. After MR scanning, the rabbits were euthanized and the liver iron content (LIC) and liver fat content (LFC)were obtained using chemical analyses. Statistical analyses were performed using SPSS software (Version 22.0) and MedCalc (Version 13.1.2.0). the correlations of above metrics were calculated. Receiver operating characteristic curves (ROC) and area of under the curve (AUC) were used to evaluate the diagnostic efficiency for iron content. A P<0.05 was considered statistically significant.Results
For LIC<7.0mg/g dry weight (dw), LIC was significantly correlated with HISTO_H_R2_water (r=0.858, p<0.001), Dixon_R2*(r=0.910, p<0.001), and GRE_R2* (r=0.931, p<0.001), while HISTO_R2_water was weakly correlated with LIC (r=0.424, P=0.008), as shown in Figure 1. There was a strong correlation between the LFC and the HISTO_PDFF (r=0.776, p<0.001), HISTO_H_PDFF (r=0.811, p<0.001), and Dixon_PDFF (r=0.888, p<0.001) (Table 1). Using the LIC thresholds of 1.8 and 3.2mg/g dw, the AUCs of the HISTO, HISTO-H, ME-Dixon, and 2D_GRE were 0.861, 0.978, 0.971, 0.994 and 0.652, 0.906, 0.983, 0.957, respectively. The AUC of Dixon_R2* and GRE_R2*showedno significant difference (P=0.149 and P=0.319, respectively) (Figure 2).Discussion
This study showed that the ME-Dixon outperformed the HISTO sequence in simultaneously quantifying liver steatosis and iron overload with better diagnostic accuracy in the rabbit model. In our study,the AUC calculations showed that both the Dixon_R2* and GRE_R2* values have high accuracy for diagnosing liver iron overload for LICs up to 7mg/g. The HISTO sequence had a lower diagnostic performance than the other sequences, and it became poorer as LICs increased. The results showed HISTO, ME-Dixon and 2D GRE sequences can reliably classify liver iron load according to the clinically significant LIC thresholds of 1.8 and 3.2 mg/g dw; the ME-Dixon and 2D GRE sequences quantified liver iron content with similarly high diagnostic performances. There are limitations in our study. Firstly, some rabbits with fatty liver developed liver fibrosis; the degree of liver fibrosis was not assessed, so a potential influence of fibrosis in the MR results could not be assessed. Secondly, the pathophysiologic characteristics of iron overload via dextran-loading in rabbits might differ from iron overload in human beings.Conclusions
The multi-echo Dixon sequence has superior diagnostic performance compared to that of the HISTO sequence for the simultaneous quantification of liver steatosis and iron overload. The 3D ME-Dixon technique is a promising and useful tool to quantify liver iron content, especially in patients with co-existing hepatic steatosis.Acknowledgements
We would like to thank Editage for English language editing. And we thank Tang Cheng, Lei Yiwu technologists in our department, for their work performing measurements for this study.References
1. Sharma P, Altbach M, Galons JP, Kalb B, Martin DR.Measurement of liver fat fraction and iron with MRI and MR spectroscopy techniques. Diagn IntervRadiol. 2014;20(1):17-26. 2. Zhong X, Nickel MD, Kannengiesser SA, Dale BM, Kiefer B, Bashir MR. Liver fat quantification using a multi-step adaptive fitting approach with multi-echo GRE imaging. MagnReson Med. 2014;72(5):1353-1365. 3. Galimberti S, Trombini P, Bernasconi DP, et al. Simultaneous liver iron and fat measures by magnetic resonance imaging in patients with hyperferritinemia. Scand J Gastroenterol. 2015 Apr;50(4):429-38.Figures
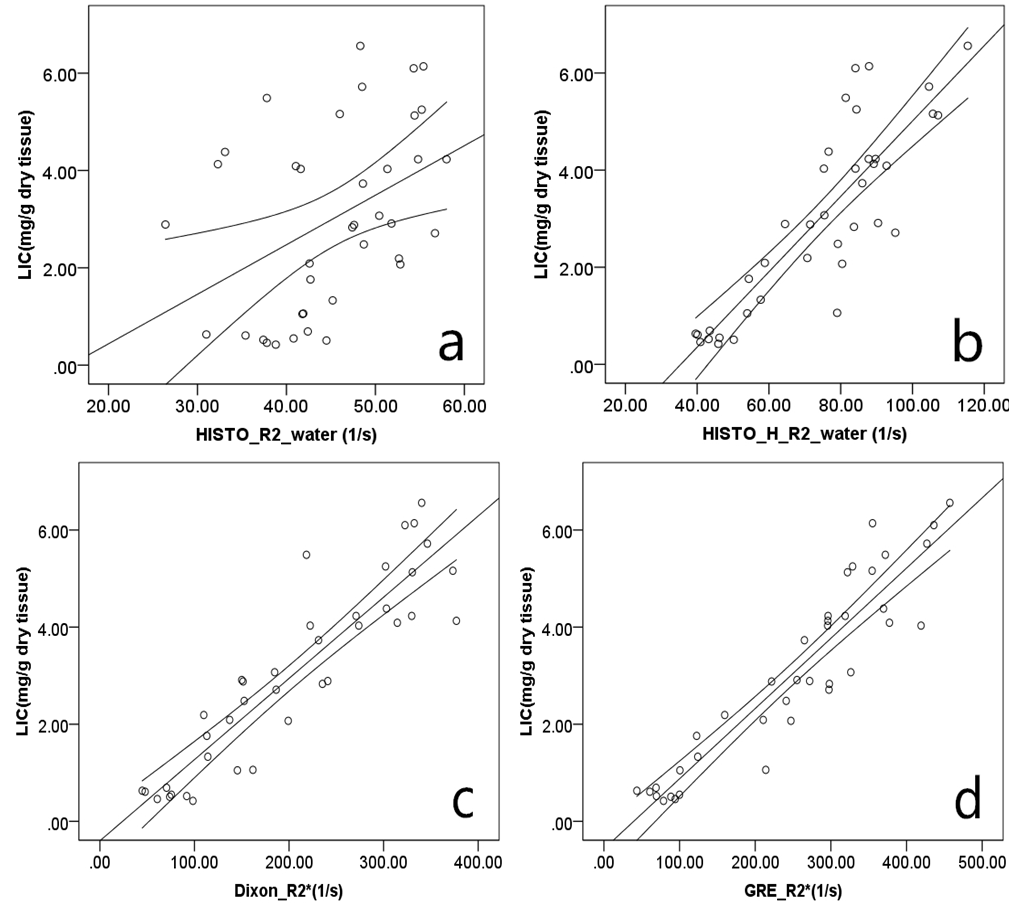
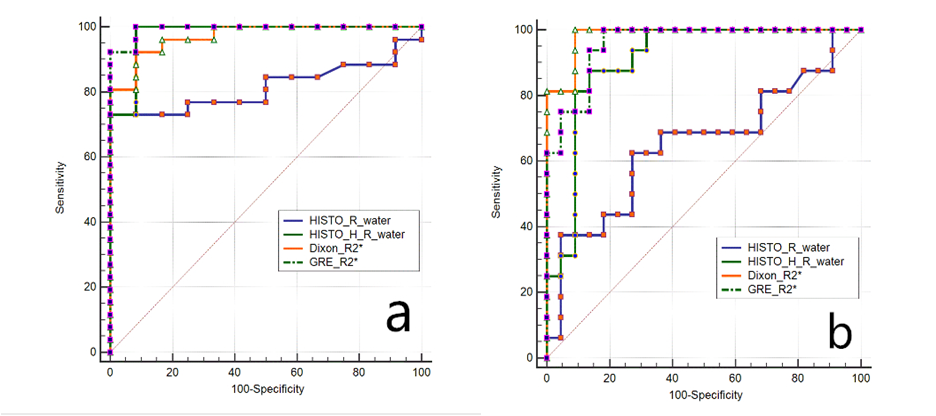
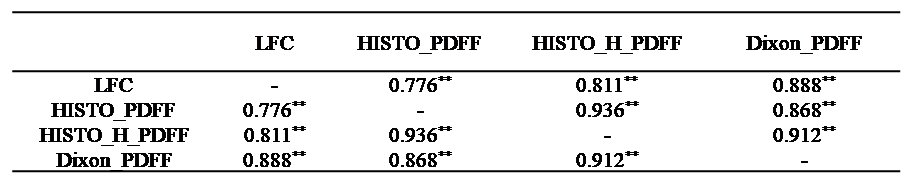
Table 1. Correlation analyses of LFC measurements with magnetic resonance imaging sequences with PDFF (n=38)
LFC, liver fat content; PDFF, proton density fat fraction; **, P<0.001