2752
Prostate Perfusion Mapping using Fourier-Transform based Velocity-Selective Pulse Trains: Choice of Cutoff Velocity and Comparison with Brain
Dapeng Liu1,2, Dan Zhu3, Wenbo Li1,2, and Qin Qin1,2
1Department of Radiology, Johns Hopkins University School of Medicine, Baltimore, MD, United States, 2F.M. Kirby Research Center for Functional Brain Imaging, Kennedy Krieger Institute, Baltimore, MD, United States, 3Department of Biomedical Engineering, Johns Hopkins University School of Medicine, Baltimore, MD, United States
1Department of Radiology, Johns Hopkins University School of Medicine, Baltimore, MD, United States, 2F.M. Kirby Research Center for Functional Brain Imaging, Kennedy Krieger Institute, Baltimore, MD, United States, 3Department of Biomedical Engineering, Johns Hopkins University School of Medicine, Baltimore, MD, United States
Synopsis
Prostate perfusion mapping using velocity-selective arterial spin labeling (VSASL) is desired for higher SNR and insensitivity to arterial transit delay. The choice of cutoff velocity (Vc) determines its sensitivity to perfusion-weighted signal (PWS). The utility of Fourier-transform based velocity-selective (FT-VS) pulse trains have been demonstrated in cerebral blood flow and cerebral blood volume mapping. In this study, FT-VS prepared blood flow and blood volume mapping sequences were performed in parallel in both brain and prostate to investigate their Vc dependence to PWS. The results suggest that lower Vc is demanded for prostate VSASL.
Introduction
Prostate blood flow (PBF) was only estimated by pulsed ASL methods1,2, which suffer from low SNR and high sensitivity to arterial transit delay. Velocity-selective arterial spin labeling (VSASL) can potentially overcome these limitations and is thus an attractive technique to explore. The sensitivity of VSASL techniques to perfusion signal is critically dependent on the choice of cutoff velocity (Vc)3,4 and might be different in various organs. For conventional velocity-selective saturation (VSS) pulse trains, Vc is typically around 2cm/s for quantifying cerebral blood flow (CBF); Rather low Vc of 0.35-0.7cm/s was applied in a study estimating total cerebral blood volume (CBV)5. Recently, Fourier-transform based velocity-selective inversion (FT-VSI) and saturation (FT-VSS) pulse trains have been applied for quantifying CBF with a 2.8cm/s Vc6 and CBV with a 0.7cm/s Vc7. This work investigates these new 3D perfusion imaging techniques for blood flow and blood volume in both brain and prostate in parallel, with Vcs ranging from 2.10 to 0.35cm/s.Methods
Experiments among four healthy male volunteers (34±7yrs) were performed on a 3T Siemens Prisma scanner, ) with a 20-channel head/neck receiver coil for brain imaging and an 18-channel body coil for prostate imaging in a single session. Blood flow and blood volume mapping utilized a 96ms FT-VS labeling module as shown in Figure 1a, with excitation pulses of 20° (FT-VSI) for blood flow and 10° (FT-VSS) for blood volume mapping. Strength of velocity-encoding gradients was varied to achieve four Vcs: 0.35/0.70/1.40/2.10cm/s. The blood flow mapping sequence contained a spatially selective saturation module, an FT-VS label/control module, three background suppression pulses, a flow-dephasing module with similar Vcs as the labeling module, and an inner-volume-excitation single-shot 3D GRASE readout (Figure 1b). An additional spatially selective saturation was used for prostate imaging to suppress bladder signal right before the flow-dephasing module. Post saturation delay (PSD) was 3s; post labeling delay (PLD) was 1.2s; TR was 4.6s; and total duration was 3.5min, including 20 dynamics. The blood volume mapping sequence was similar except no background-suppression or flow-dephasing module were used (Figure 1c). PSD was 3.5s; no PLD; TR was 3.9s; and total duration was 3min with also 20 dynamics. The reduced field-of-view was 82×82×40mm3 with an acquisition resolution of 3.4×3.4×4mm3 covering the middle of the brain and the whole prostate gland. The EPI factor was 13, and the fast-spin-echo factor was 12. Bandwidth was 2894Hz with an echo spacing of 11.8ms. Echo duration was therefore 142ms. A proton density-weighted M0 image and a double inversion recovery (DIR) image that suppressed white matter (WM) and CSF in brain, and urine in prostate were also acquired with the same readout. Visual inspection was conducted to remove dynamics with motion artifacts. Perfusion-weighted signal (PWS) was calculated as averaged subtraction between label/control pairs divided by M0. Temporal SNR (tSNR) of the subtraction through the dynamics was also recorded.Results and Discussion
The blood flow and blood volume mappings of both brain and prostate from one representative subject were shown in Figure 2. One-slice examples from all four subjects were shown in Figure 3. Mean and standard deviation of PWS in ROIs of gray matter (GM), WM, and prostate were shown in Figure 4 and Table 1. For CBF mapping, PWS is consistent for Vc of 0.70/1.40/2.10cm/s, indicating a relatively stable labeling efficiency. Vc of 0.35cm/s showed a higher blood flow PWS in both GM and WM, probably caused by diffusion effect (see Table 1). Surprisingly, tSNR decreased with lower Vc, which may indicate more CSF signal being unintentionally labeled as CSF has a slow velocity. For CBV mapping, both GM and WM showed increased PWS with lower Vc, indicating higher labeling efficiency. However, even with the higher Vc of 1.4/2.1cm/s, the CBV contrast between GM and WM is still largely preserved. For PBF and prostate blood volume (PBV) mapping, both PWS showed a much sharper increase with lowering Vc, indicating an overall slower moving of blood in prostate than in brain. This leads to substantial signal loss for high Vcs of 1.4/2.1cm/s. In addition, the prostate PWS also showed a lower tSNR than brain GM and WM, probably caused by intrinsically more local motion of prostate. For both brain and prostate, blood volume PWS showed up to three times higher tSNR than blood flow. Blood flow mapping also seemed to show a better contrast between GM and WM than blood volume mapping, probably due to more accumulated signal in tissue than vessels. It is worth noting that with such low Vc used in this study, the diffusion effect may be a confounding factor. Based on normal T1, T2 and ADC of brain and prostate, we simulated the potentially overestimated PWS from diffusion as shown in Table 1.Conclusion
Vc dependence of FT-VS based PWS was compared for both brain and prostate at 3T. For prostate, a low Vc of 0.35cm/s seemed necessary for both blood flow and blood volume mapping to get adequate signal. As in brain, PBV mapping yielded a higher tSNR than PBF. Both methods need to be evaluated in more healthy subjects and patients to demonstrate their clinical utilities.Acknowledgements
No acknowledgement found.References
1. Li X, Metzger GJ. Feasibility of measuring prostate perfusion with arterial spin labeling. NMR Biomed. 2013;26:51–57.2. Cai W, Li F, Wang J, et al. A comparison of arterial spin labeling perfusion MRI and DCE-MRI in human prostate cancer. NMR Biomed. 2014;27:817–825.
3. Wong EC, Cronin M, Wu WC, Inglis B, Frank LR, Liu TT. Velocity-selective arterial spin labeling. Magn. Reson. Med. 2006;55:1334–1341.
4. Wu WC, Wong EC. Intravascular effect in velocity-selective arterial spin labeling: The choice of inflow time and cutoff velocity. Neuroimage 2006;32:122–128.
5. Liu D, Xu F, Lin DD, van Zijl PCM, Qin Q. Quantitative measurement of cerebral blood volume using velocity-selective pulse trains. Magn. Reson. Med. 2017;77:92–101.
6. Qin Q, van Zijl PCM. Velocity-selective-inversion prepared arterial spin labeling. Magn. Reson. Med. 2016;76:1136–1148.
7. Qin Q, Qu Y, Li W, et al. Cerebral blood volume mapping using Fourier-transform-based velocity-selective saturation pulse trains. Magn. Reson. Med. 2019;81:3544–3554.
Figures
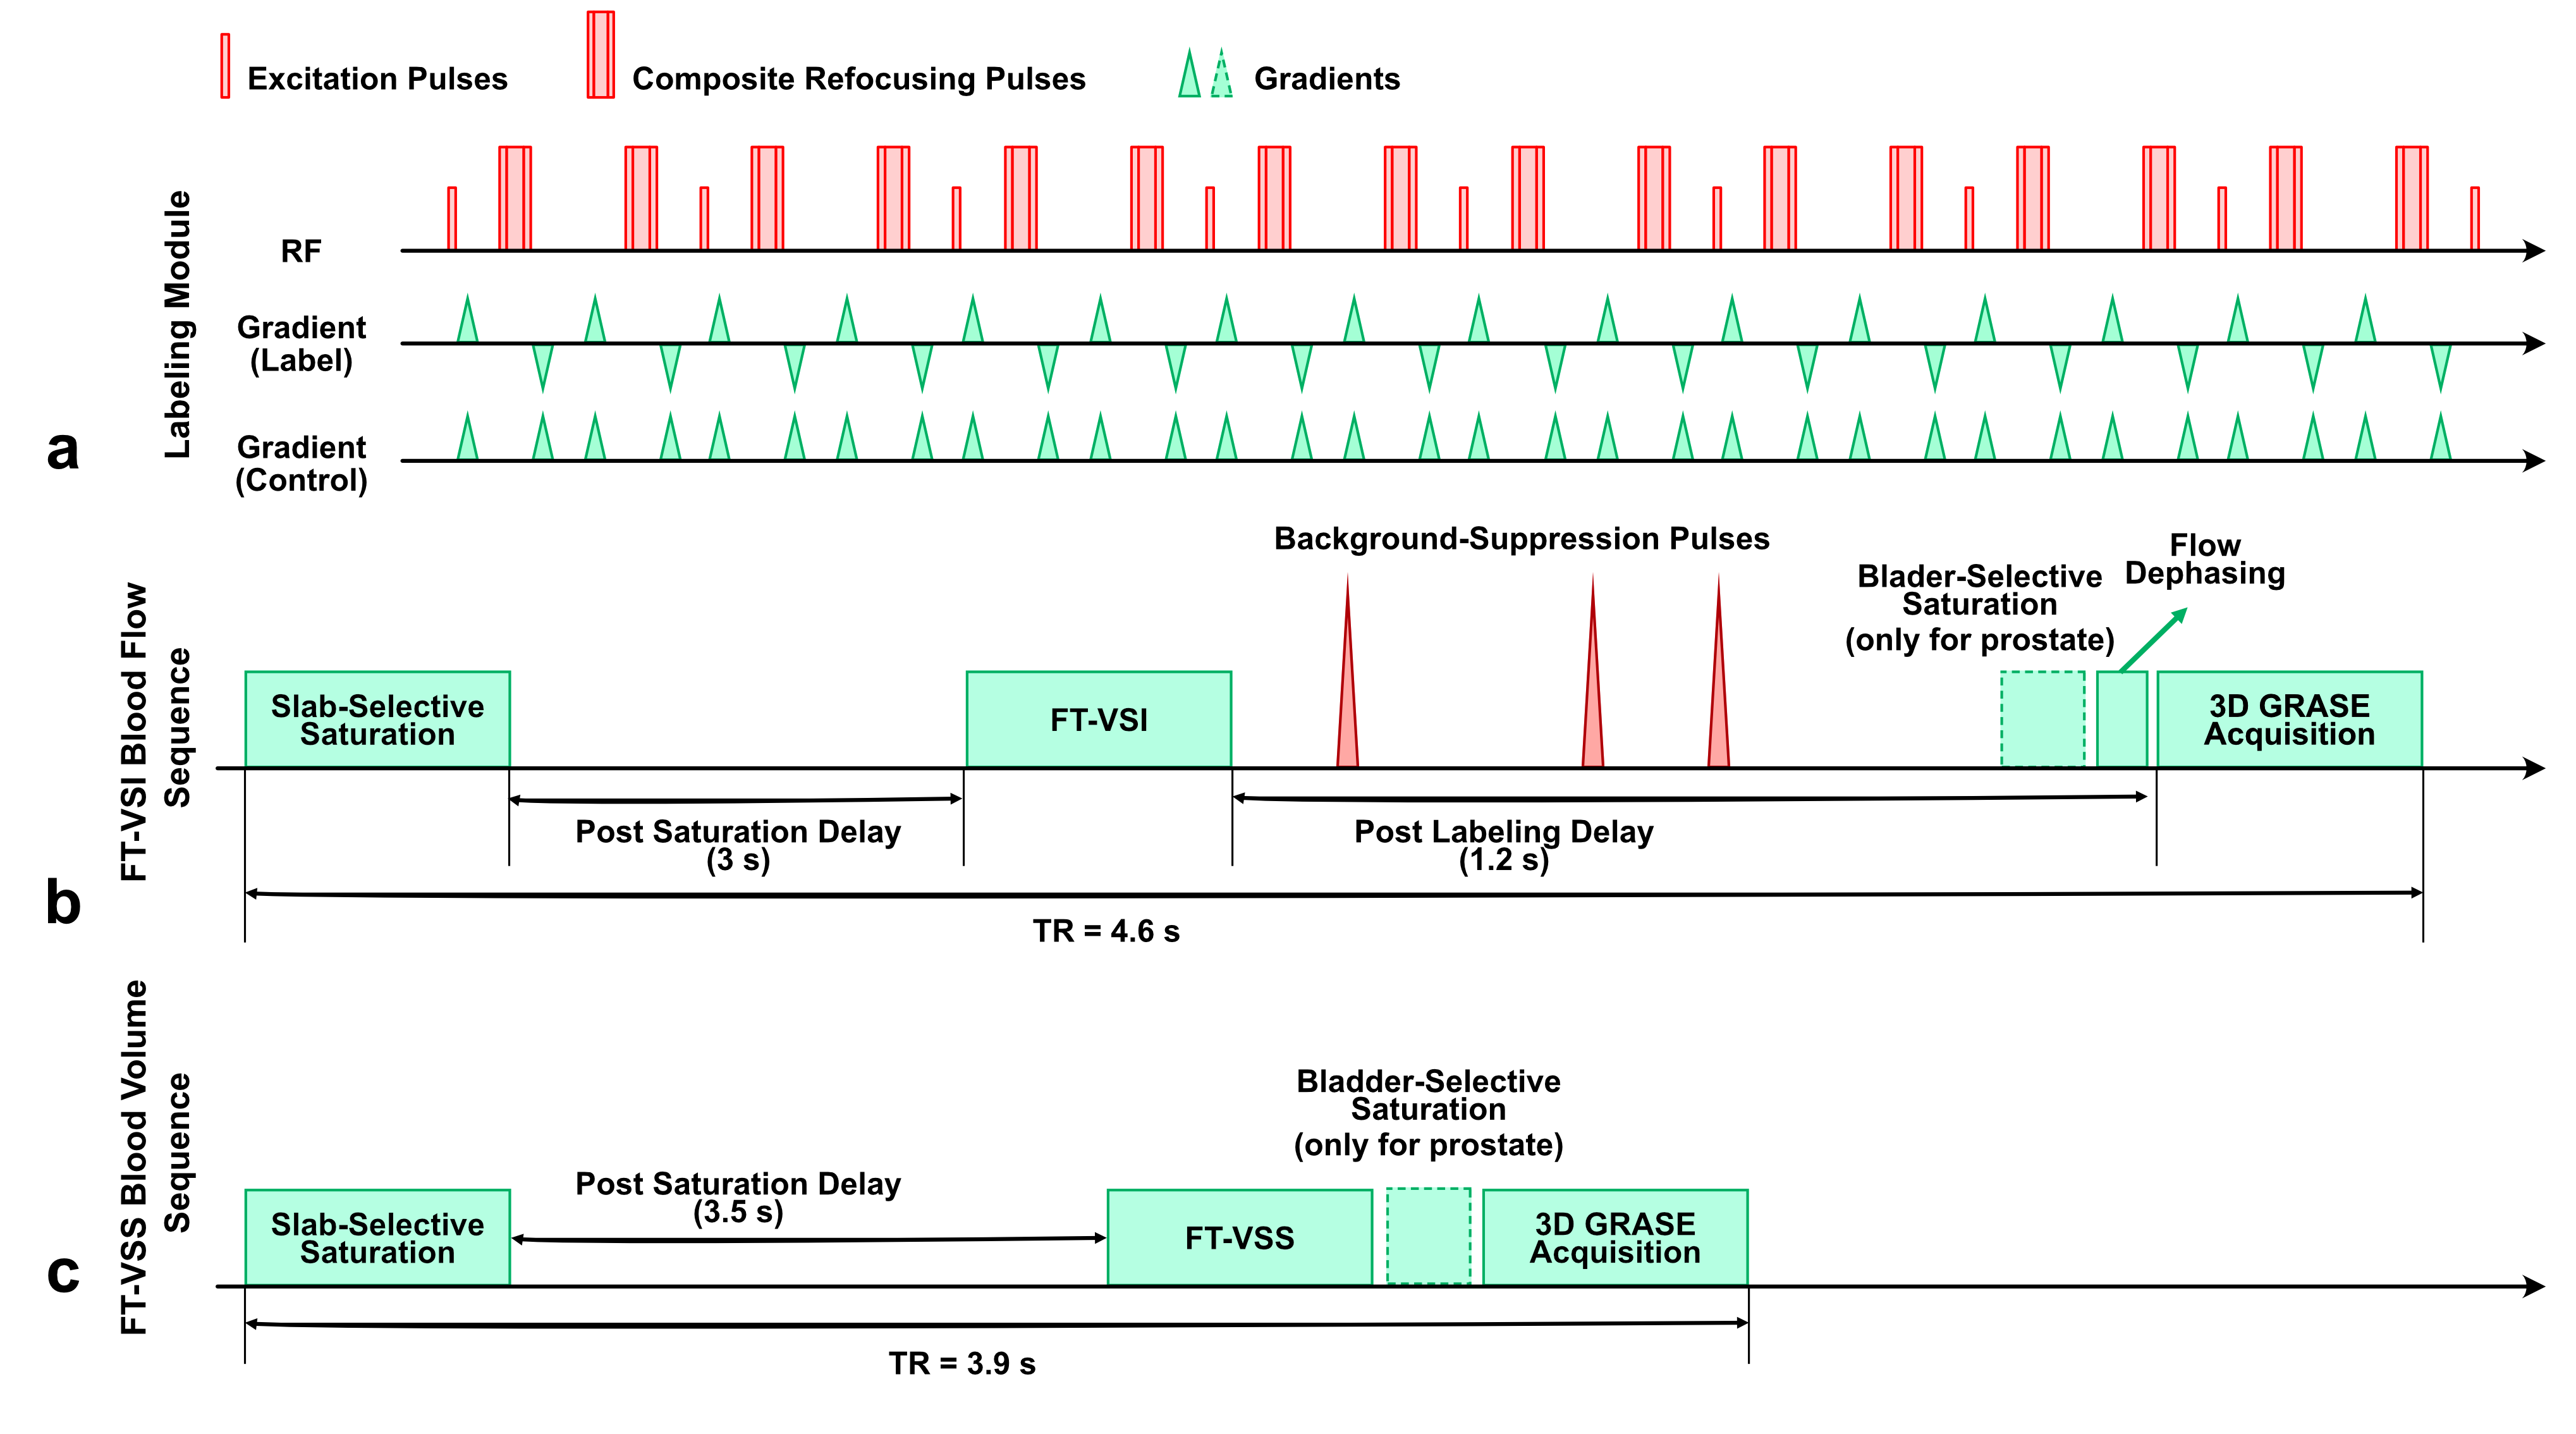
Figure 1: Diagram for the labeling module (a) and the sequences
for blood flow (b) and blow volume (c) mapping.
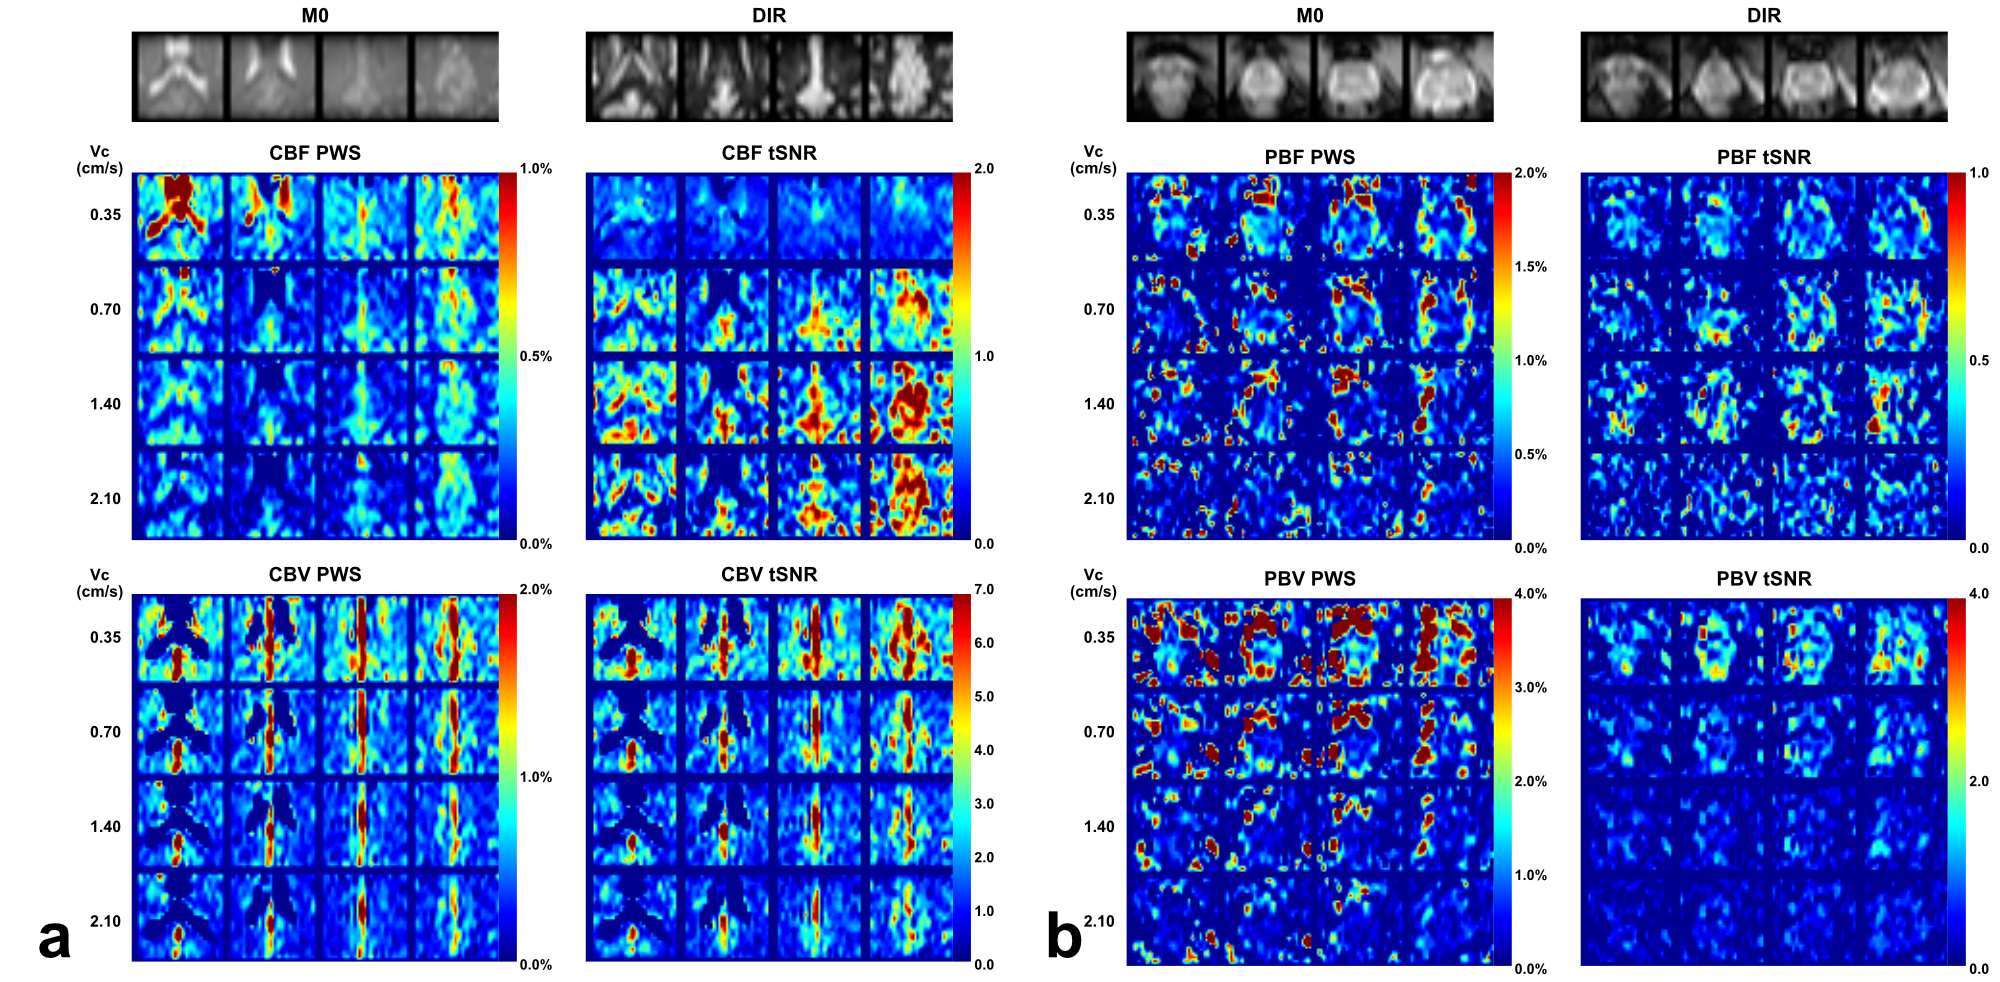
Figure 2: Brain (a) and prostate (b) PWS and corresponding
tSNR maps from one representative subject with four out of all ten slices. Both
blood flow (CBF for brain and PBF for prostate) and blood volume (CBV for brain
and PBV for prostate) maps were shown. M0
and DIR images were also shown above. Note that in the CBV PWS and tSNR images,
the CSF in leteral ventricles display dark as it has negative signal due to a
combination of long T2 values of CSF and the higher B1+ scale at the center of
the brain.
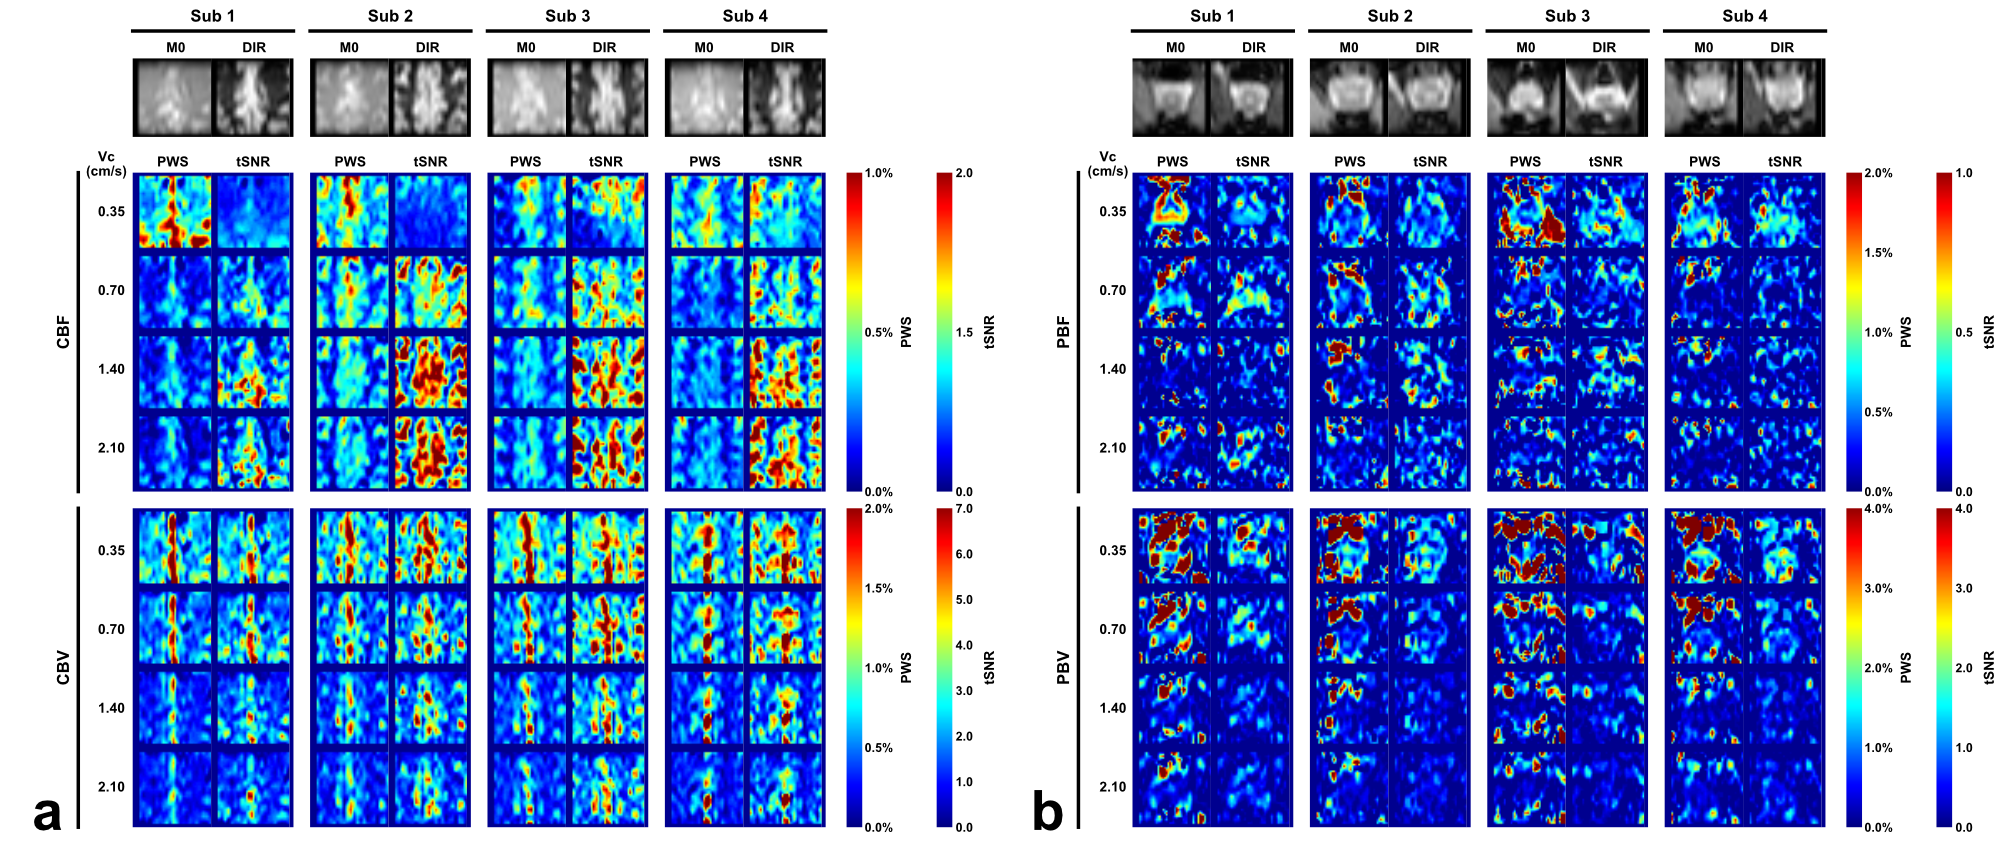
Figure 3: Examples
of PWS and tSNR maps of brain (a) and prostate (b) for respective blood flow
and blood volume of all four subjects (only one slice shown).
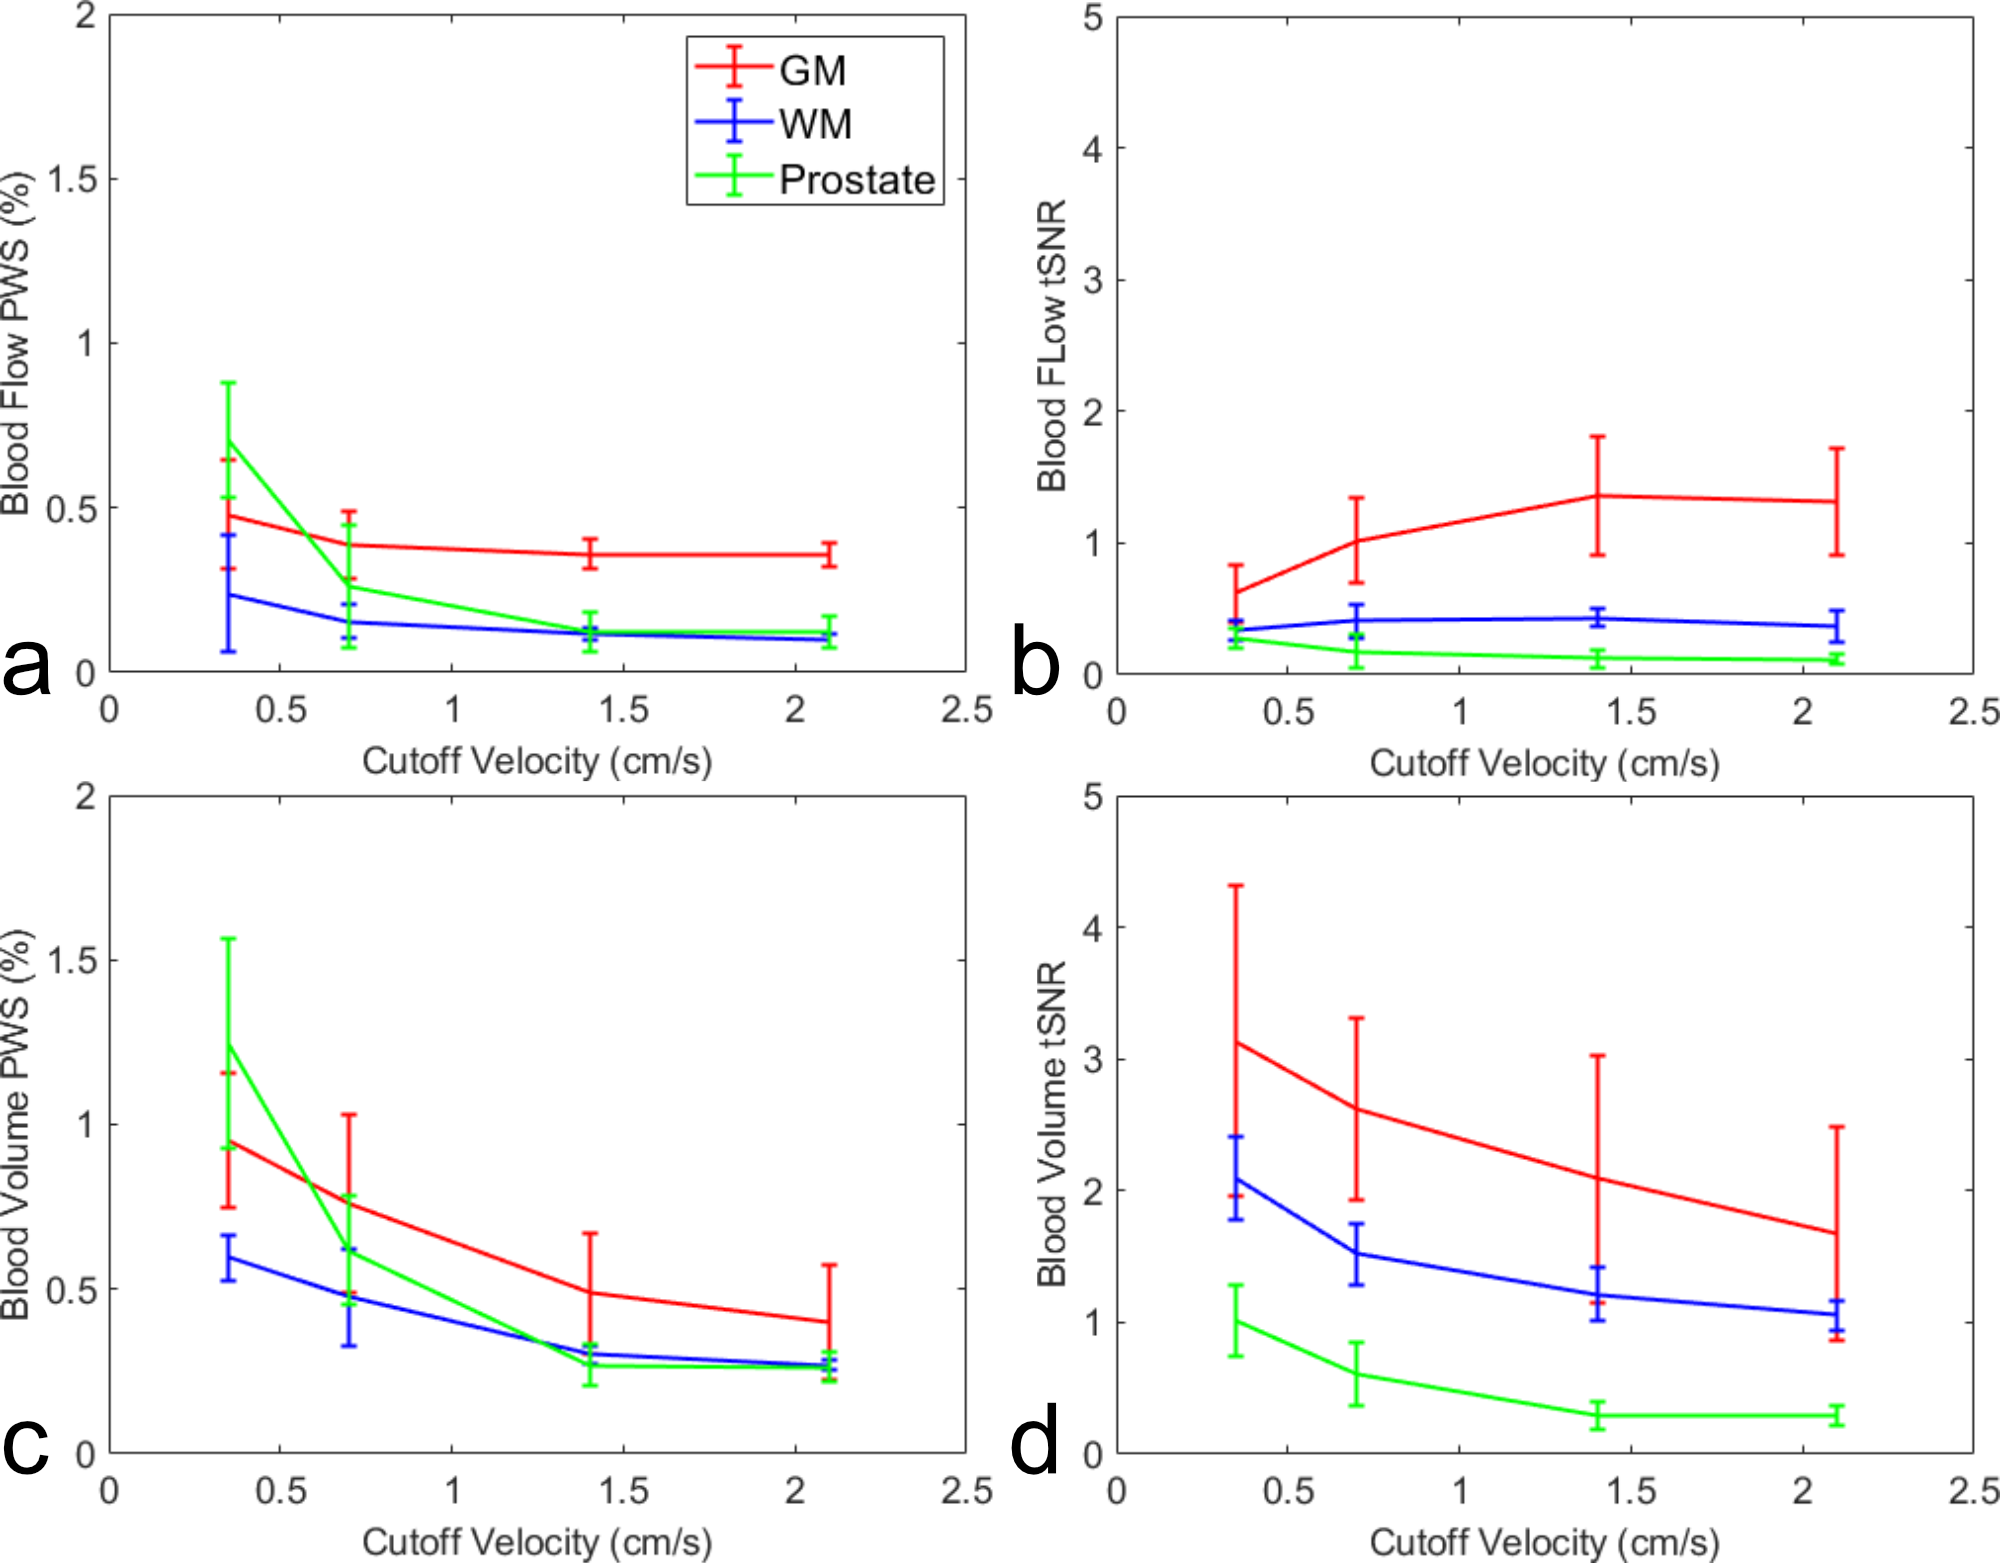
Figure 4: Averaged
blood flow PWS (a) and its tSNR (b), blood volume PWS (c) and its tSNR (d), in
ROIs of GM, WM and prostate from four subjects.

Table 1: Mean and standard deviation of PWS and tSNR of GM,
WM and prostate from all four subjects. Simulated bias from diffusion effect
assuming normal T1, T2 and ADC were also shown.