2750
Reproducibility of multiparametric MRI in transplanted kidneys1Radiology, Clínica Universidad de Navarra, Pamplona, NE, Spain, 2IdiSNA, Instituto de Investigación Sanitaria de Navarra, Pamplona, Spain, 3Siemens Healthineers, Madrid, Spain, 4Radiology, Clínica Universidad de Navarra, Pamplona, Spain, 5Nephrology, Clínica Universidad de Navarra, Pamplona, Spain
Synopsis
The goals of this work were to test a multiparametric MRI protocol to measure perfusion, diffusion and T1 and to assess inter-session reproducibility in a group of transplanted patients with stable renal function.
18 patients were imaged in 2 exams employing pseudo-continuous arterial spin labeling technique, intravoxel incoherent motion technique and T1 mapping sequence. Reproducibility was assessed using Bland-Altman analysis, within-subject coefficient of variation (CVws) and intra-class correlation coefficient (ICC).
Results of the 3 techniques were promising showing a CVws <20% in most of the cases (especially for T1 and D (<6%)) and high ICC coefficients for PCASL and T1.
INTRODUCTION
Renal transplantation is the therapy of choice in patients at the end stage of chronic kidney disease (CKD). Magnetic resonance imaging (MRI) can provide both anatomical information and functional parameters of the allograft, that could be potentially useful to detect graft dysfunction after transplantation. Arterial spin labeling (ASL)(1) allows the quantification of renal blood flow (RBF) without using any contrast agent. Intravoxel Incoherent Motion (IVIM)(2) permits the quantification of microvascular perfusion and diffusion parameters in the kidney tissue. The longitudinal relaxation time (T1) is an important parameter as it is needed for the quantification of RBF and T1 changes would correlate with pathological changes in the kidney (3).Thus, the main goal of this work was to test a multiparametric MRI protocol to measure allograft perfusion, diffusion and T1 and to assess inter-session reproducibility in a group of transplanted patients with stable renal function.
METHODS
SUBJECTS:This study was approved by the University of Navarra Ethics Research Committee. Written informed consent was obtained from all subjects.
Inclusion criteria: patients, with no contraindication for MRI and clinically stable with eGFR>50 ml/min/1.73m2 that were transplanted more than a year before the study. Subjects were recruited by their referring nephrologist.
18 transplanted patients (mean age±standard deviation (SD), 53.74±14.65years) participated in this study. Two exams were performed on all the subjects, separated by at least one week (Table 1).
MRI PROTOCOL:
Scans were performed on a 3T Skyra (Siemens, Germany).
ASL
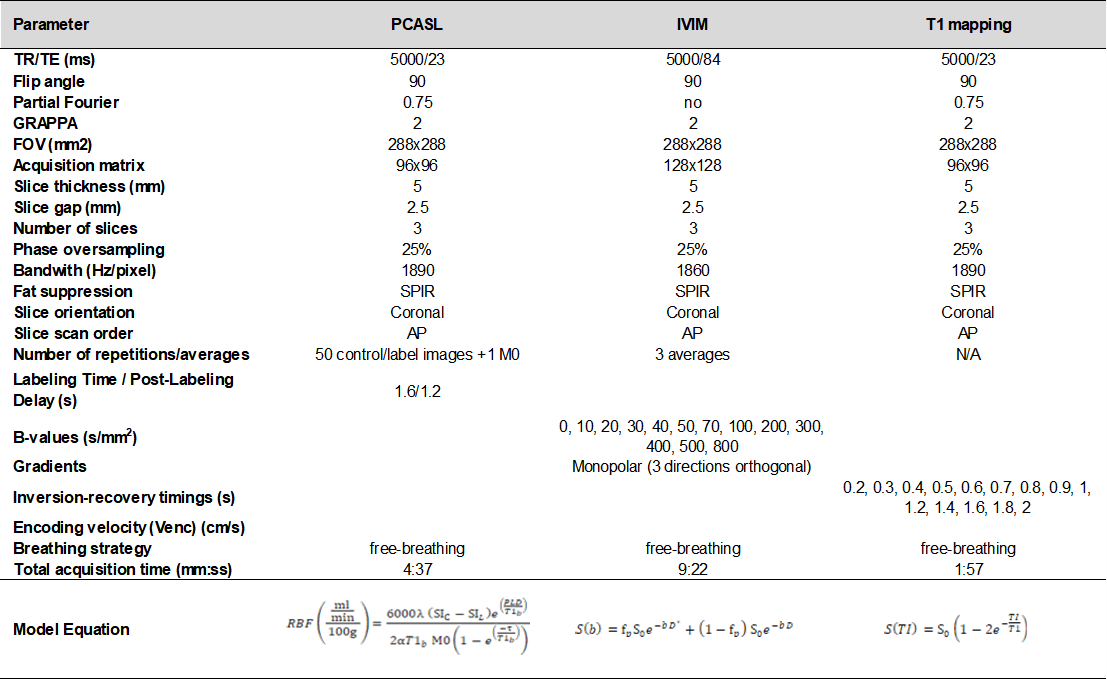
Tissue perfusion was measured using pseudo-continuous arterial spin labeling (PCASL) (4,5), implemented as previously described in (6) with a SE-EPI readout sequence. PCASL was unbalanced with average gradient=0.5mT/m and maximum to average gradient ratio=6. RF pulses were Hann-shaped (duration=500μs, period=1ms, average B1=1.6µT). Labeling duration was 1.6s and post-labeling delay was 1.2s. The labeling plane was positioned ~10cm above the kidney, transversally to the aorta. Sequence parameters are described in Table 2. Pre-saturation pulses selective to the imaging slice were applied at the beginning of each TR (TR=5s), and background suppression pulses (7) were configured as in (6). 25 ASL pairs and an M0 image (in which labeling, pre-saturation and BS pulses were not applied) were acquired.
IVIM
Microvascular perfusion and diffusion parameters were calculated using the IVIM technique with a single-shot EPI readout. Data was acquired for 13 b-values: 0,10,20,30,40,50,70,100,200,300,400,500,800 s/mm2, with monopolar gradients in 3 orthogonal directions and 3 signal averages. Sequence parameters are described in Table 2.
T1 mapping
An inversion recovery sequence with a SE-EPI readout and 14 TIs was employed (TIs: 0.1,0.2,0.3,0.4,0.5, 0.6,0.7,0.8, 1, 1.2, 1.4, 1.6, 1.8, 2 s) for T1 mapping. Readout parameters (Table 2) were identical to those of the PCASL sequence.
QUANTITATIVE AND STATISTICAL ANALYSIS:
Motion correction was performed for each sequence and slice using a PCA-groupwise registration method (8) implemented in Elastix (9).
ASL maps: ASL mean signal was computed for each label-control pair. Perfusion maps were calculated after removing outliers (when ASL signal was more than ±2 SD away from the global mean). RBF maps in ml/min/100g were computed using the single compartment model (Table 2), where and M0 are the signal of control, label and M0 images, respectively, α=0.60 (considering PCASL efficiency=0.65 and the effect of the two BS pulses (10)), τ is the labeling duration, λ=0.9mL/g (tissue-blood water partition coefficient) and T1b=1.65s (arterial blood T1).
IVIM maps: In the IVIM model (equation in Table 2), the first term (including the diffusion coefficient D) describes pure water diffusion, and the second term represents the fast molecular movement associated with microperfusion (with coefficients D∗ (mm2/s) and fp (perfusion fraction) (%)). First, D was calculated using data for b-values>200 s/mm2, assuming that perfusion-based molecular diffusion can be neglected for large b-values (solving the second term of the equation for fp=0). Then, fp and D* were calculated by fitting the bi-exponential model.
T1 maps: T1 maps were calculated by fitting voxel-by-voxel the model (Table 2) for the inversion recovery data.
For each sequence, parameter values were averaged in the cortex and medulla, using masks manually drawn in the M0/b=0 images.
Reproducibility was assessed using Bland-Altman analysis, within-subject coefficient of variation (CVws) and intra-class correlation coefficient (ICC) employing R(11).
RESULTS AND DISCUSSION
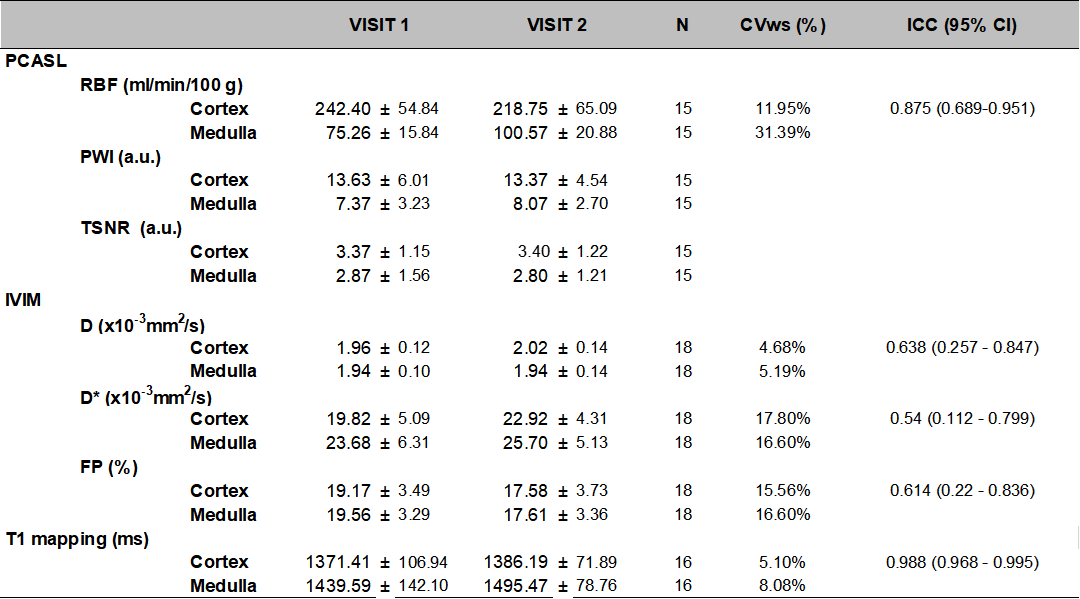
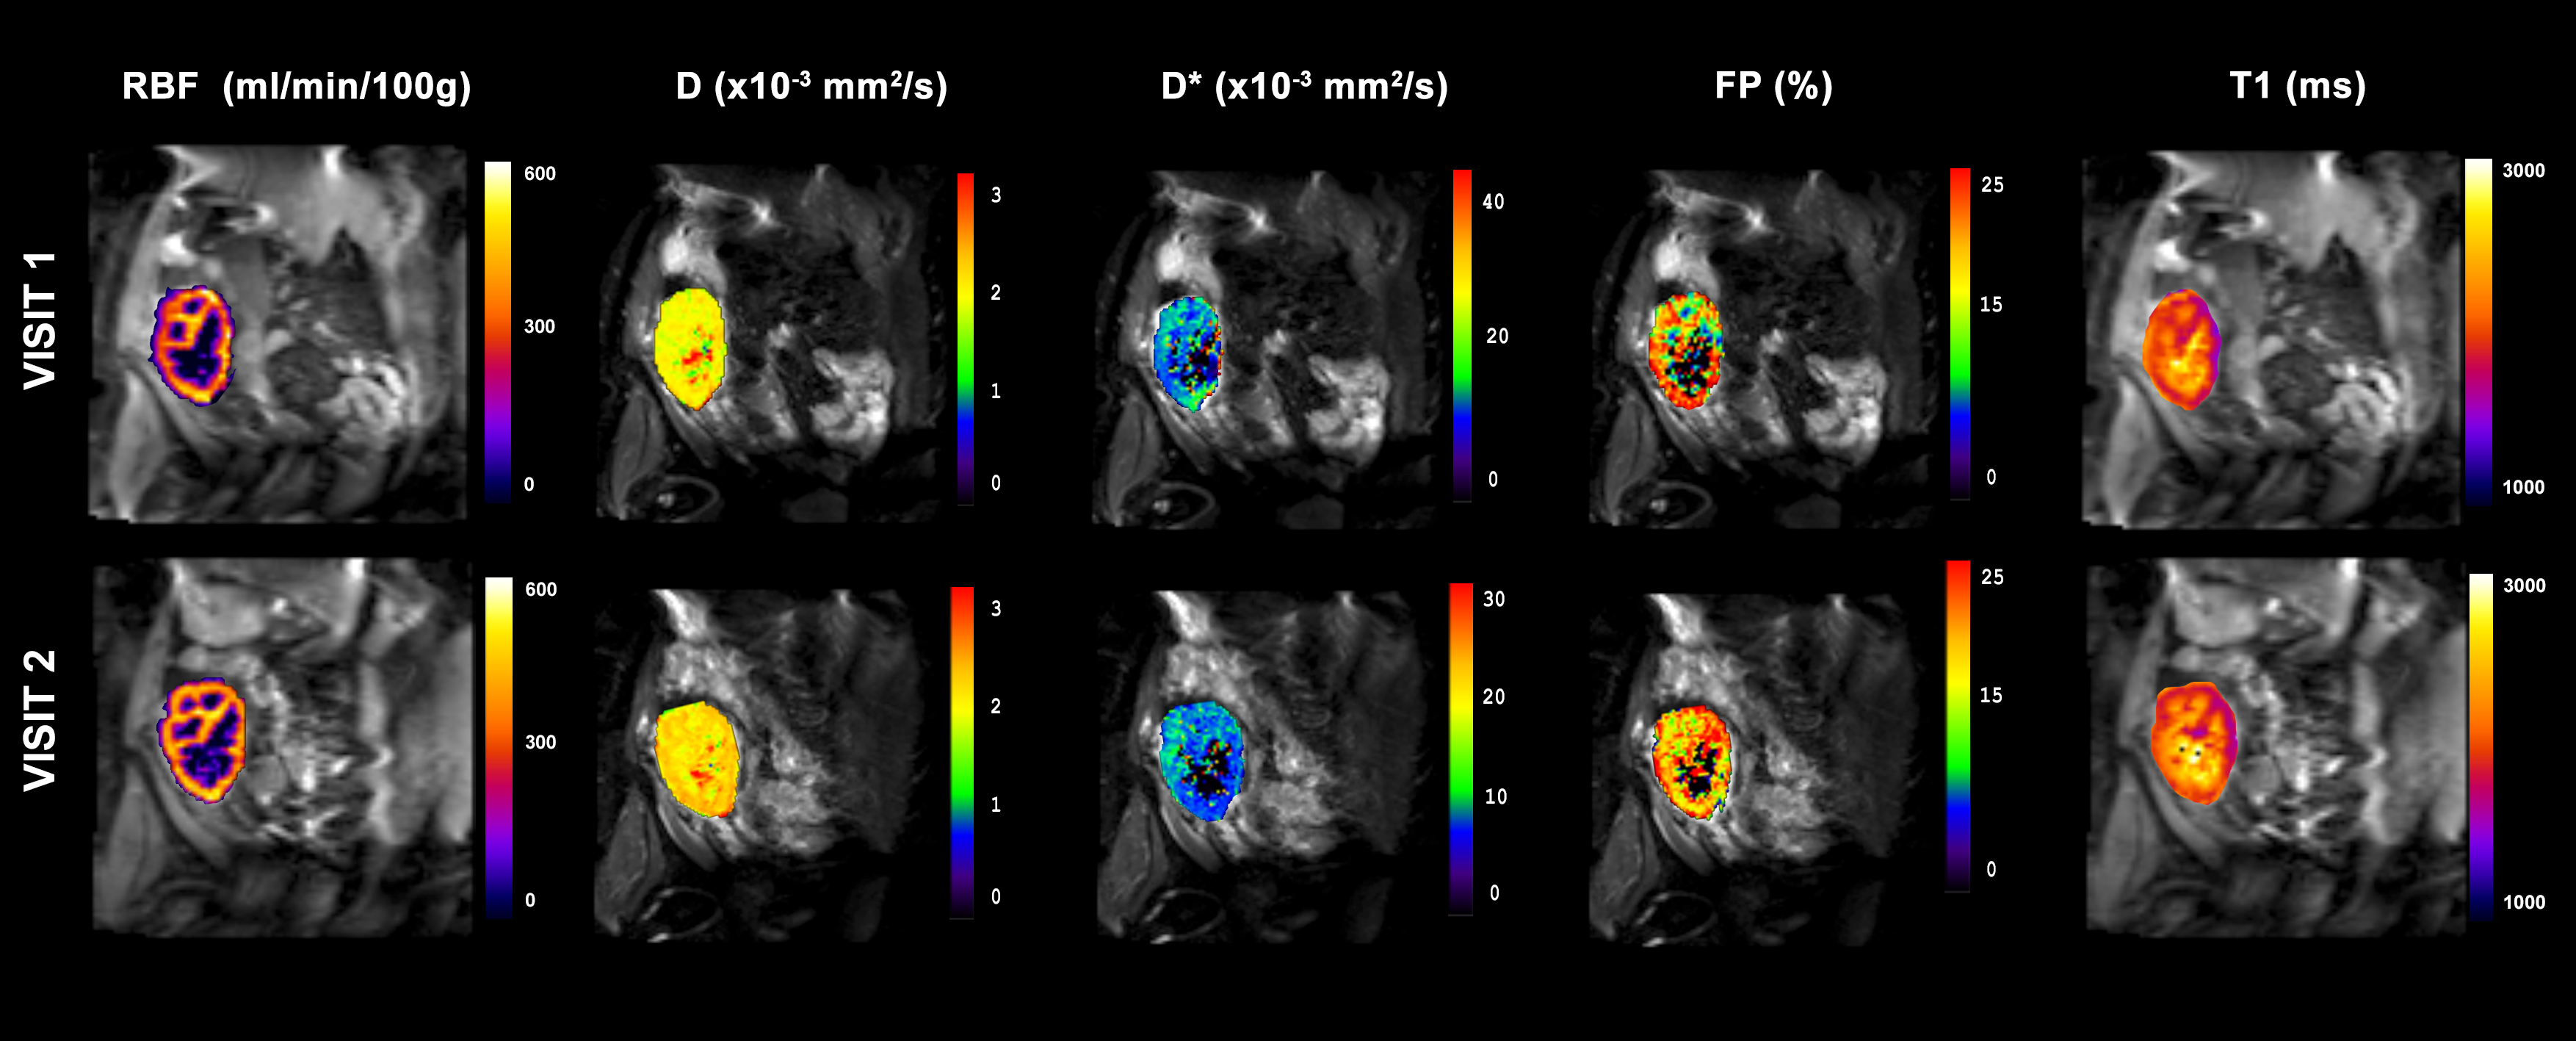
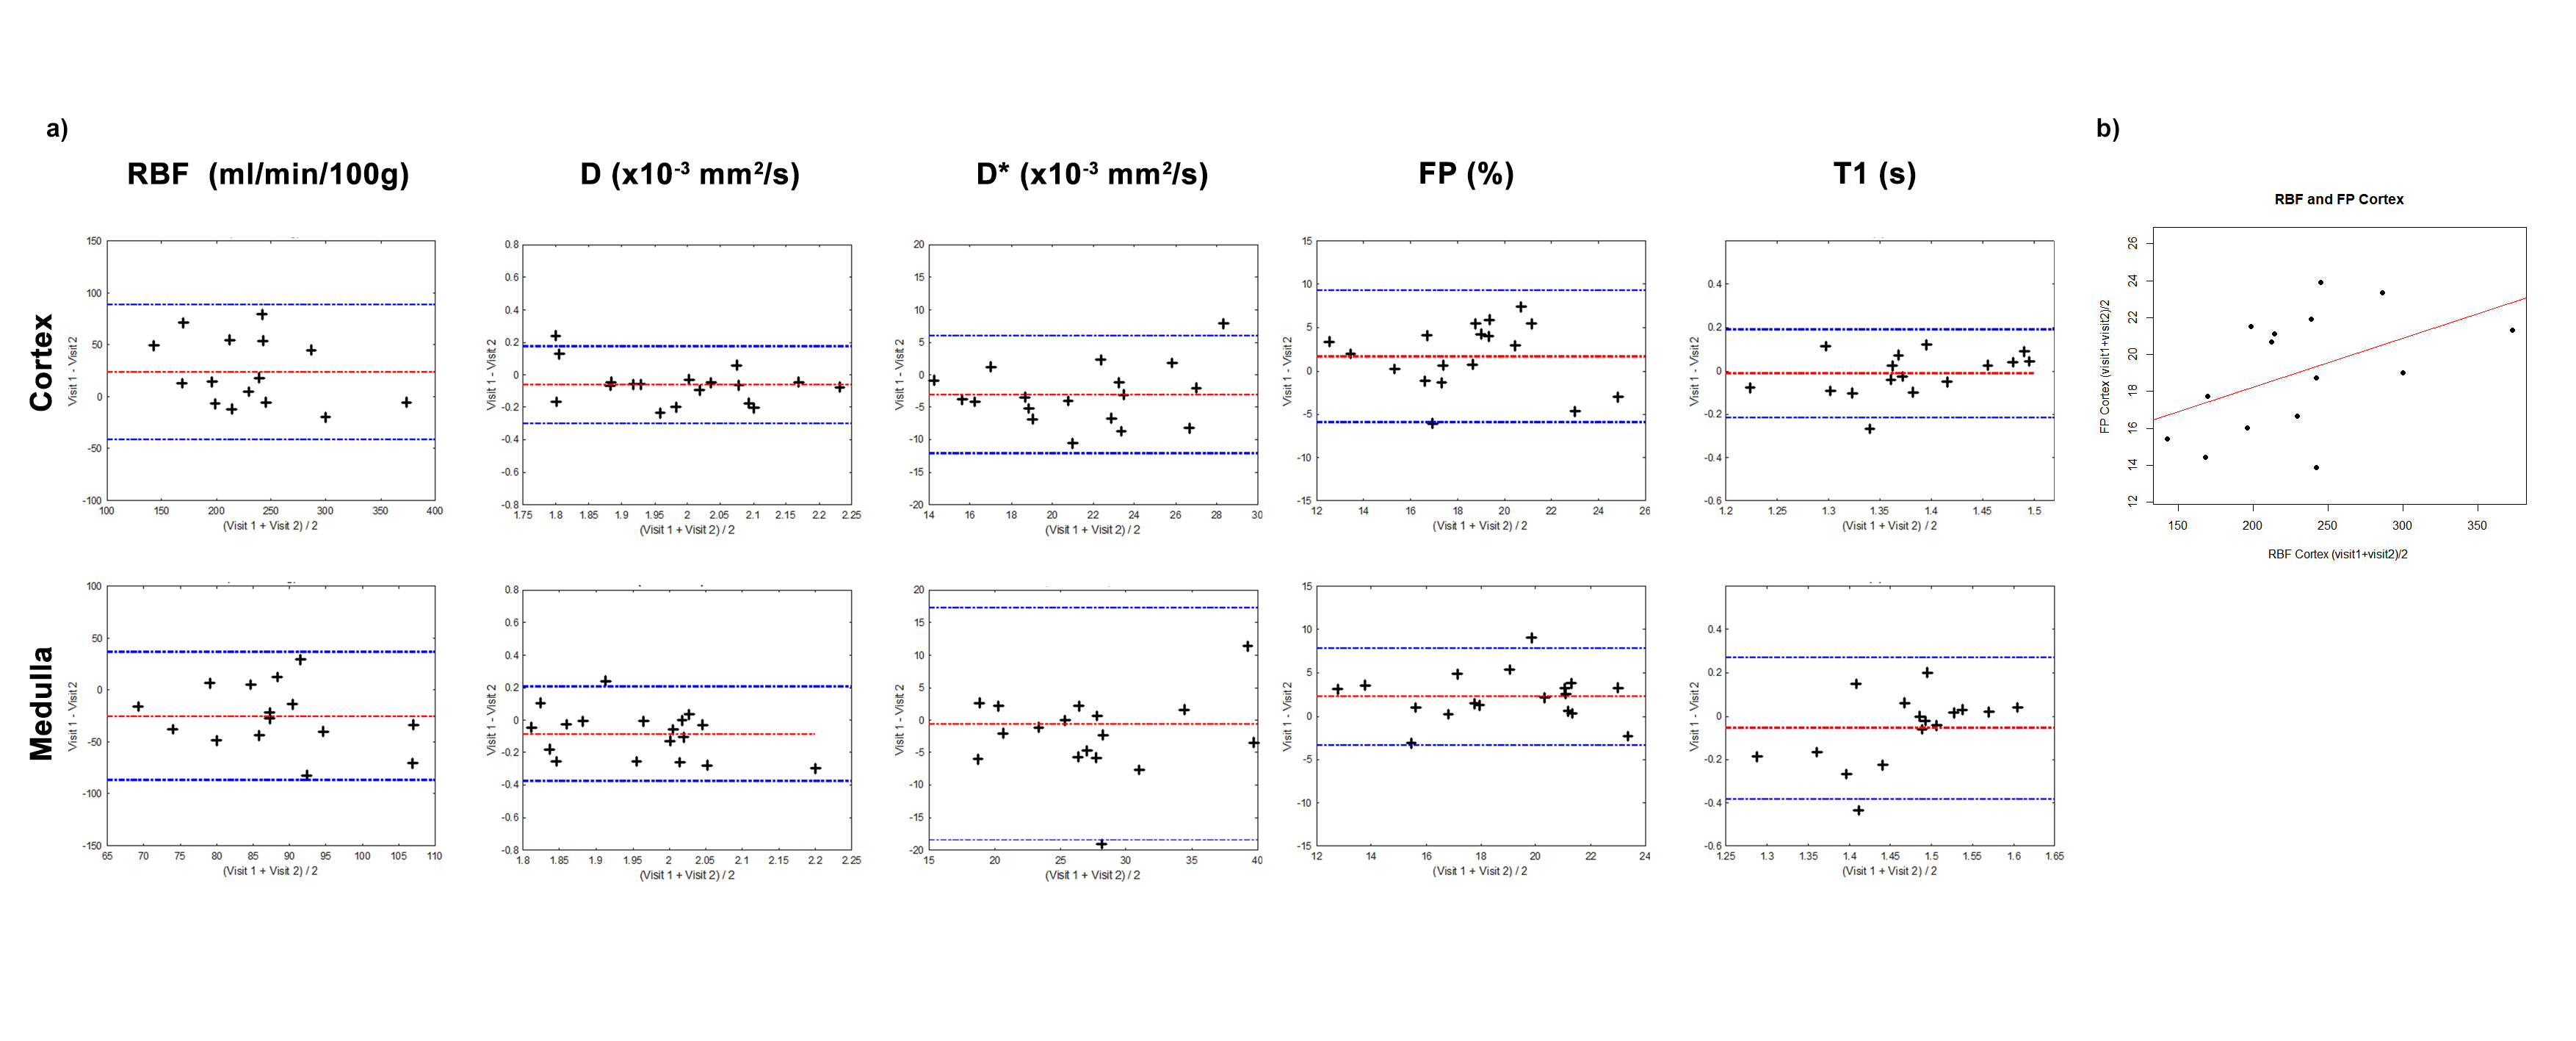
Figure 1 shows an example of multiparametric MRI maps obtained in one subject. Table 3 shows MRI parameters mean±SD values calculated for all the subjects and their correspondent CVws and ICC coefficients. Figure 2a shows cortical and medullar Bland-Almant plots for each parameter. Figure 2b shows the correlation between RBF and FP in the cortex, r=0.47. Results in RBF, D, D*, FP and T1 agree with values reported in the literature (12–14).CVws of the 3 techniques shows promising results, being <20% in the majority of the cases and being very low (<6%) for cortex and medulla for T1, and D, and low (<15 %) for RBF in the cortex and T1 in the medulla. ICC shows good reproducibility of the measurements for T1 mapping and PCASL (>85%), and acceptable results (>60%) for D and FP maps.
Therefore, this study demonstrates that multiparametric MRI can be performed in a reproducible fashion in transplanted patients, opening the door for the reliable assessment of the allograft function with MRI.
Acknowledgements
Rebeca Echeverria-Chasco received Ph.D. grant support from Siemens Healthcare Spain.References
1. Nery F, Buchanan CE, Harteveld AA, et al. Consensus-based technical recommendations for clinical translation of renal ASL MRI. Magn. Reson. Mater. Physics, Biol. Med. 2020;33:141–161 doi: 10.1007/s10334-019-00800-z.
2. Le Bihan D. Intravoxel incoherent motion imaging using steady-state free precession. Magn Reson Med 1988;7:346–351.
3. Friedli I, Crowe LA, Berchtold L, et al. New Magnetic Resonance Imaging Index for Renal Fibrosis Assessment: A Comparison between Diffusion-Weighted Imaging and T1 Mapping with Histological Validation. Sci. Rep. 2016;6:1–15 doi: 10.1038/srep30088.
4. Dai W, Garcia D, De Bazelaire C, Alsop DC. Continuous flow-driven inversion for arterial spin labeling using pulsed radio frequency and gradient fields. Magn. Reson. Med. 2008;60:1488–1497 doi: 10.1002/mrm.21790.
5. Wu WC, Fernández-Seara M, Detre JA, Wehrli FW, Wang J. A theoretical and experimental investigation of the tagging efficiency of pseudocontinuous arterial spin labeling. Magn. Reson. Med. 2007;58:1020–1027 doi: 10.1002/mrm.21403.
6. Echeverria-Chasco R, Aramendía-vidaurreta MVV, Cano D, Escalada J, Bastarrika G, Fernández-seara MA. Optimization of pseudo-continuous arterial spin labeling for renal perfusion imaging. Magn. Reson. Med. 2020:1–15 doi: 10.1002/mrm.28531.
7. Taso M, Guidon A, Alsop DC. Influence of background suppression and retrospective realignment on free-breathing renal perfusion measurement using pseudo-continuous ASL. Magn. Reson. Med. 2019;81:2439–2449 doi: 10.1002/mrm.27575.
8. Huizinga W, Poot DHJ, Guyader JM, et al. PCA-based groupwise image registration for quantitative MRI. Med. Image Anal. 2016;29:65–78 doi: 10.1016/j.media.2015.12.004.
9. Klein S, Staring M, Murphy K, Viergever MA, Pluim JPW. elastix: A Toolbox for Intensity-Based Medical Image Registration. IEEE Trans. Med. Imaging 2010;29:196–205.
10. Vidorreta M, Wang Z, Rodriguez I, Pastor MA, Detre JA, Fernández-Seara MA. Comparison of 2D and 3D single-shot ASL perfusion fMRI sequences. Neuroimage 2013;66:662–671 doi: 10.1016/j.neuroimage.2012.10.087.
11. Team RC. R: A language and environment for statistical computing. 2013.
12. Caroli A, Schneider M, Friedli I, et al. Diffusion-weighted magnetic resonance imaging to assess diffuse renal pathology: a systematic review and statement paper. Nephrol. Dial. Transplant 2018;33:ii29–ii40 doi: 10.1093/ndt/gfy163.
Figures
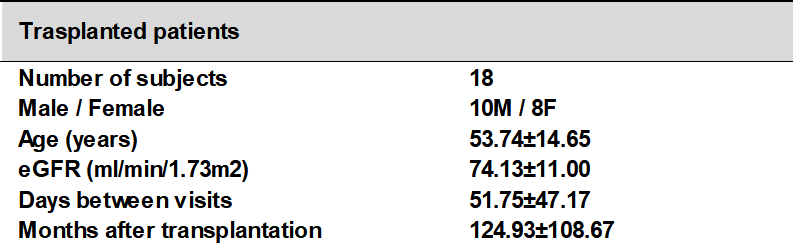
Table 1: Subject demographics and the days between visits for the 18 renal transplanted subjects with renal stable function that participated in the study.