2748
Mapping water exchange rate change after caffeine uptake using 3D diffusion prepared arterial spin labeled perfusion MRI1Cornell University, New York, NY, United States, 2Weill Cornell Medical College, New York, NY, United States
Synopsis
We propose to exam the water exchange rate (kw) change after caffeine uptake based on an optimized diffusion prepared arterial spin labeling (ASL) sequence and reconstruction method in a previous work1. 5 subjects went through two scans to test the reproducibility of the reconstruction pipeline. Another 5 subjects are scanned before and half an hour after caffeine uptake. Cerebral blood flow (CBF) and are reconstructed from the ASL images. A 26% decrease in CBF and 13% decrease of kw is observed.
Introduction
The blood–brain barrier plays a critical role in regulating delivery of oxygen and nutrients to the brain, clearance of toxic metabolites, and protection of the central nervous system (CNS) from infection1. Recently, an ASL signal model is raised to map the signal change in capillary and tissue compartment and can be used to calculate water exchange rate ($$$k_w$$$ )2,3,4. However, ($$$k_w$$$ ) change after neuro stimulation hasn’t been fully explored. In this study, we propose to test the ($$$k_w$$$ ) change after caffeine uptake.Methods
Algorithm: Recently, a capillary-tissue compartment model of pseudo-continuous ASL (pCASL) signal incorporating the exchange rate of water from blood to tissue is raised3,4:$$ \Delta M_b(t)=\frac{2CBF\varepsilon M_0\beta }{\lambda}[\frac{e^{-(R_{1a}-R_{1b})\tau_a}}{R_{1b}}(e^{-R_{1b}(t-\delta)}-e^{-R_{1b}t})-\frac{e^{-(R_{1a}-\alpha)\tau_a}}{\alpha}(e^{-\alpha(t-\delta)}-e^{-\alpha t})] \qquad (1) $$
$$ \Delta M_c(t)=\frac{2CBF\varepsilon M_0 e^{-(R_{1a}-R_{1b})\tau_a}}{\lambda\alpha}(e^{-\alpha(t-\delta)}-e^{-\alpha t}) \qquad (2) $$
Where $$$\delta M_b(t) $$$ and $$$\delta M_c(t) $$$ are signal in tissue and capillary compartment, respectively. $$$CBF$$$ is cerebral blood flow, which is calculated from ASL data without diffusion preparation pulse5. $$$\varepsilon=0.8$$$ is tagging efficiency. $$$M_0$$$ is proton density map.$$$\lambda =0.9 mL/g$$$ is partition coefficient of water in brain, $$$R_{1a}=0.6/s $$$ and $$$R_{1b} $$$ acquired using FAST T1 mapping sequence are longitudinal relaxation rate of blood and tissue, respectively6. $$$\tau_a$$$ is arterial transit time and is set to 1.25s for healthy subjects2. $$$\delta=1.5s$$$ is labeling time.$$$PLD=1.8s$$$ is post labeling delay and $$$t=\delta+PLD$$$ . $$$\alpha=k_w+R_{1a}$$$ and $$$\beta=k_w/(k_w+R_{1a}-R_{1b})$$$ are model parameters. $$$\delta M_b(t) $$$ and $$$\delta M_c(t) $$$ are acquired with/without diffusion preparation pulses3. $$$k_w$$$ can be calculated using a previously proposed non-linear fitting method1.
Data acquisition and processing: 5 subjects are scanned twice without caffeine uptake to test the reproducibility of the proposed kw reconstruction method, and 5 subjects are scanned before and after 300mg caffeine uptake. Image parameters were: voxel size 1.875*1.875*4 mm3, field of view 24cm, number of slices 36. Duration of the 4 diffusion gradient lobes are 8.32ms and the amplitude is 3 gauss/cm to make b-value=50. The value in different regions is calculated by registering the T1 anatomical image to an AAL atlas7.
Results:
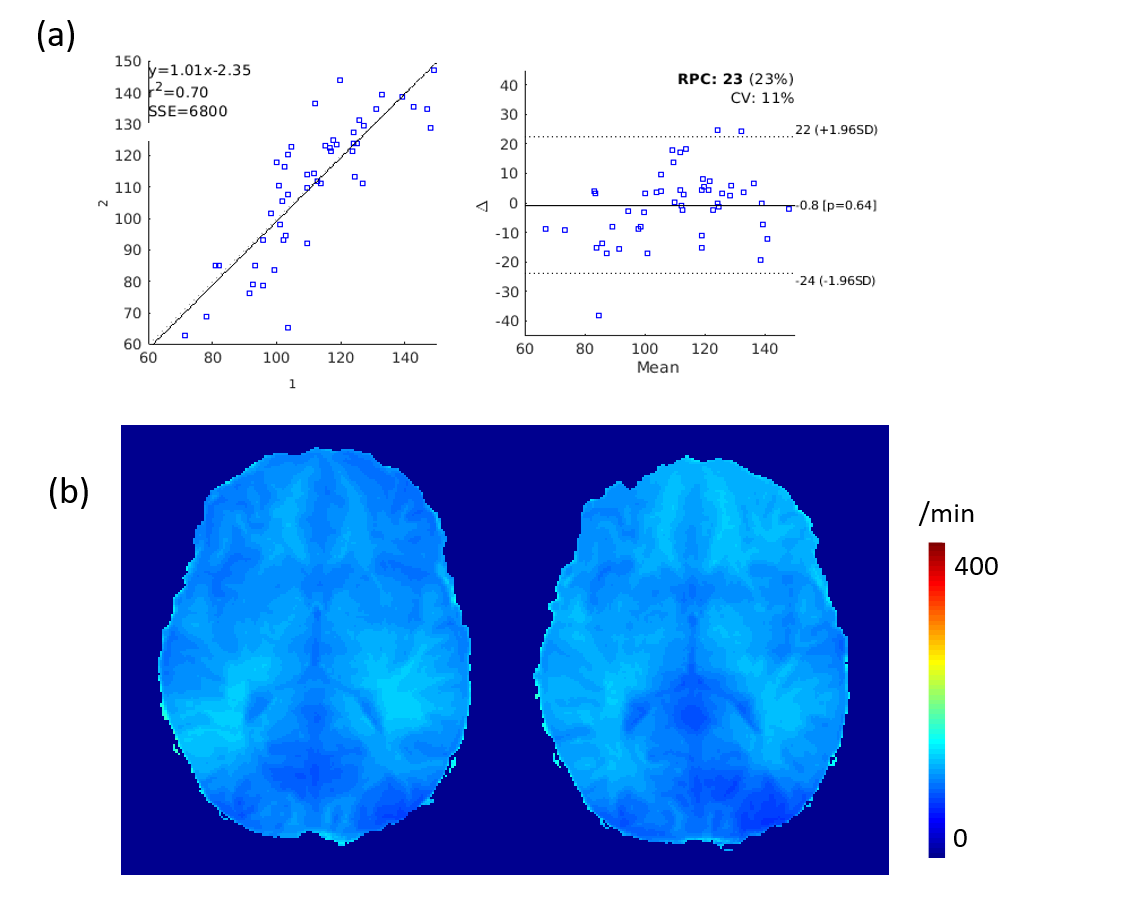
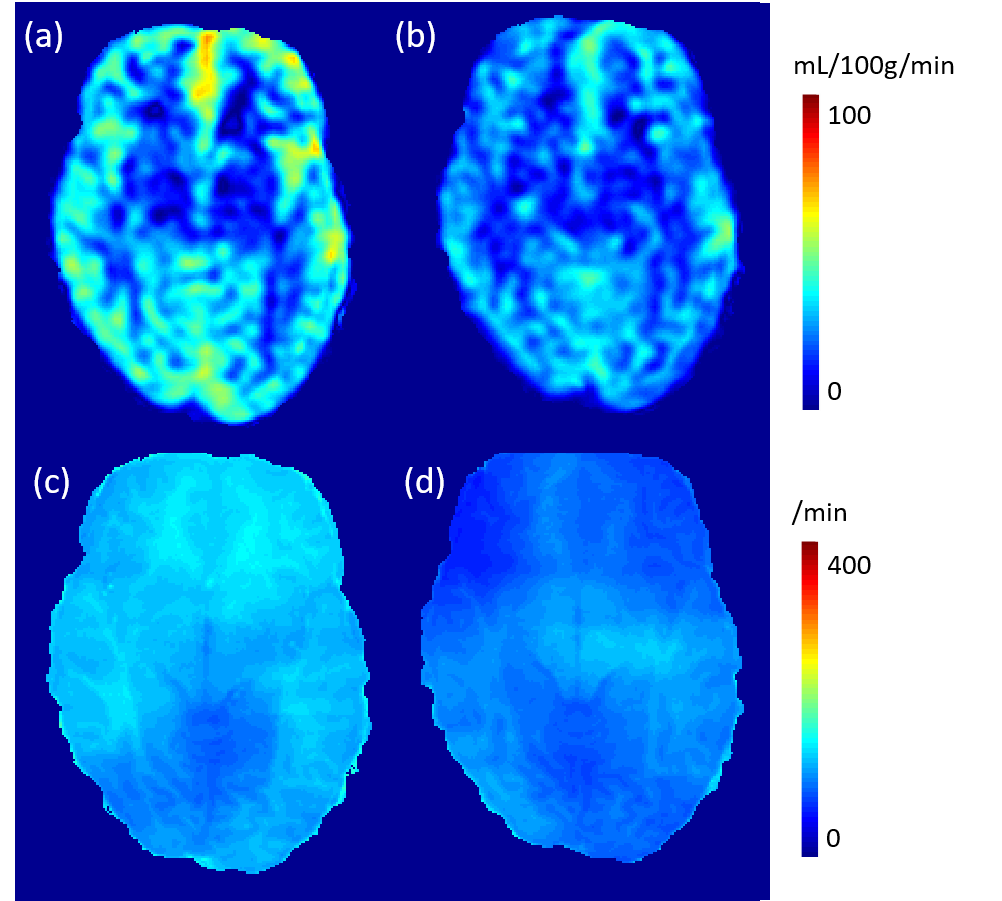
The Bland-Altman plot for $$$k_w$$$ value of 10 brain regions (left/right putamen, left/right rostral middle frontal, left/right precuneous, left/right whole gray matter, left/right whole white matter)is shown in figure 1a. A good reproducibility (ICC=0.77) is observed. One representative $$$k_w$$$ map for the first scan and second scan is shown in figure 1b. Reconstructed $$$k_w$$$ map before and after caffeine uptake is shown in figure 2 c and d. A 15% decrease of $$$k_w$$$is observed in gray matter and a 10% decrease is observed in white matter. Meanwhile, A 30% decrease of CBF is observed in gray matter and a 21% decrease is observed in white matter.Discussion and Conclusion:
We tested the reproducibility of the proposed $$$k_w$$$ reconstruction method and observed an overall 12% decrease in $$$k_w$$$ after caffeine uptake. One possible reason for the $$$k_w$$$ decrease is caffeine may increase the osmotic pressure of blood; thus, less water is exchanged to extravascular space. Further work may include cross-validation of this result with PET imaging.Acknowledgements
We don't have anything to acknowledge.References
1. Daneman R, Prat A. The blood–brain barrier. Cold Spring Harb Perspect Biol. 2015;7: a020412.
2. Zhang Q, Nguyen T, Ivanidze J, Wang Y. Quantitative High Resolution water exchange rate mapping using 3D diffusion prepared arterial spin labeled perfusion MRI. ISMRM & SMRT Virtual Conference. 08/10/2020;
3. Shao X, Ma S J, Casey M, et al. Mapping water exchange across the blood–brain barrier using 3D diffusion‐prepared arterial spin labeled perfusion MRI[J]. Magnetic resonance in medicine, 2019, 81(5): 3065-3079.
4. St. Lawrence K S, Owen D, Wang D J J. A two‐stage approach for measuring vascular water exchange and arterial transit time by diffusion‐weighted perfusion MRI[J]. Magnetic resonance in medicine, 2012, 67(5): 1275-1284.
5. Buxton R B. Quantifying CBF with arterial spin labeling[J]. Journal of Magnetic Resonance Imaging: An Official Journal of the International Society for Magnetic Resonance in Medicine, 2005, 22(6): 723-726.
6. Nguyen T D, de Rochefort L, Spincemaille P, et al. Effective motion‐sensitizing magnetization preparation for black blood magnetic resonance imaging of the heart[J]. Journal of Magnetic Resonance Imaging: An Official Journal of the International Society for Magnetic Resonance in Medicine, 2008, 28(5): 1092-1100.
7. Automated Anatomical Labeling of Activations in SPM Using a Macroscopic Anatomical Parcellation of the MNI MRI Single-Subject Brain. N. Tzourio-Mazoyer, B. Landeau, D. Papathanassiou, F. Crivello, O. Étard, N. Delcroix, B. Mazoyer, and M. Joliot. NeuroImage 2002, 15 :273-289
Figures