2747
Association of Arterial Spin Labeling Global Metrics and Attentional Processes1Department of Computer Science, State University of New York at Binghamton, Binghamton, NY, United States, 2Department of Psychology, State University of New York at Binghamton, Binghamton, NY, United States, 3National Institute on Aging, National Institutes of Health, Baltimore, MD, United States
Synopsis
We investigated the relationship between brain global activity or global topology of brain networks and attentional processes. The former measures were evaluated by dynamic arterial spin labeling (ASL) perfusion fMRI. The latter measures were assessed by P3 amplitude and latency in event-related potentials (ERPs). The P3 properties were significantly correlated with numbers of correct response. We found positive associations between global perfusion and P3 amplitude and between characteristic path length and P3 latency, and negative associations between global perfusion, global efficiency, mean functional connectivity and P3 latency, indicating close correlation of brain global behavior and attention.
Introduction
Event-related potentials (ERPs) provide high-resolution measures of the time course of neuronal activity patterns associated with cognitive processes. The P3 is an important ERP component in investigations of attention and information processing [1] and is therefore widely used in different applications including clinical diagnosis [2-4]. However, P3 parameters, P3 amplitude and latency, vary markedly among subjects. Previous studies have shown that the P3 is correlated with the activity of several brain cortices [5-8], which are mainly focal regions. The brain cognitive processes, including attention, involve interactions between distributed brain regions, instead of isolated operations of focal regions. In this study, we investigate the role of brain global activity or global integration, measured using dynamic arterial spin labeling (ASL) perfusion fMRI, on the P3 parameters.Methods
Ten healthy college students (19.20±0.28 years old, age range: 19 to 20 years old, 4 females) participated in the study, which was designed to study the effects of meditation. Each participant was scanned twice (two months apart). During each session, each participant was scanned first with T1-weighted images for image registration and resting-state dynamic pseudo-continuous arterial spin labeling (PCASL) sequence [9] for measuring global perfusion and global topology of brain networks. The participant was taken out of the scanner and performed ERP visual oddball tasks for measuring the P3. For the ERP experiment, the target stimulus (symbol “X” on the center of screen) was randomly presented 25% of the time (40 trials). Participants were instructed to press the left button for “X” and the right button for “O” (160 trials). The number of correct responses was calculated as the number of times when the participant pressed the correct button.For each subject, the mean ASL difference image was used to derive the absolute perfusion map using the flow kinetic model [10]. The ASL difference time series and absolute perfusion map were transformed to the standard brain space using the T1-weighted images as an intermediate. Global perfusion was calculated as the mean absolute perfusion over the entire brain mask. ASL regional time series was calculated using median regional signals for each of 90 regions from the AAL atlas. Pair-wise Pearson correlation coefficient for any two regions was used to describe their connectivity. To calculate global network topology, we calculated global efficiency, characteristic path length, and mean functional connectivity as described in the literature [11] by using the Pearson correlation matrix of 90 regions. For the ERP data, the preprocessing included 0.1-30Hz bandpass filtering, data segmentation, detection of artifacts (bad channels, eye blink, eye movement), bad channel replacement, averaging, baseline correction, and average referencing. After preprocessing, an average ERP for each stimulus (i.e., standard and target) was generated for each subject. P3 amplitude and latency was estimated using the difference ERP of target and standard stimuli at the Pz electrode. P3 amplitude was defined as the largest average amplitude in the 100ms time window within [250ms, 600ms]. P3 latency was defined as the earliest time point in which the P3 amplitude exceeds half of its peak amplitude when moving backward in time starting at the peak. Due to potential outliers and violation of normal distribution from repeated data of the same subjects, Spearman correlation analysis, instead of Pearson’s correlation analysis, was used to identify the association between the P3 properties and numbers of correct response and between the P3 properties and the global brain activity or global network topology.
Results & Discussion
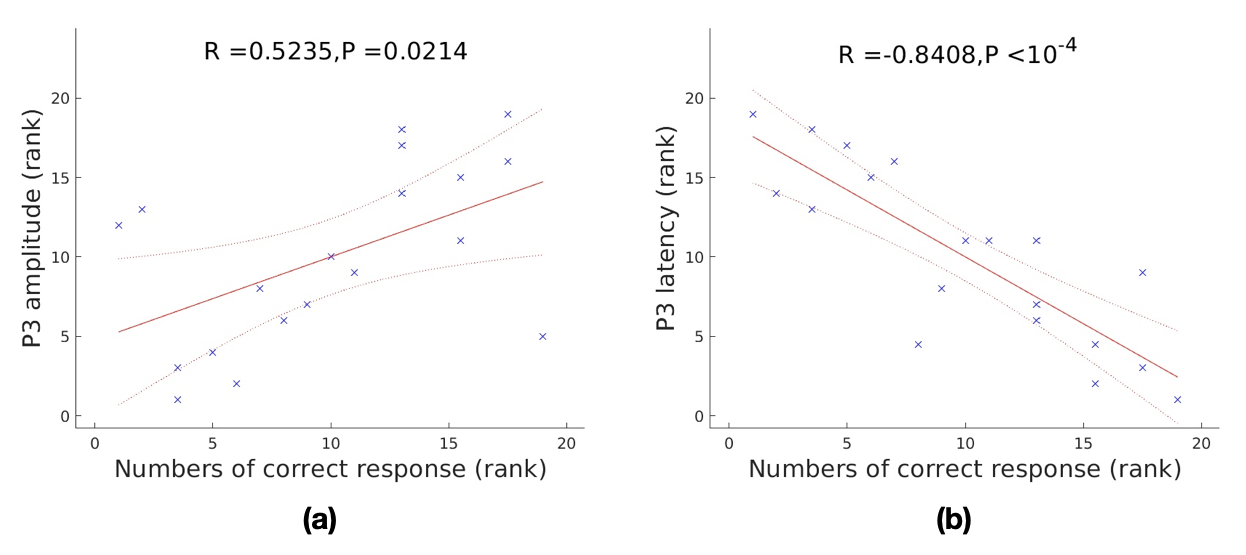
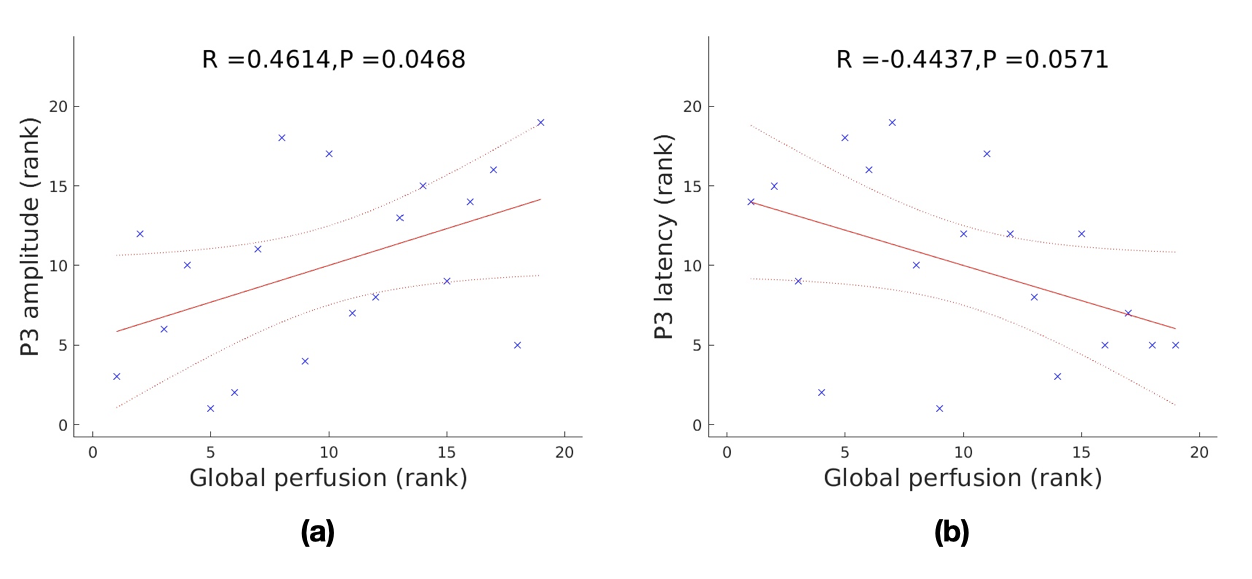
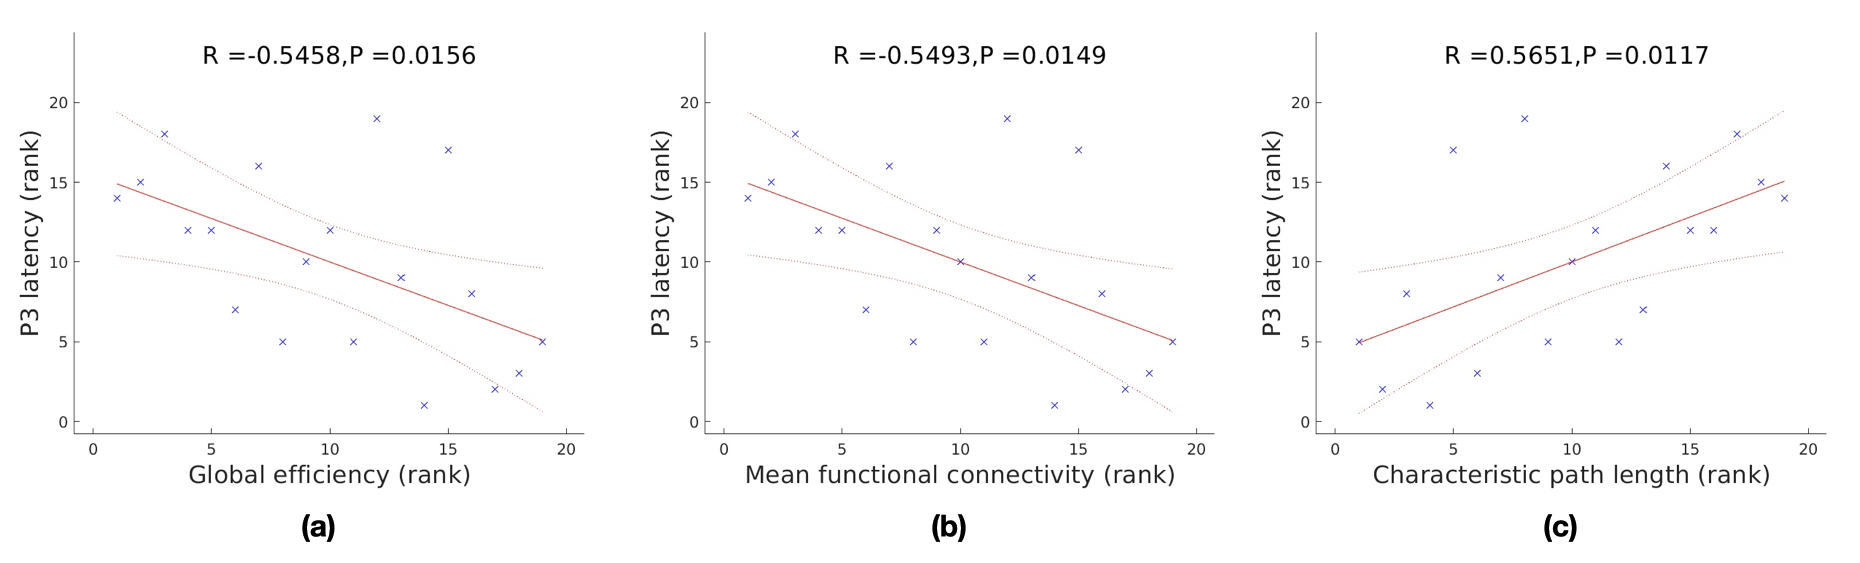
P3 amplitudes and latencies from two sessions showed significant correlation with numbers of correct response (p = 0.0214 and p < 10-4, respectively) (Fig. 1), indicating the link between the P3 parameters and task performance. Global perfusion was significantly correlated with P3 amplitude and marginally correlated with P3 latency (Fig. 2). Global efficiency and mean functional connectivity were negatively correlated with P3 latency (Fig. 3a and Fig. 3b). Characteristic path length was positively correlated with P3 latency (Fig. 3c). The results are generally consistent with a recent investigation [12]. However, they reported that the global resting-state metrics, measured by resting-state EEG, were only marginally related to P3 latency. P3 amplitude is directly proportional to the level of task-related attention, while P3 latency reflects the speed of information (stimulus) processing [13, 14]. Our results suggest that a global brain functional activity is related to brain attention level and a globally efficient brain network can provide more efficient information processing.Conclusion
We demonstrated that resting-state dynamic ASL can measure brain global functional activity and global topology of brain networks. The ASL global metrics are closely correlated brain attention level and information processing speed.Acknowledgements
No acknowledgement found.References
1. Sutton S, Braren M, Zubin J, and John ER, Evoked-potential correlates of stimulus uncertainty. Science, 1965;150(3700):1187-8.
2. Polich J, Updating P300: an integrative theory of P3a and P3b. Clin Neurophysiol, 2007;118(10):2128-48.
3. Turetsky BI, Dress EM, Braff DL, Calkins ME, Green MF, Greenwood TA, Gur RE, Gur RC, Lazzeroni LC, Nuechterlein KH, Radant AD, Seidman LJ, Siever LJ, Silverman JM, Sprock J, Stone WS, Sugar CA, Swerdlow NR, Tsuang DW, Tsuang MT, and Light G, The utility of P300 as a schizophrenia endophenotype and predictive biomarker: clinical and socio-demographic modulators in COGS-2. Schizophr Res, 2015;163(1-3):53-62.
4. Howe AS, Bani-Fatemi A, and De Luca V, The clinical utility of the auditory P300 latency subcomponent event-related potential in preclinical diagnosis of patients with mild cognitive impairment and Alzheimer's disease. Brain Cogn, 2014;86:64-74.
5. Pfabigan DM, Seidel EM, Sladky R, Hahn A, Paul K, Grahl A, Kublbock M, Kraus C, Hummer A, Kranz GS, Windischberger C, Lanzenberger R, and Lamm C, P300 amplitude variation is related to ventral striatum BOLD response during gain and loss anticipation: an EEG and fMRI experiment. Neuroimage, 2014;96:12-21.
6. Chen CC, Syue KS, Li KC, and Yeh SC, Neuronal correlates of a virtual-reality-based passive sensory P300 network. PLoS One, 2014;9(11):e112228.
7. Fusar-Poli P, Crossley N, Woolley J, Carletti F, Perez-Iglesias R, Broome M, Johns L, Tabraham P, Bramon E, and McGuire P, Gray matter alterations related to P300 abnormalities in subjects at high risk for psychosis: longitudinal MRI-EEG study. Neuroimage, 2011;55(1):320-8.
8. Fusar-Poli P, Crossley N, Woolley J, Carletti F, Perez-Iglesias R, Broome M, Johns L, Tabraham P, Bramon E, and McGuire P, White matter alterations related to P300 abnormalities in individuals at high risk for psychosis: an MRI-EEG study. J Psychiatry Neurosci, 2011;36(4):239-48.
9. Dai W, Varma G, Scheidegger R, and Alsop DC, Quantifying fluctuations of resting state networks using arterial spin labeling perfusion MRI. J Cereb Blood Flow Metab, 2016;36(3):463-73.
10. Buxton RB, Frank LR, Wong EC, Siewert B, Warach S, and Edelman RR, A general kinetic model for quantitative perfusion imaging with arterial spin labeling. Magn Reson Med, 1998;40(3):383-96.
11. Rubinov M and Sporns O, Complex network measures of brain connectivity: uses and interpretations. Neuroimage, 2010;52(3):1059-69.
12. Li F, Liu T, Wang F, Li H, Gong D, Zhang R, Jiang Y, Tian Y, Guo D, Yao D, and Xu P, Relationships between the resting-state network and the P3: Evidence from a scalp EEG study. Sci Rep, 2015;5:15129.
13. Polich J and Kok A, Cognitive and biological determinants of P300: an integrative review. Biol Psychol, 1995;41(2):103-46.
14. Polich J, Meta-analysis of P300 normative aging studies. Psychophysiology, 1996;33(4):334-53.
Figures