2745
Arterial Spin Labeling Can Identify Cerebrovascular Reactivity Deficit in Patients with Vasculopathy: A Pilot Study Using Simultaneous PET/MRI1Radiology, Stanford University, Stanford, CA, United States, 2Biomedical Engineering and Neurology, University of California Davis, Davis, CA, United States, 3Medical Imaging, Taipei Medical University – Shuan-Ho Hospital, New Taipei City, Taiwan, 4Department of Radiology, School of Medicine, College of Medicine, Taipei Medical University, Taipei, Taiwan, 5Bioengineering, University of California Riverside, Riverside, CA, United States, 6Neurosurgery, Tokyo Medical and Dental University, Tokyo, Japan, 7GE Healthcare, Melo Park, CA, United States, 8Neurosurgery, Stanford University, Stanford, CA, United States
Synopsis
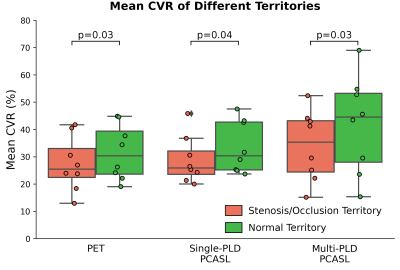
Cerebrovascular reactivity (CVR) reflects the capacity of the brain to respond to external stress. Impaired CVR leads to a higher risk of stroke. The standard CVR measuring tool relied on PET imaging but is inaccessible to most patients. Here we investigate the CVR of Moyamoya patients using arterial spin labeling (ASL), a non-invasive and quantitative MRI technique. Results showed that significant lower CVR was found in flow territories with severe stenosis or occlusion, making ASL a potential diagnostic tool to predict the risk of stroke for patients with vasculopathy.
Introduction
Cerebrovascular reactivity (CVR) is an important biomarker that reflects the capacity of cerebral vasodilation in response to a pharmacological challenge1. Impaired CVR can lead to a higher risk of stroke by 4-fold2. CVR can be obtained by measuring the change in cerebral blood flow (CBF) induced by a vasodilator such as acetazolamide (ACZ)3. The current gold standard for CBF measurements is PET imaging with O-15 water, but the procedure is impractical to most patients due to the requirement of an in-house cyclotron to produce the short-lived radiotracer. Arterial spin labeling (ASL) is a non-invasive and quantitative MRI technique to measure CBF and CVR without radiotracers4. While ASL data acquired with a single post-labeling delay using pseudo-continuous labeling (single-PLD PCASL) technique was the recommended technique for measuring CBF in clinical applications5, the multiple post-labeling delay (multi-PLD) technique has shown higher accuracy in CVR measurements of normal subjects using PET as the reference6. The effectiveness of ASL to measure CVR in patients remains unknown.Here, we investigate the CVR of 8 patients with Moyamoya disease, a profound vasculopathy that often leads to stroke. We compare the regional CVR measured by single- and multi-PLD PCASL with the O-15 water PET reference.
Methods
PET/MRI data were collected from 8 Moyamoya patients (2 males, 31 – 63 years old). All patients had severe stenosis or occlusion in their anterior cerebral artery (ACA), middle cerebral artery (MCA), or posterior cerebral artery (PCA). Each subject underwent ACZ administration at a dose of 15 mg/kg of body weight with a maximum of 1g during the imaging procedures. All imaging data were acquired using a simultaneous 3T PET/MRI system (SIGNA; GE Healthcare, Waukesha, WI, USA). MRA, T2 FLAIR, and T1-weighted structural images were acquired before the administration of ACZ. PET, single- and multi-PLD PCASL scans were performed before and 15 minutes after ACZ administration.PET image acquisition commenced with the tracer injection for 10 minutes. Dynamic PET frames over ten minutes (30x1, 10x3, 12x5, 12x10, 12x30 s) after the injection of the tracer were reconstructed using a TOF-ordered subset expectation maximization algorithm with 3 iterations and 28 subsets. CBF of PET techniques were computed by fitting the pharmacokinetic model7.
The single-PLD PCASL was conducted using GE’s ASL product sequence parameters with PLD=2025ms, bolus duration=1450ms, interleave arms=6, and NEX=38. The multi-PLD PCASL was implemented using the same parameters as in the single-PLD except for PLD=700, 1325, 1950, 2575, 3200ms, bolus duration=2000ms, interleave arms=4, and NEX=1. CBF of ASL techniques were quantified by fitting the general kinetic model to the ASL difference data9, assuming the inversion efficiency of 85%, signal loss due to background suppression of 25%, and brain/blood partition coefficient of 0.9 ml/g.
CVR was computed as the percentage change in CBF with respect to baseline CBF. All CBF and CVR images were transformed to the template space using a combination of linear and non-linear registration. Flow territories of left and right ACA, MCA, and PCA were obtained in the MNI-152 2mm template space10. Paired t-tests were performed to compare the mean CVR of the regions with stenosis/occlusion to healthy regions.
Results
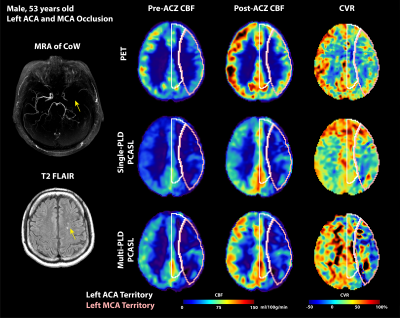
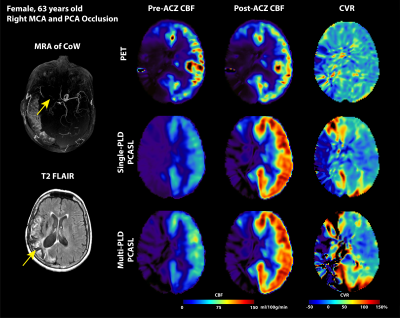
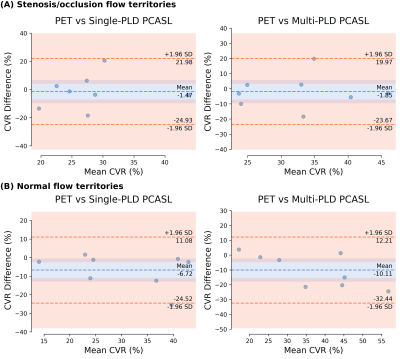
Figure 1 and Figure 2 show the structural and flow maps of 2 example Moyamoya patients with unilateral stenosis and/or occlusion. In both patients, the CBF and CVR of the affected regions were significantly lower than the healthy regions. Figure 3 shows the comparison of mean CVR in territories with stenosis and/or occlusion versus territories with normal flow. For all PET and ASL techniques, the CVR of the diseased regions were significantly lower than the healthy regions. Figure 4 shows the CVR mean and difference between PET and ASL techniques in diseased and normal flow territories. The between-modality CVR difference was lower in the diseased territories than in normal flow territories.Discussion
In this study, we compared the CVR of Moyamoya patients measured by the non-invasive ASL techniques to the gold standard but invasive PET technique. Using PET as the reference, both single- and multi-PLD PCASL methods successfully identified the CBF and CVR deficit in stenosis/occlusion flow territories, implying the potential for ASL to replace PET to measure CBF and CVR in patients with vasculopathy. We observed hyperintense CVR signals near the affected regions, which is likely due to the low SNR of ASL data in the white matter regions. This may be alleviated by additional post-processing techniques including filtering and partial volume correction. The correlation between impaired CVR and existing markers (such as ADC and T-max) may further demonstrate the potential value of CVR as a diagnostic biomarker.Acknowledgements
This work is supported by the NIH grant R01EB025220-02 and 4R00NS102884-03.References
1.Pinto, J., Jorge, J., Sousa, I., Vilela, P. & Figueiredo, P. Fourier modeling of the BOLD response to a breath-hold task: Optimization and reproducibility. NeuroImage 135, 223–231 (2016)
2.Miyamoto Susumu et al. Effects of Extracranial–Intracranial Bypass for Patients With Hemorrhagic Moyamoya Disease. Stroke 45, 1415–1421 (2014)
3.Ellis, M. J. et al. Neuroimaging Assessment of Cerebrovascular Reactivity in Concussion: Current Concepts, Methodological Considerations, and Review of the Literature. Front. Neurol. 7, (2016)
4.Zhao, M. Y. et al. Quantification of cerebral perfusion and cerebrovascular reserve using Turbo-QUASAR arterial spin labeling MRI. Magn. Reson. Med. 83, 731–748 (2020)
5.Alsop, D. C. et al. Recommended implementation of arterial spin-labeled perfusion MRI for clinical applications: A consensus of the ISMRM perfusion study group and the European consortium for ASL in dementia. Magn. Reson. Med. 73, 102–116 (2015)
6.Fan, A. P. et al. Long-Delay Arterial Spin Labeling Provides More Accurate Cerebral Blood Flow Measurements in Moyamoya Patients: A Simultaneous Positron Emission Tomography/MRI Study. Stroke (2017) doi:10.1161/STROKEAHA.117.017773.7.Khalighi, M. M. et al. Image-derived input function estimation on a TOF-enabled PET/MR for cerebral blood flow mapping. J. Cereb. Blood Flow Metab. 38, 126–135 (2018)
8.Mutsaerts, H. J. M. M. et al. Inter-vendor reproducibility of pseudo-continuous arterial spin labeling at 3 Tesla. PLoS ONE (2014) doi:10.1371/journal.pone.0104108
9.Chappell, M. A., Groves, A. R., Whitcher, B. & Woolrich, M. W. Variational Bayesian Inference for a Nonlinear Forward Model. IEEE Trans. Signal Process. 57, 223–236 (2009)
10. Schirmer, M. D. et al. Spatial Signature of White Matter Hyperintensities in Stroke Patients. Front. Neurol. 10, (2019).
Figures


