2744
Moving Towards Robust Quantification of Cerebrovascular Reactivity (CVR) using Pseudocontinuous Arterial Spin Labelling (pCASL)1The School of Life Sciences, University of Nottingham, Nottingham, United Kingdom, 2Wellcome Centre for Integrative Neuroimaging, FMRIB, Nuffield Department of Clinical Neurosciences, University of Oxford, Oxford, United Kingdom
Synopsis
New clinical tools are needed for the diagnosis and prognosis of cerebrovascular diseases. Pseudocontinuous Arterial Spin Labelling (pCASL) is recommended for quantifying tissue cerebral blood flow due to its superior signal-to-noise. Stressors to the brain like high carbon dioxide (hypercapnia), used to map Cerebrovascular Reactivity (CVR), are known to reduce the labelling efficiency of pCASL and therefore underestimate CVR. In this study a systematic difference in CVR was observed across measurements made with three different sets of pCASL parameters. Ultimately this work will help to determine pCASL parameters that minimise systematic error and produce robust quantitative estimates of CVR.
BACKGROUND
Problem: Nine out of ten strokes are preventable, therefore earlier prognosis and diagnosis of vascular disease in the brain (i.e. cerebrovascular diseases and stroke[1]) is needed.Solution: Pseudocontinuous Arterial Spin Labelling (pCASL) Magnetic Resonance Imaging (MRI) magnetically labels blood as it passes through arteries feeding the brain to quantify tissue cerebral blood flow (CBF). Cerebrovascular reactivity (CVR) is the ability of blood vessels in the brain to react to changes in CBF demand, which is altered in health (e.g. ageing) and disease (e.g. stroke)[2]. In healthy brains, a CVR response is provoked by an increased carbon dioxide (CO2) level (a stressor to the brain) and consequently increases the CBF. pCASL has been recommended for clinical patients because its higher signal-to-noise ratio results in more robust estimates of CBF[2]. However, blood labelling efficiency has been shown to decrease during the hypercapnic (high CO2) conditions used to measure CVR because of the associated increase in blood velocity in the internal carotid arteries (ICA) and vertebral arteries (VA)[3]. Furthermore, the magnitude of the change in labelling efficiency varies across different pCASL implementations due to differences in the pCASL preparation parameters[4]. This study aimed to investigate the effect of a hypercapnic challenge on three different sets of pCASL preparation parameters. The blood velocity in the ICAs and VAs was also characterised during hypercapnic conditions and used to estimate the change in labelling efficiency through simulation. Ultimately this work will help to determine the pCASL parameters that will minimise systematic error and produce robust quantitative estimates of CVR.
METHODS
Participants: Written informed consent was obtained from healthy volunteers (N=9, 4 females, aged 21.3±1.2 years) following local ethics committee approval.Task: Hypercapnic challenges (Fig. 1) were delivered using a prospective end-tidal targeting system[5] (RespirAct Gen 3TM, Thornhill Medical, Toronto, Canada) to target the end-tidal partial pressure of CO2 (PetCO2) at ±10mmHg above/below the subject’s resting PetCO2. For Phase Contrast Velocity (PCV) measurements a step protocol of hypocapnic (low CO2), normocapnic (normal CO2) and hypercapnic levels was used (Fig. 1a). For pCASL measurements a single block of hypercapnia interleaved with normocapnia was used (Fig. 1b). Participants were asked to increase their ventilation rate during the hypocapnic condition.
Imaging: Participants were scanned using a 3T Ingenia scanner (Philips Healthcare, Best, Netherlands) using the vendors 32-channel receive coil. PCV measurements were made in a single slice, positioned through the V3 segment of the VAs and the ICAs, across 30 cardiac phases (FOV=150x101mm, 254x171 matrix, one 4mm slice, TR/TE=9ms/5.3ms, VENC=90/120 cm/s – higher for hypercapnia). Measurements were made during each of the three conditions of the step protocol. Single post-labelling delay (PLD) pCASL data were acquired[2] (FOV=240mm2, 64x64 matrix, twelve 5mm slices, 1mm gap, TR/TE=4s/14ms, BW=2056.7Hz/px, PLD=1800ms, label duration=1500ms). Three sets of pCASL preparation parameters were used: Params-1[4], Params-2[2] and Params-3[3] (see Fig. 2). The hypercapnic block protocol was repeated for each parameter set.
Analysis: For the PCV data, ROIs were defined using Segment v3.0[6] software for all four feeding arteries (Fig. 3a), which were propagated across all cardiac phases. The maximum velocity from each ROI and cardiac phase was extracted and repeated for all three CO2 conditions. Analysis of pCASL was performed using a full perfusion signal model using FEAT[7]. Median values of CVR were extracted from grey matter ROIs generated by segmenting a T1-weighted structural[8] and normalised to ΔPetCO2 using in-house scripts (MATLAB, Mathworks, Natick, MA).
Simulations: Bloch simulations were performed using MATLAB for each of the three parameter sets to estimate labelling efficiency as a function of maximum blood velocity assuming laminar flow. The change in labelling efficiency was calculated using the measured normo/hypercapnic velocity values.
RESULTS
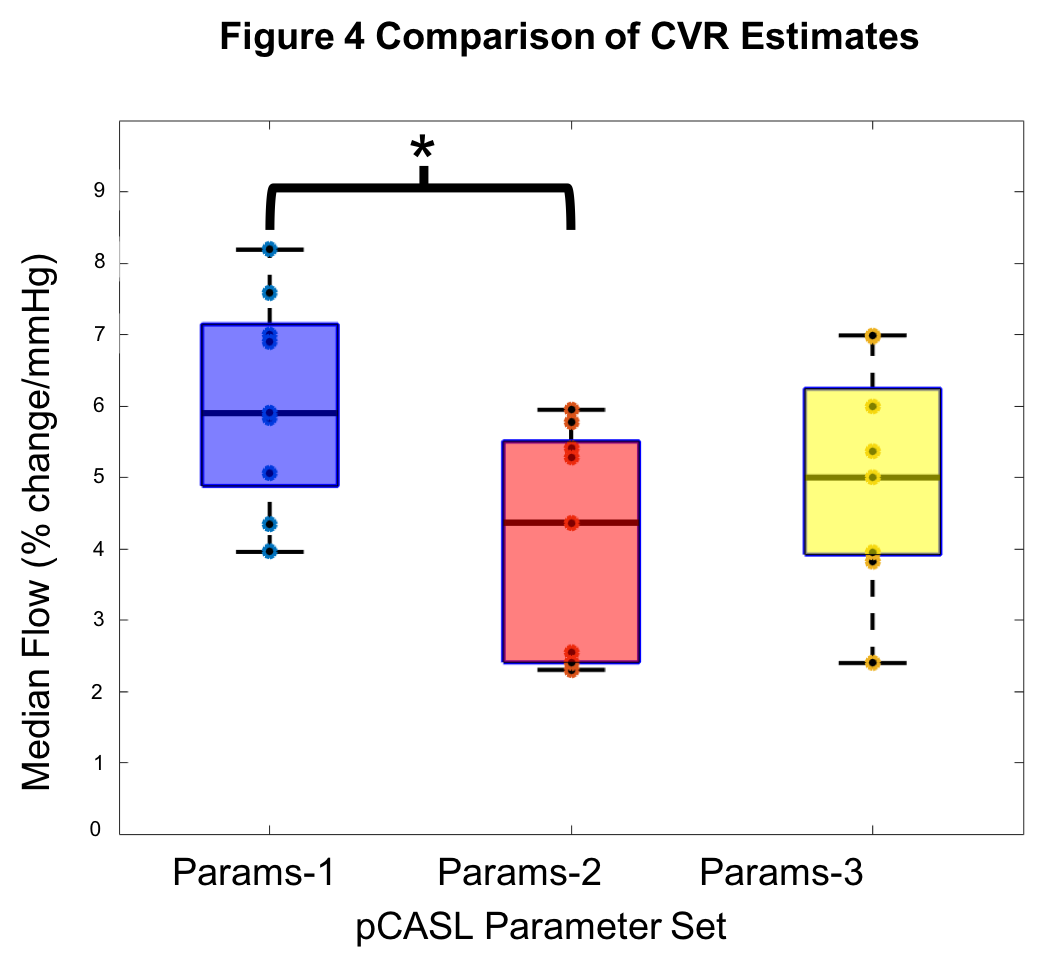
PCV: Figure 3b displays the mean maximum velocity across the cardiac cycle and participants for each of the ROIs and CO2 conditions (group mean±s.d.: ICAnormo=45.7cm/s, ICAhyper=49.9cm/s, VAnormo=22.3cm/s, VAhyper=26.0cm/s.pCASL: Figure 4 plots grey matter CVR for each set of pCASL parameters (group mean±s.d.: Params-1=6.08±1.45%/mmHg, Params-2=4.05±1.61%/mmHg, Params-3=5.05±1.51%/mmHg). One-way ANOVA showed that the group means were not all the same (p<0.05). Post-hoc pairwise comparisons between groups using the Tukey-Kramer test revealed the means of Params-1 and Params-2 were significantly different (p<0.05).
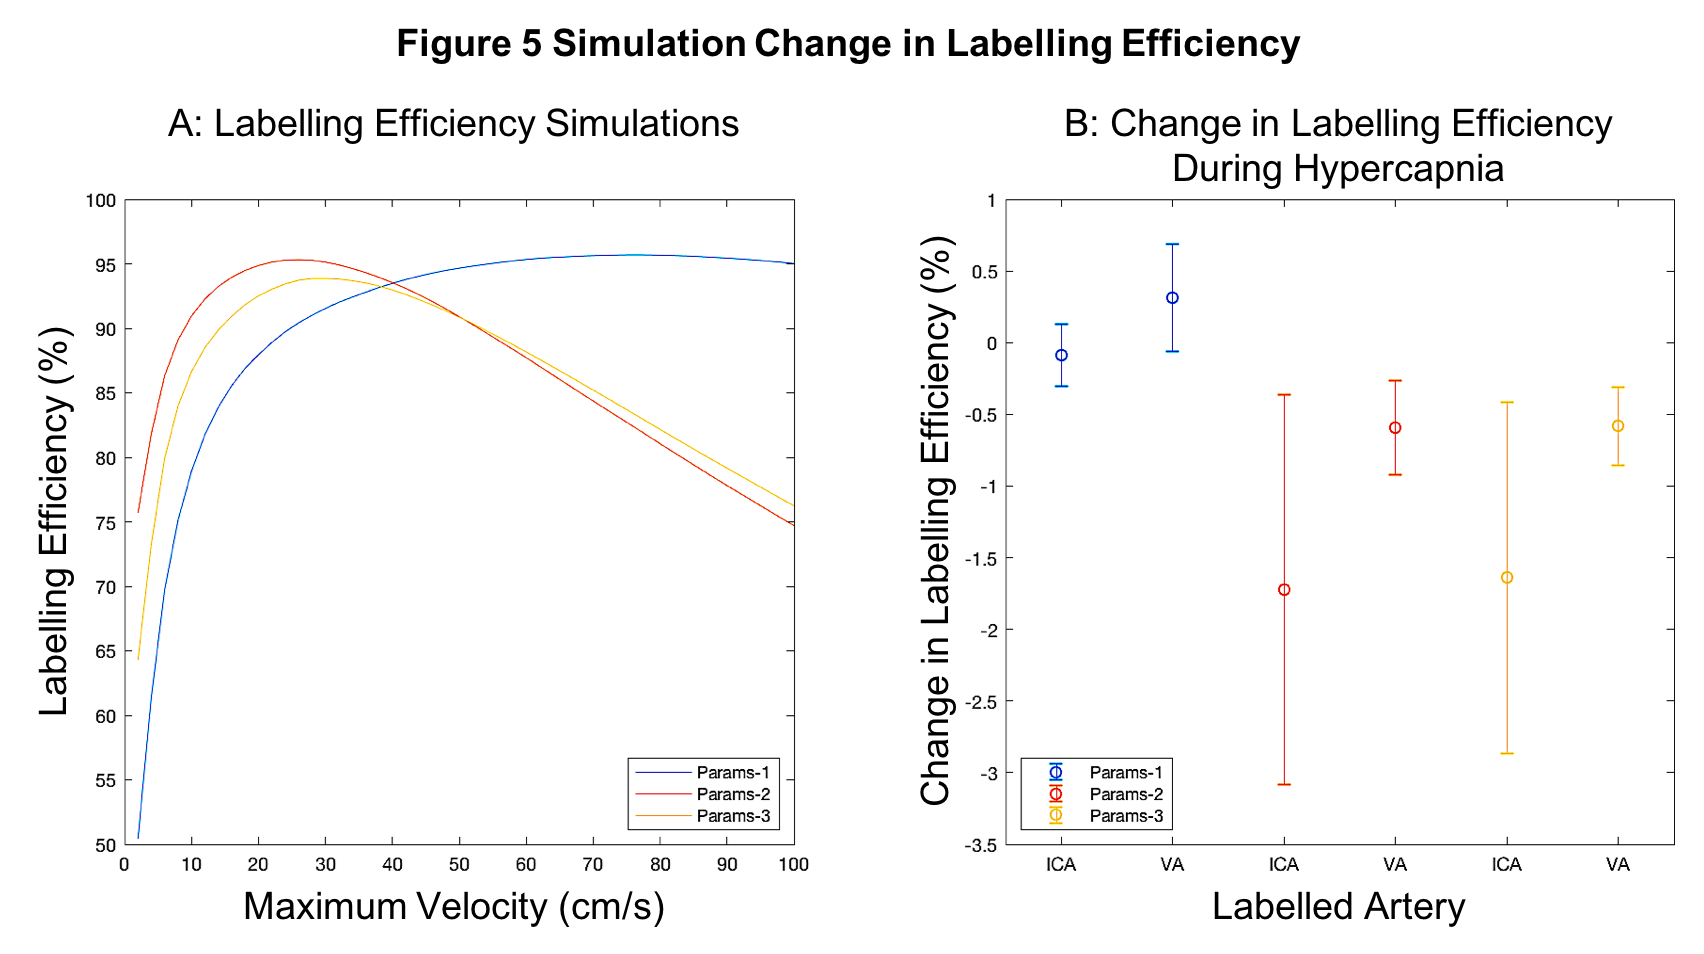
Simulations: Figure 5a presents the labelling efficiency as a function of velocity. Params-1 increased monotonically with velocity. Params-2/Params-3 decreased above ~20cm/s. Figure 5b shows the change in labelling efficiency due to hypercapnia based on the PCV measurements. Params-1 showed the smallest decrease in labelling efficiency and Params-2/Params-3 showed a bigger decrease and greater variance.
DISCUSSION
Experiments were performed to determine if CVR varies systematically with different pCASL parameter variants due to changes in feeding artery blood velocity. Such changes in blood velocity are often assumed to be negligible during hypercapnia, but were found to increase by 10-12%. Measurements of CVR were found to vary systematically with different pCASL preparation parameters, with a significant difference between two implementations. These large differences in CVR would have a fundamental impact on physiological/clinical interpretation. Simulations of the change in labelling efficiency caused by the increase in blood velocity followed a similar pattern to the experimentally measured CVR, but were smaller in magnitude. Further work is required to better understand the origin of these systematic differences in CVR.Acknowledgements
The authors would like to acknowledge the funding for this study from the Biotechnology and Biosciences Research Council (BBSRC) and the National Institute for Health Research (NIHR). Authors would also like to thank the volunteers who participated in this study.
References
1. Stroke Association. 2020. Stroke Association. [online] Available at: <https://www.stroke.org.uk/> [Accessed 2 June 2020].
2. Aslop, D.C., Detre, J. A., Golay, X., Günther, M, Hendrikse, J., Hernandez-Garcia, L., Lu, H., MacIntosh, B. J., Parkes, L. M., Smits, M., van Osch, M. J. P., Wang, D. J. J., Wong, E. C., Zaharchuk, G. (2015) ‘Recommended implementation of arterial spin-labeled perfusion MRI for clinical applications: A consensus of the ISMRM perfusion study group and the European consortium for ASL in dementia’, Magnetic Resonance in Medicine. 73(1), 102-106.
3. Aslan, S., Xu, F., Wang, P. L., Uh, J., Yezhuvath, U. S., van Osch, M., Lu, H. (2010) ‘Estimation of labeling efficiency in pseudocontinuous arterial spin labeling’, Magnetic Resonance in Medicine. 63(3), 765–771.
4. Vaclavu L., Sokolska M., Nederveen A.J., Thomas D.L. (2008) 'Accounting for pCASL labelling efficiency variation in patients with low and high arterial blood flow velocities', Proc. Intl. Soc. Mag. Reson. Med. 26, #5530.
5. Slessarev M., Han J., Mardimae A., Prisman E., Preiss D., Volgyesi G., Ansel C., Duffin J., Fisher J.A. 'Prospective targeting and control of end-tidal CO2 and O2 concentrations', The Journal of Physiology 2007; 581:1207–1219. doi: 10.1113/jphysiol.2007.129395.
6. E. Heiberg, J. Sjögren, M. Ugander, M. Carlsson, H. Engblom, and H. Arheden, 'Design and Validation of Segment – a Freely Available Software for Cardiovascular Image Analysis', BMC Medical Imaging, 10:1, 2010.
7. Woolrich, M. W., Ripley, B. D., Brady, M., & Smith, S. M. (2001). 'Temporal Autocorrelation in Univariate Linear Modeling of FMRI Data', NeuroImage, 14(6), 1370–1386.
8. Zhang, Y., Brady, M. & Smith, S. (2001) 'Segmentation of brain MR images through a hidden Markov random field model and the expectation-maximization algorithm', IEEE Trans Med Imag, 20(1):45-57.
Figures
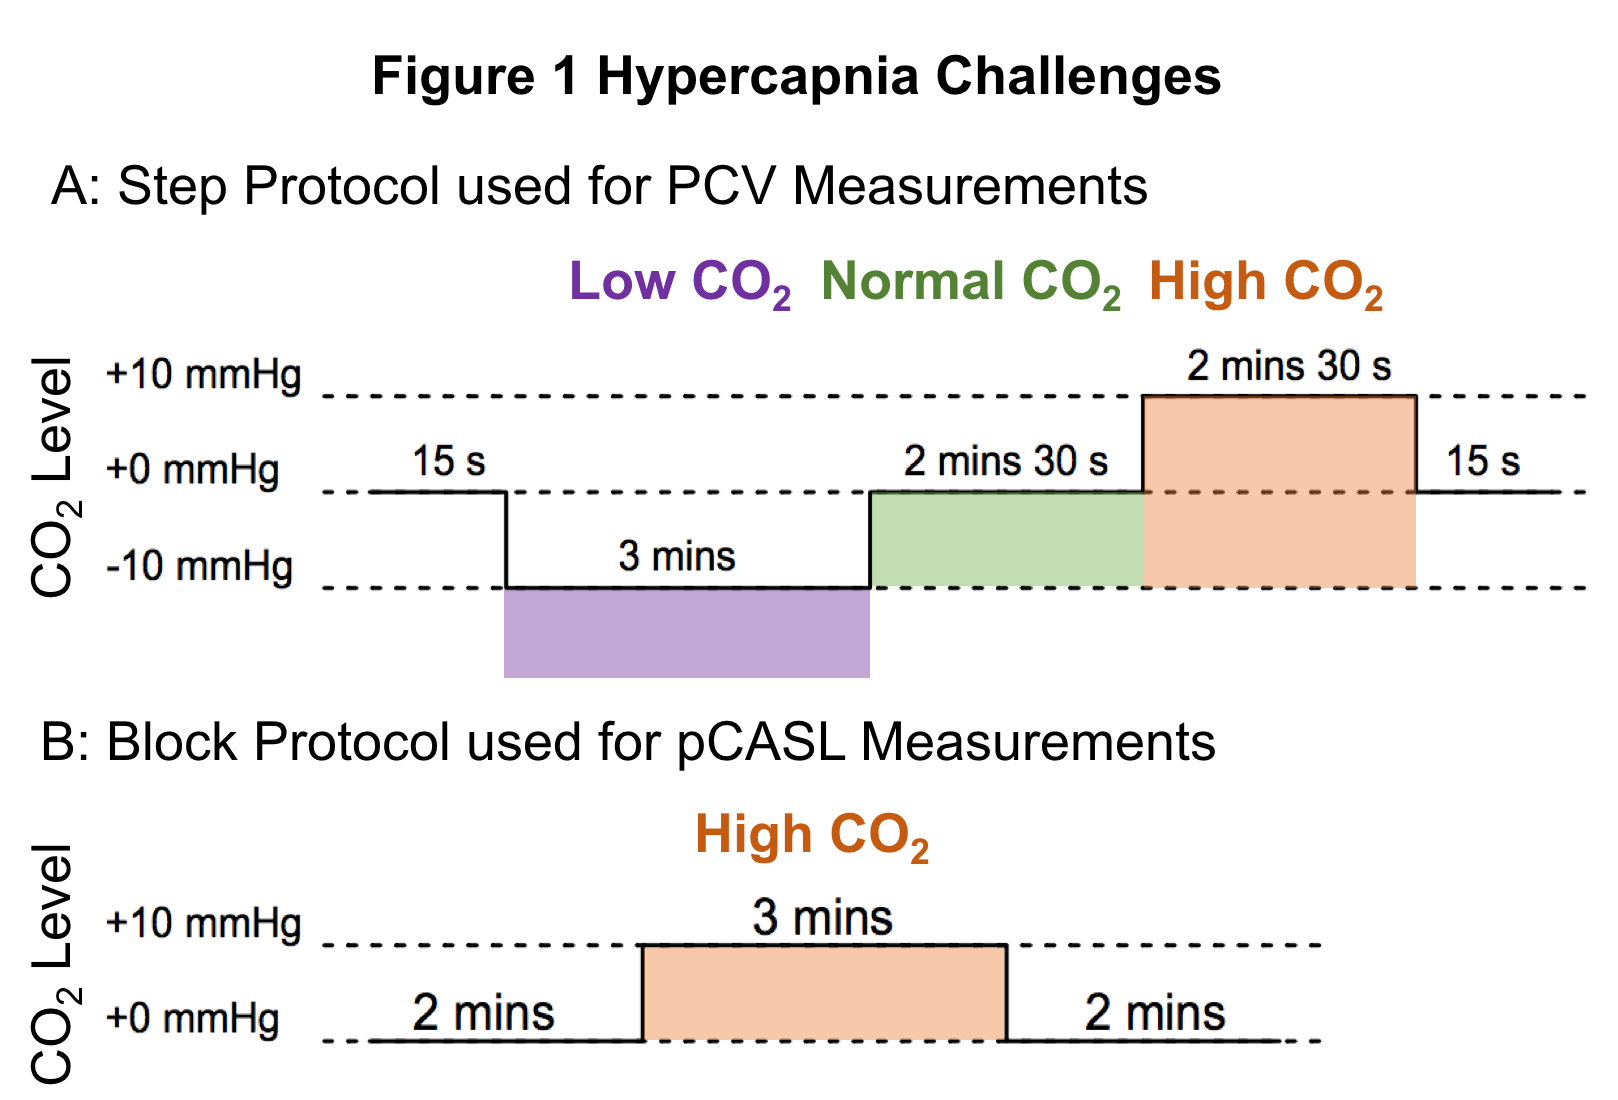
Figure 1 Hypercapnia Challenges. A: Step protocol used for Phase Contrast Velocity (PCV) measurements made in the main feeding arteries of the brain by altering the participants CO2 levels (low, normal and high). Hypercapnic (high CO2) condition was performed by targeting end-tidal partial pressure of CO2 (PetCO2) at 10mmHg above the subject’s resting PetCO2. B: Block protocol used for pCASL (pseudocontinuous Arterial Spin Labelling) measurements with three different sets of pCASL preparation parameters.
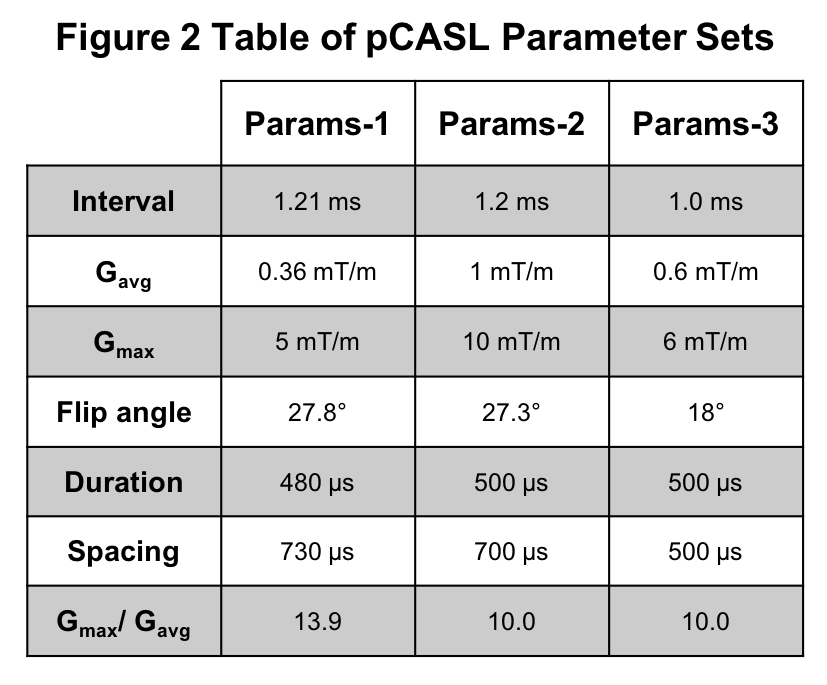
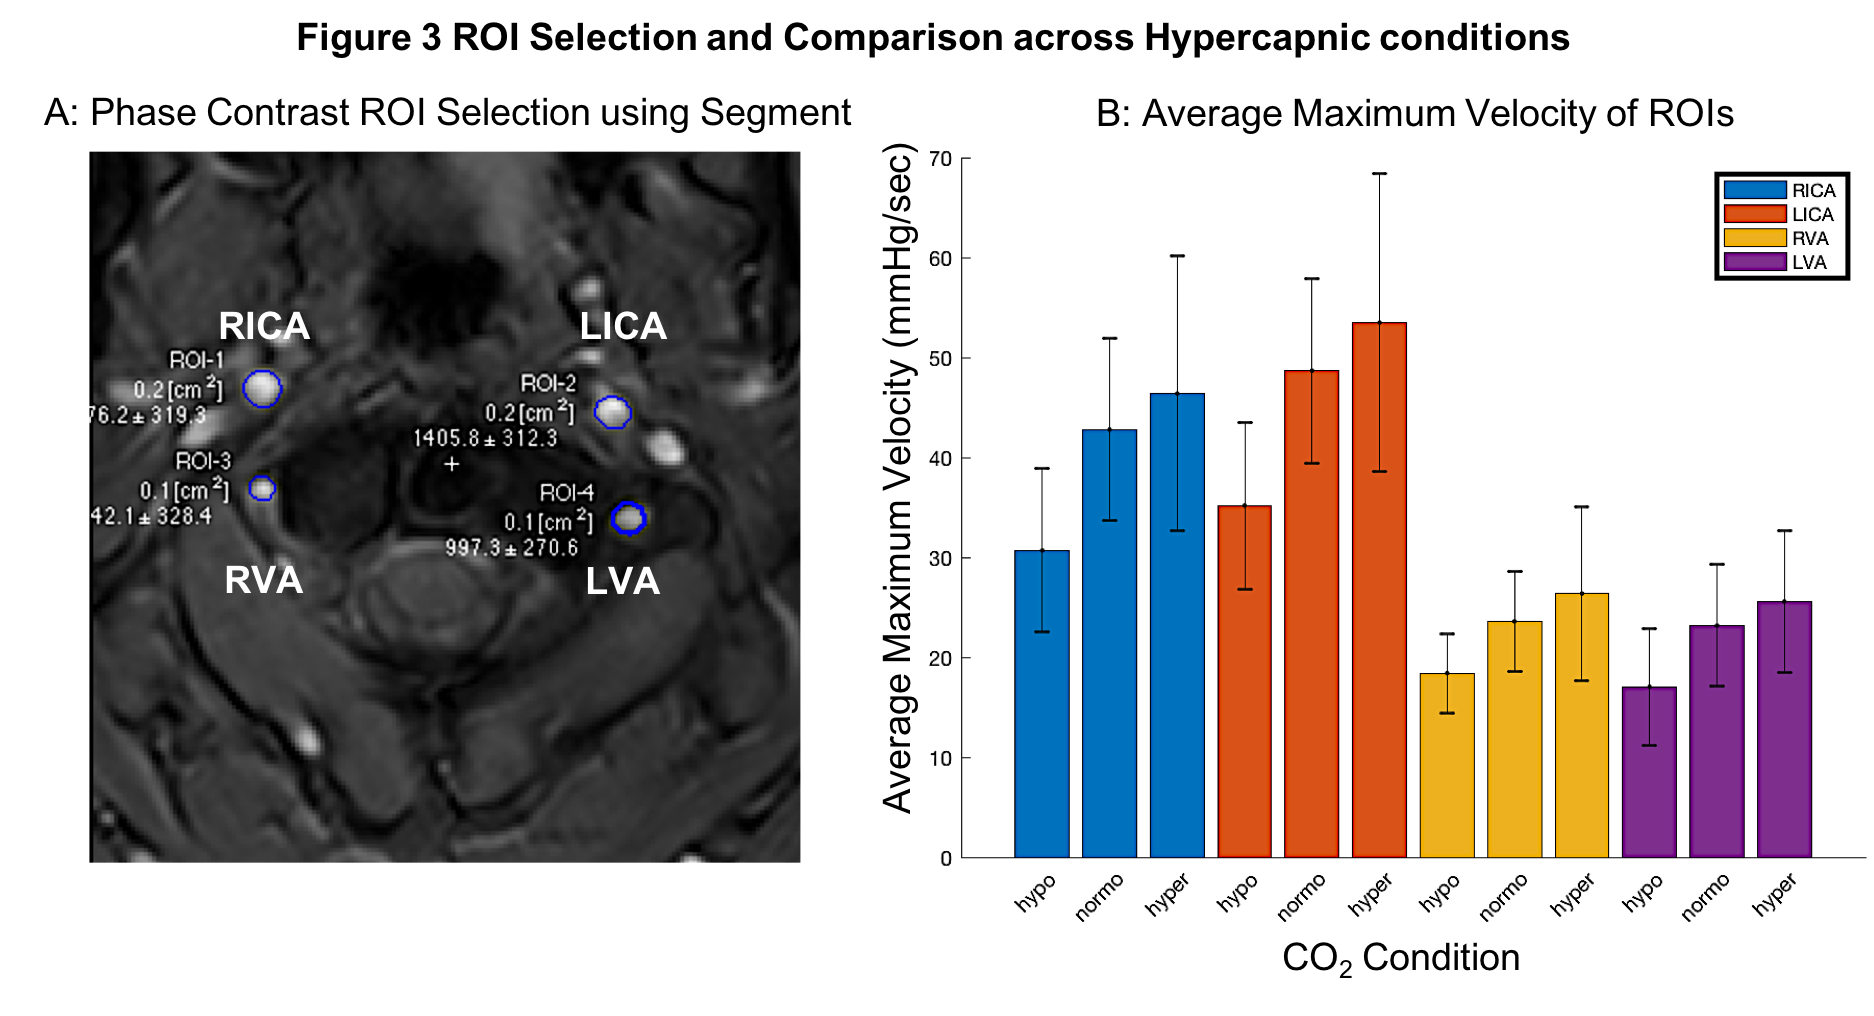
Figure 3 ROI Selection and Blood Velocity Results. A: Phase contrast velocity region of interest (ROI) selection of left/right (L/R) internal carotid arteries (ICA) and vertebral arteries (VA). B: Average maximum velocity of feeding arteries (N=9, F=4, mean±s.d.) at three carbon dioxide (CO2) levels: hypocapnia (hypo, -10mmHg below baseline), normocapia (normo) and hypercapnia (hypo, +10mmHg above baseline).