2742
Reliability of Arterial Spin Labeling derived Cerebral Blood Flow measurements in Periventricular White Matter1Department of Radiology, University of Pennsylvania, Philadelphia, PA, United States, 2Departments of Biomedical Engineering and Neurology, University of California, Davis, CA, United States, 3Department of Radiology, Stanford University, Palo Alto, CA, United States, 4Department of Neurology, University of Pennsylvania, Philadelphia, PA, United States
Synopsis
Periventricular white matter (PVWM) is exclusively perfused by small vessels, and hence PVWM Cerebral Blood Flow (CBF) can provide a biomarker of cerebral small vessel functional integrity. Although PVWM is weakly perfused, we demonstrate that PVWM-CBF derived from state-of-the-art Arterial Spin Labeling (ASL) acquired twice ~15minutes apart in a cohort of 16 subjects showed high reproducibility that was comparable to other larger regions of interest. Further there was high correlation between PVWM-CBF derived from ASL and concurrently acquired [15O]-water Positron Emission Tomography data. These findings suggest that PVWM CBF can be reliably measured with advanced ASL methods.
Introduction
Cerebral small vessel disease (CSVD) is among the most prevalent central nervous system disorders and has a key mechanistic role in both aging and dementia.1–3 Cerebral Blood Flow (CBF) provides a direct measure of microvascular functional integrity.4 The periventricular white matter (PVWM) region is exclusively perfused by small vessels,5 and hence PVWM CBF may provide a biomarker of cerebral small vessel integrity.6 Arterial Spin Labeling provides non-invasive quantification of regional CBF, but since PVWM is weakly perfused,6,7 it remains to be demonstrated whether current state-of-the-art ASL can provide a reliable measure of PVWM-CBF. We aimed to assess the reliability of PVWM CBF by computing its intra-session reproducibility, correlation with [15O]-water Positron Emission Tomography (PET) measurements and comparing the results with whole brain (WB), gray matter (GM) and white matter (WM).Method
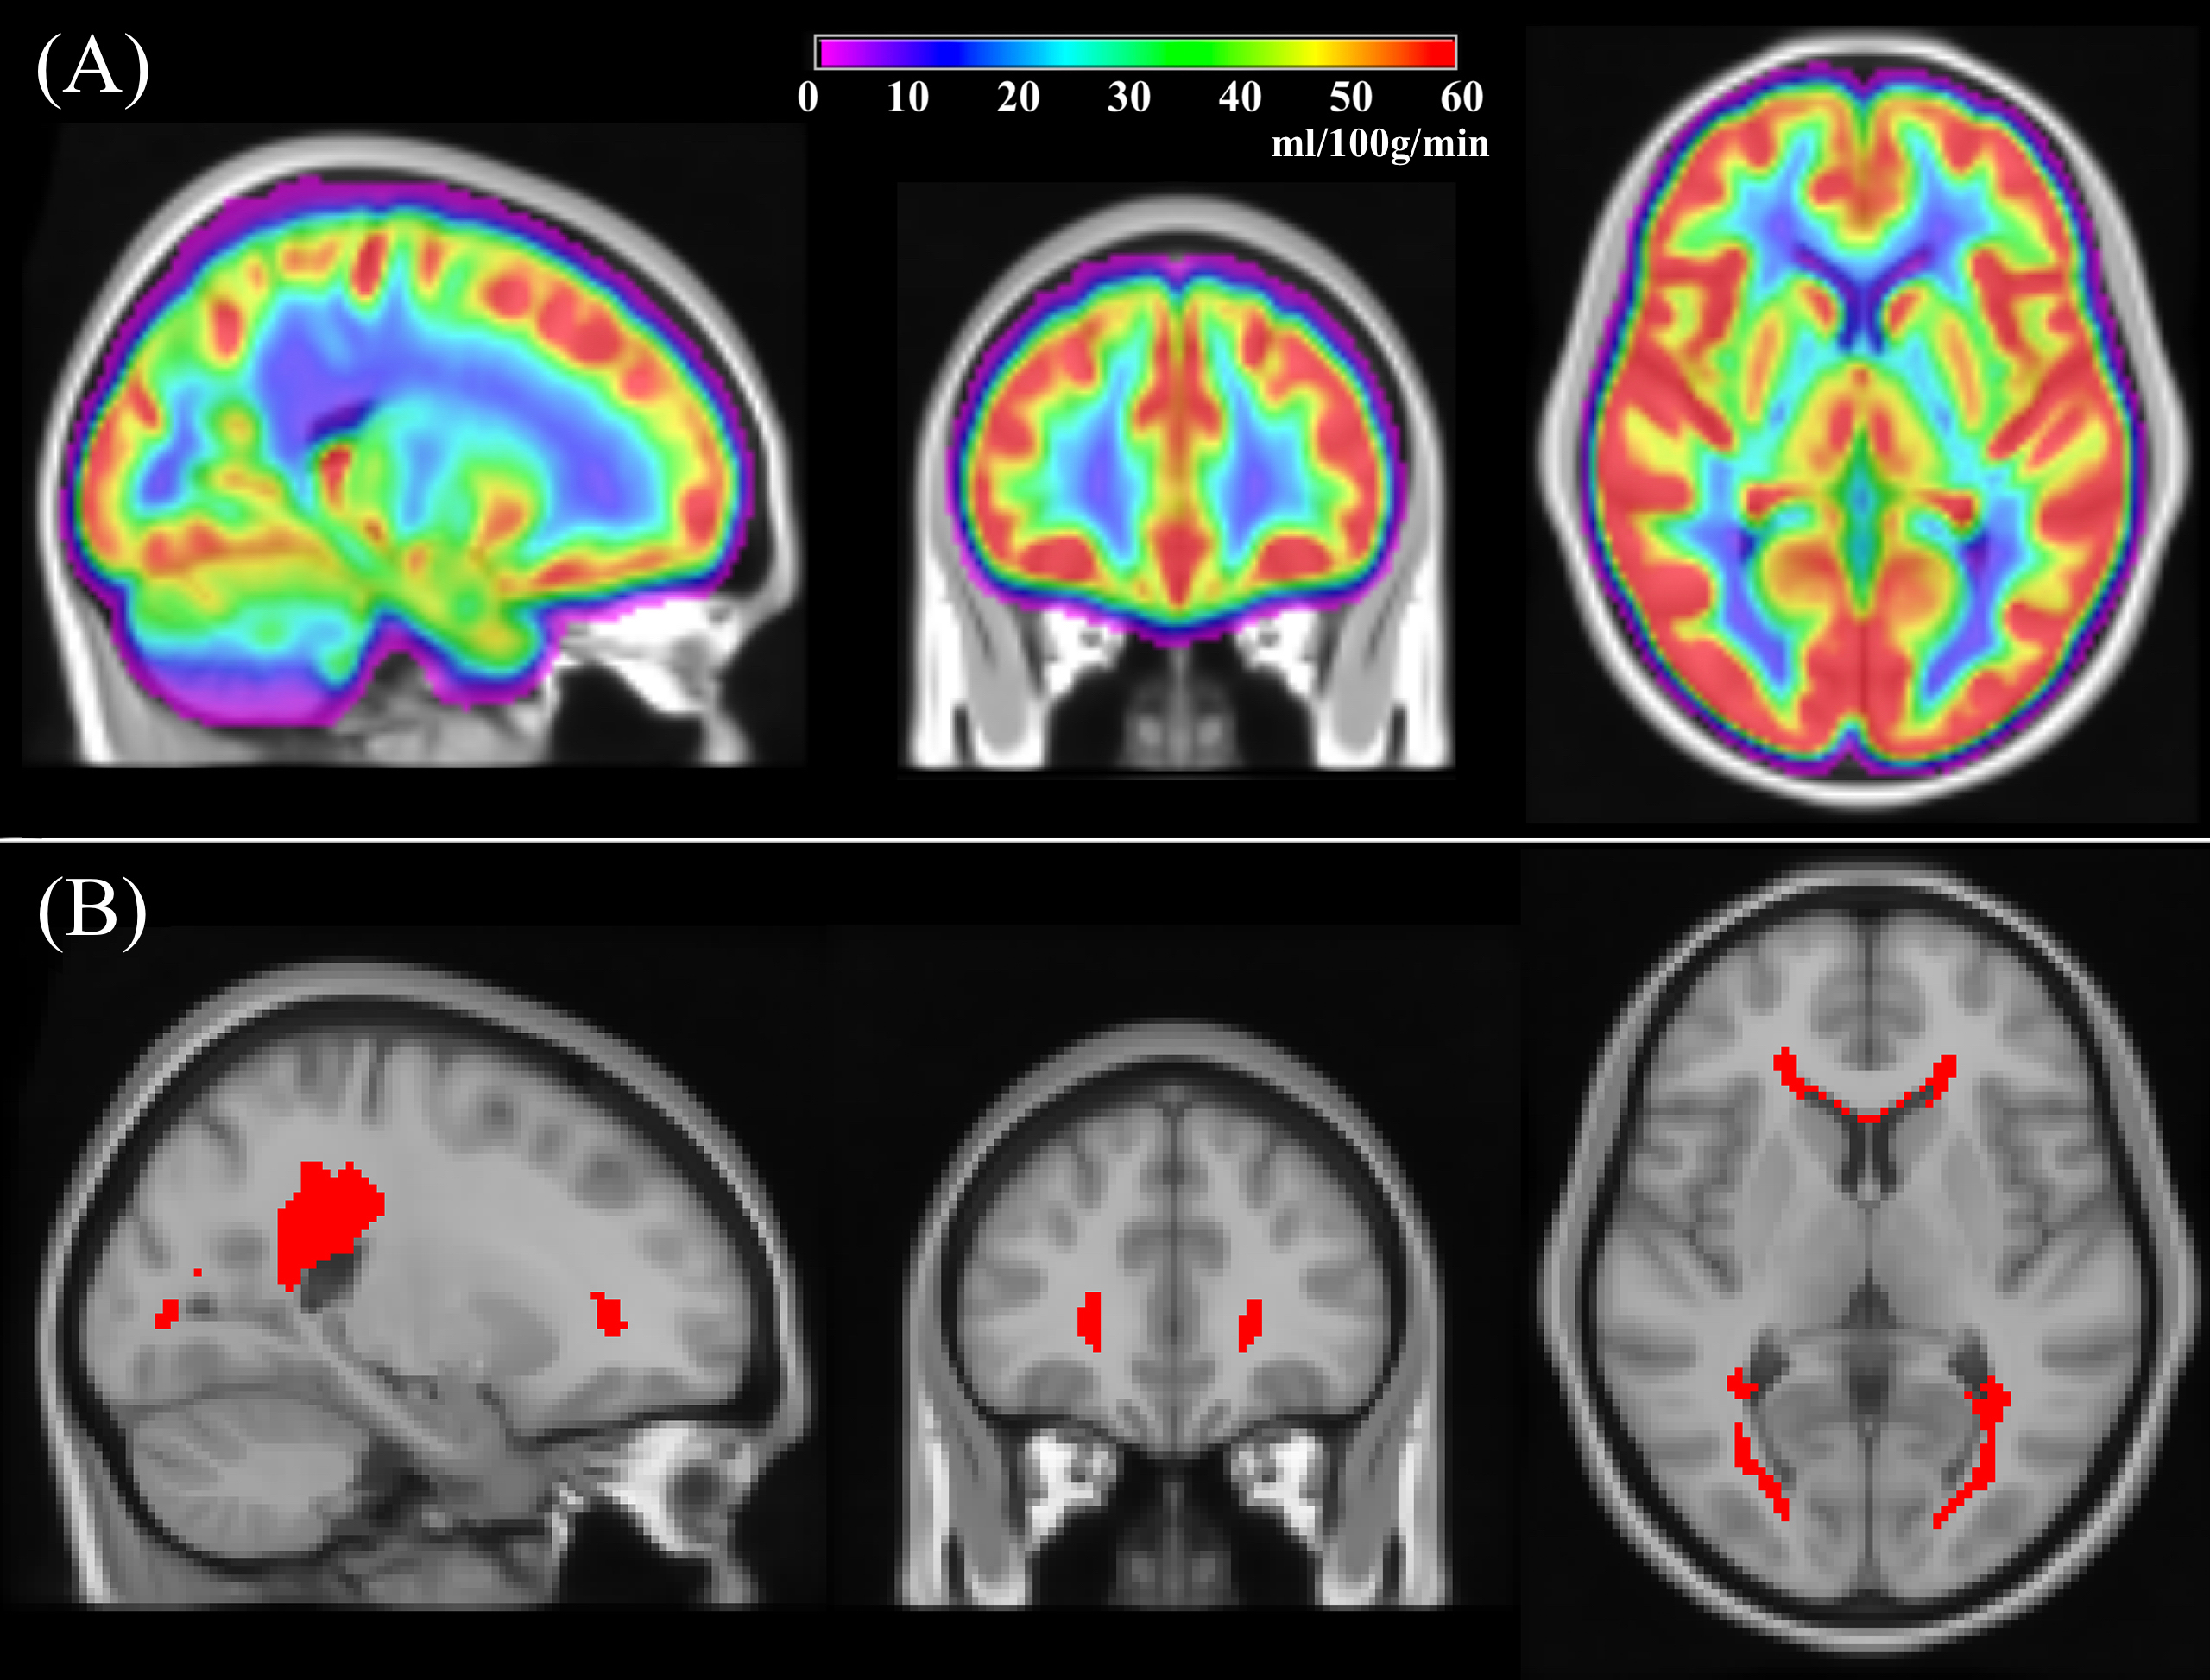
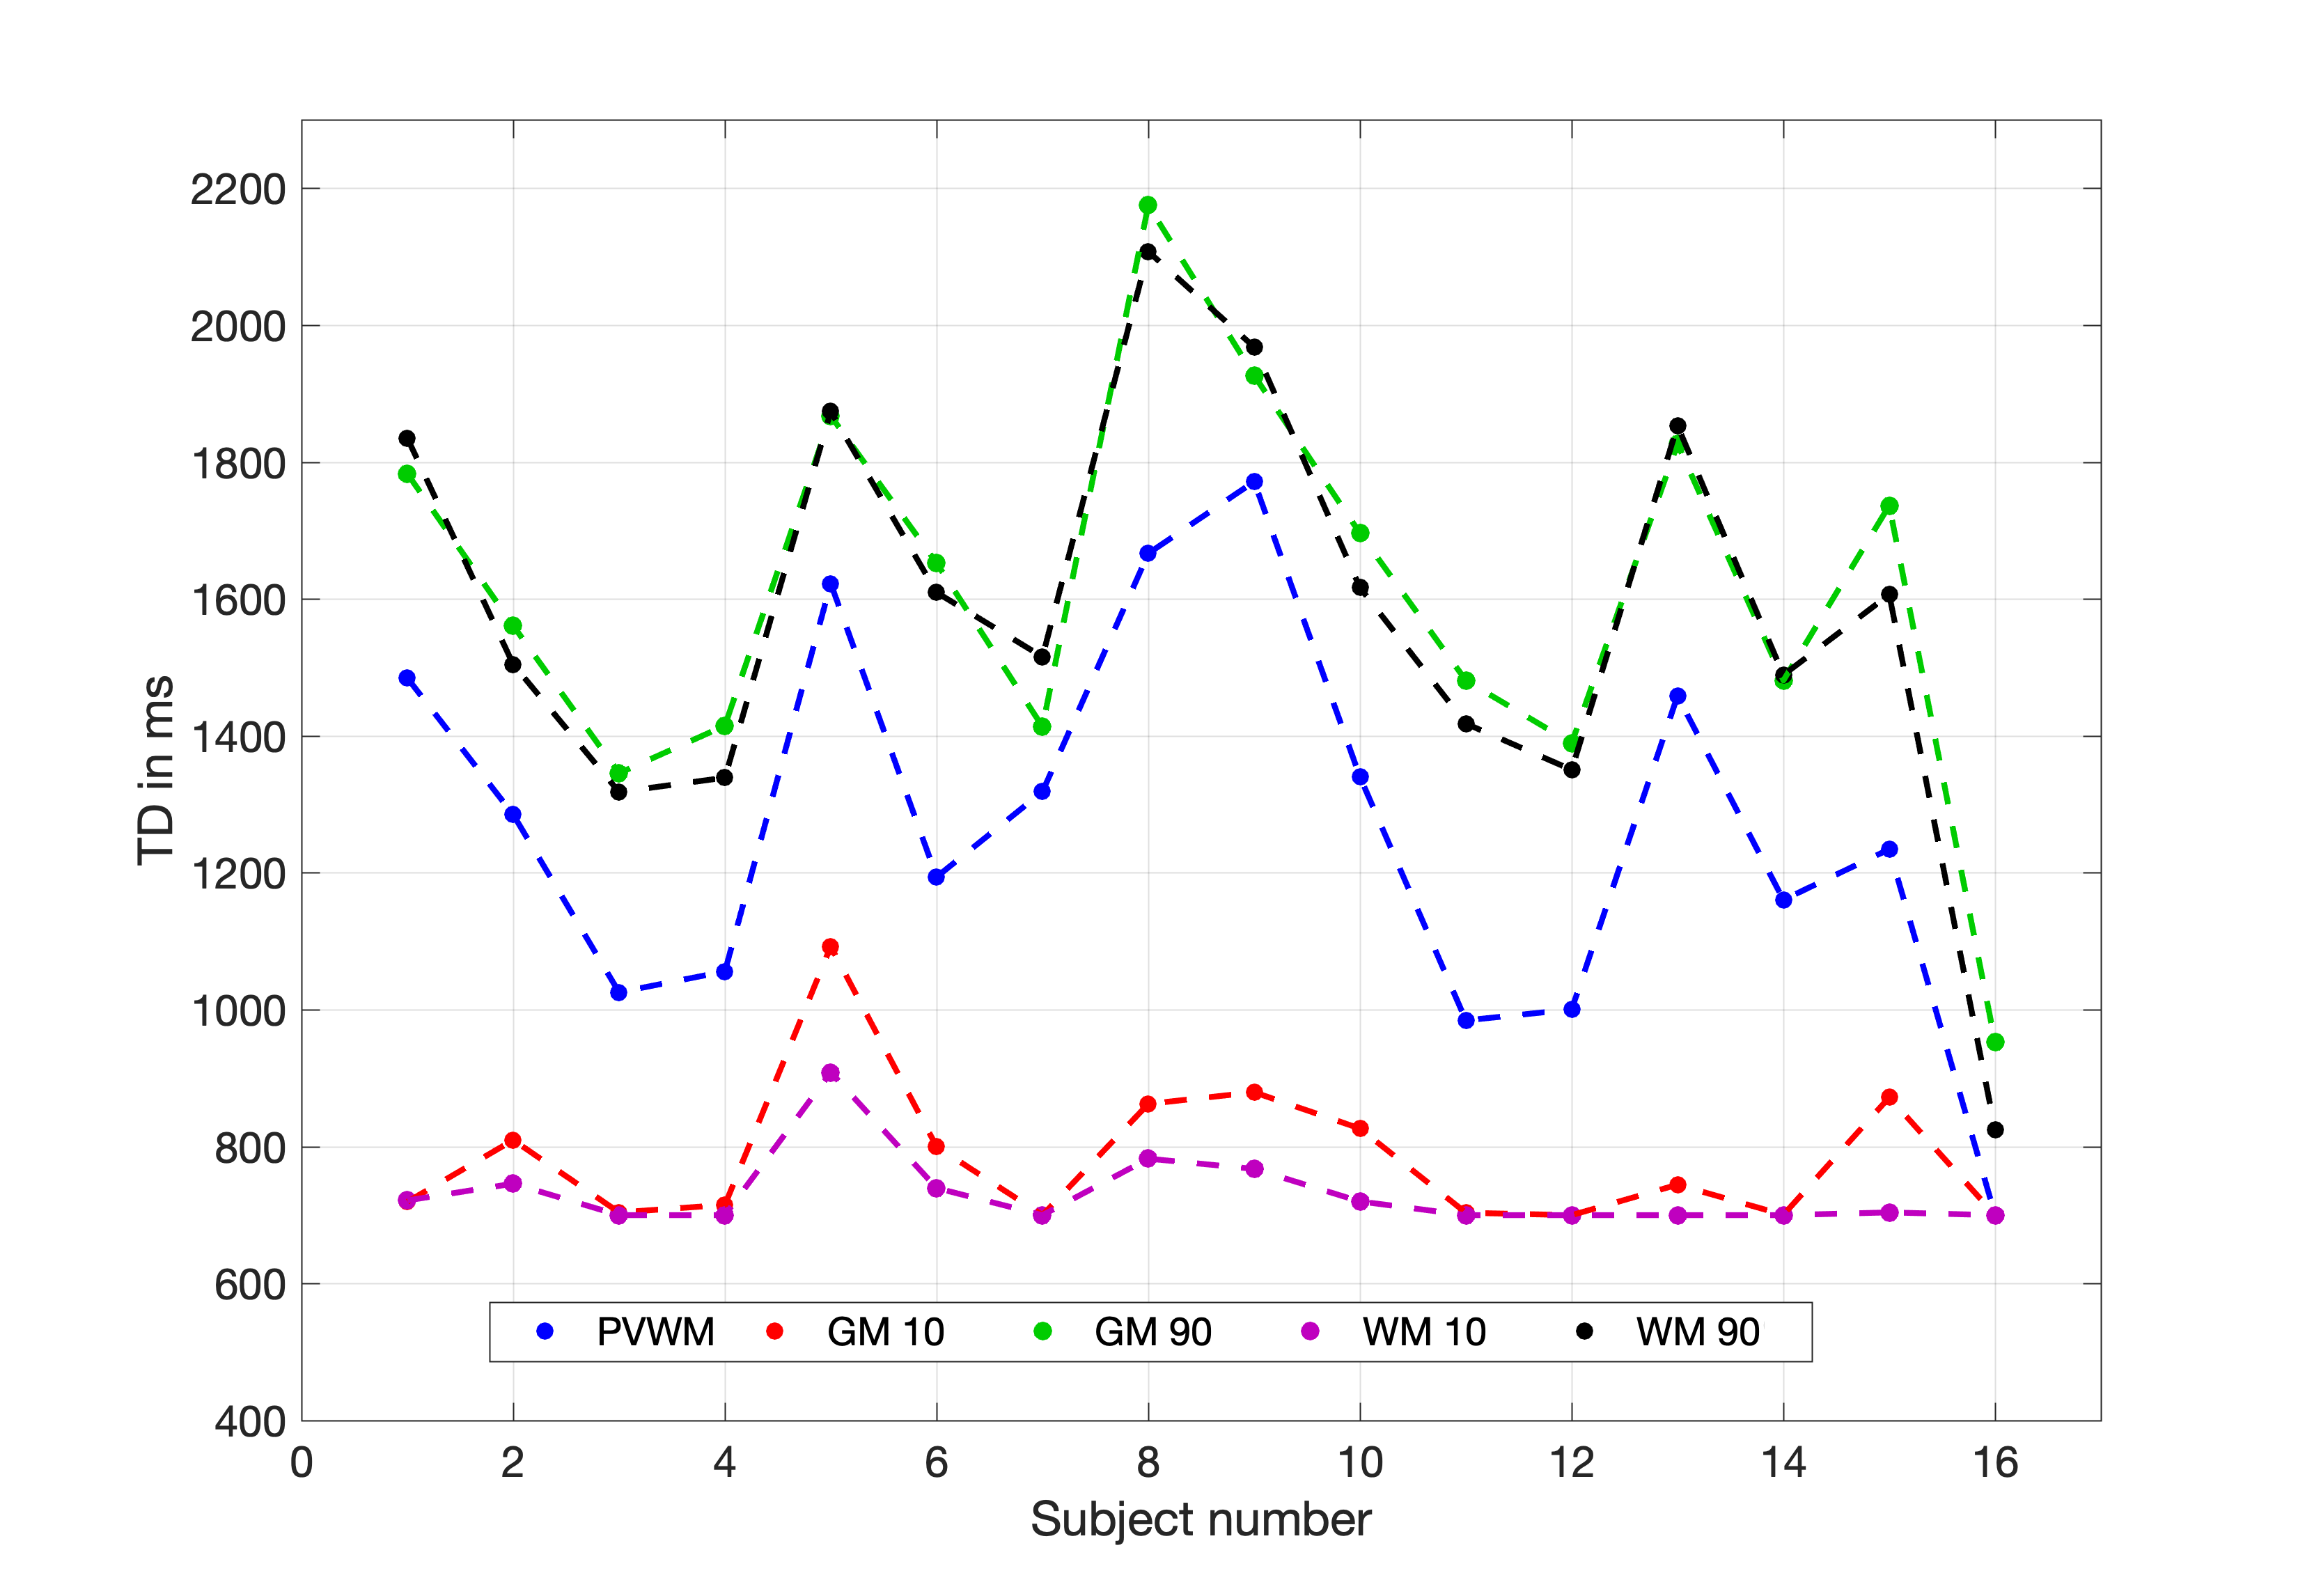
ASL and [15O]-water PET data from 16 middle aged healthy subjects (age: 41.4±12.0, range=22–62 years, 9 female) were acquired twice within the same session about 15 minutes apart on a 3T PET/MRI GE scanner at Stanford University. ASL MRI data with pseudo-continuous labeling and a 3-dimensional fast spin echo readout with stack-of-spirals readout trajectory were acquired using both single postlabeling delay (PLD) (labeling/PLD=1.5/2.025s, voxel=3.7x3.7x4mm3) and multi-PLD (labeling=2s, 5 PLDs uniformly spaced between 0.7 and 3s, voxel= 5.8x5.8x4mm3). PET data was acquired using an intravenous bolus injection of [15O]-water (490–960 MBq), and the first 2 minutes of PET counts after tracer administration were reconstructed to create a map of relative CBF. PET reconstruction was performed using TOF-OSEM algorithm on a 192×192 matrix, 30 cm field-of view, 2.78 mm slice thickness, and included correction for scatter, random counts, dead time, and point-spread function. The data was processed to obtain CBF maps using standard processing pipelines.8,9 ASL-CBF values were extracted from WB, GM, WM, and PVWM regions of interest (ROIs). The PVWM ROI was constructed by thresholding a group averaged CBF map (Figure 1A) from a separate cohort of middle-aged healthy subjects to 12.5ml/100g/min (Figure 1B). The other ROIs were obtained by segmenting and binarizing high resolution T1 images of each subject using SPM12. Intrasession reliability was computed using within-subject coefficient of variation (wsCV). Their 95% confidence intervals and statistical comparisons with other ROIs were obtained using bootstrapping methods. Comparison with PET CBF was obtained using Pearson’s correlation coefficient. The PET data did not include arterial blood sampling needed for calculating absolute CBF,9 hence intermodal correlation analysis focused on relative CBF with normalization by WB CBF. Finally, we measured the transit delay or the arterial transit time of the PVWM region in individual subjects from the multi-PLD ASL data. For comparison we used the 10th and 90th percentile values in both GM and WM.Results
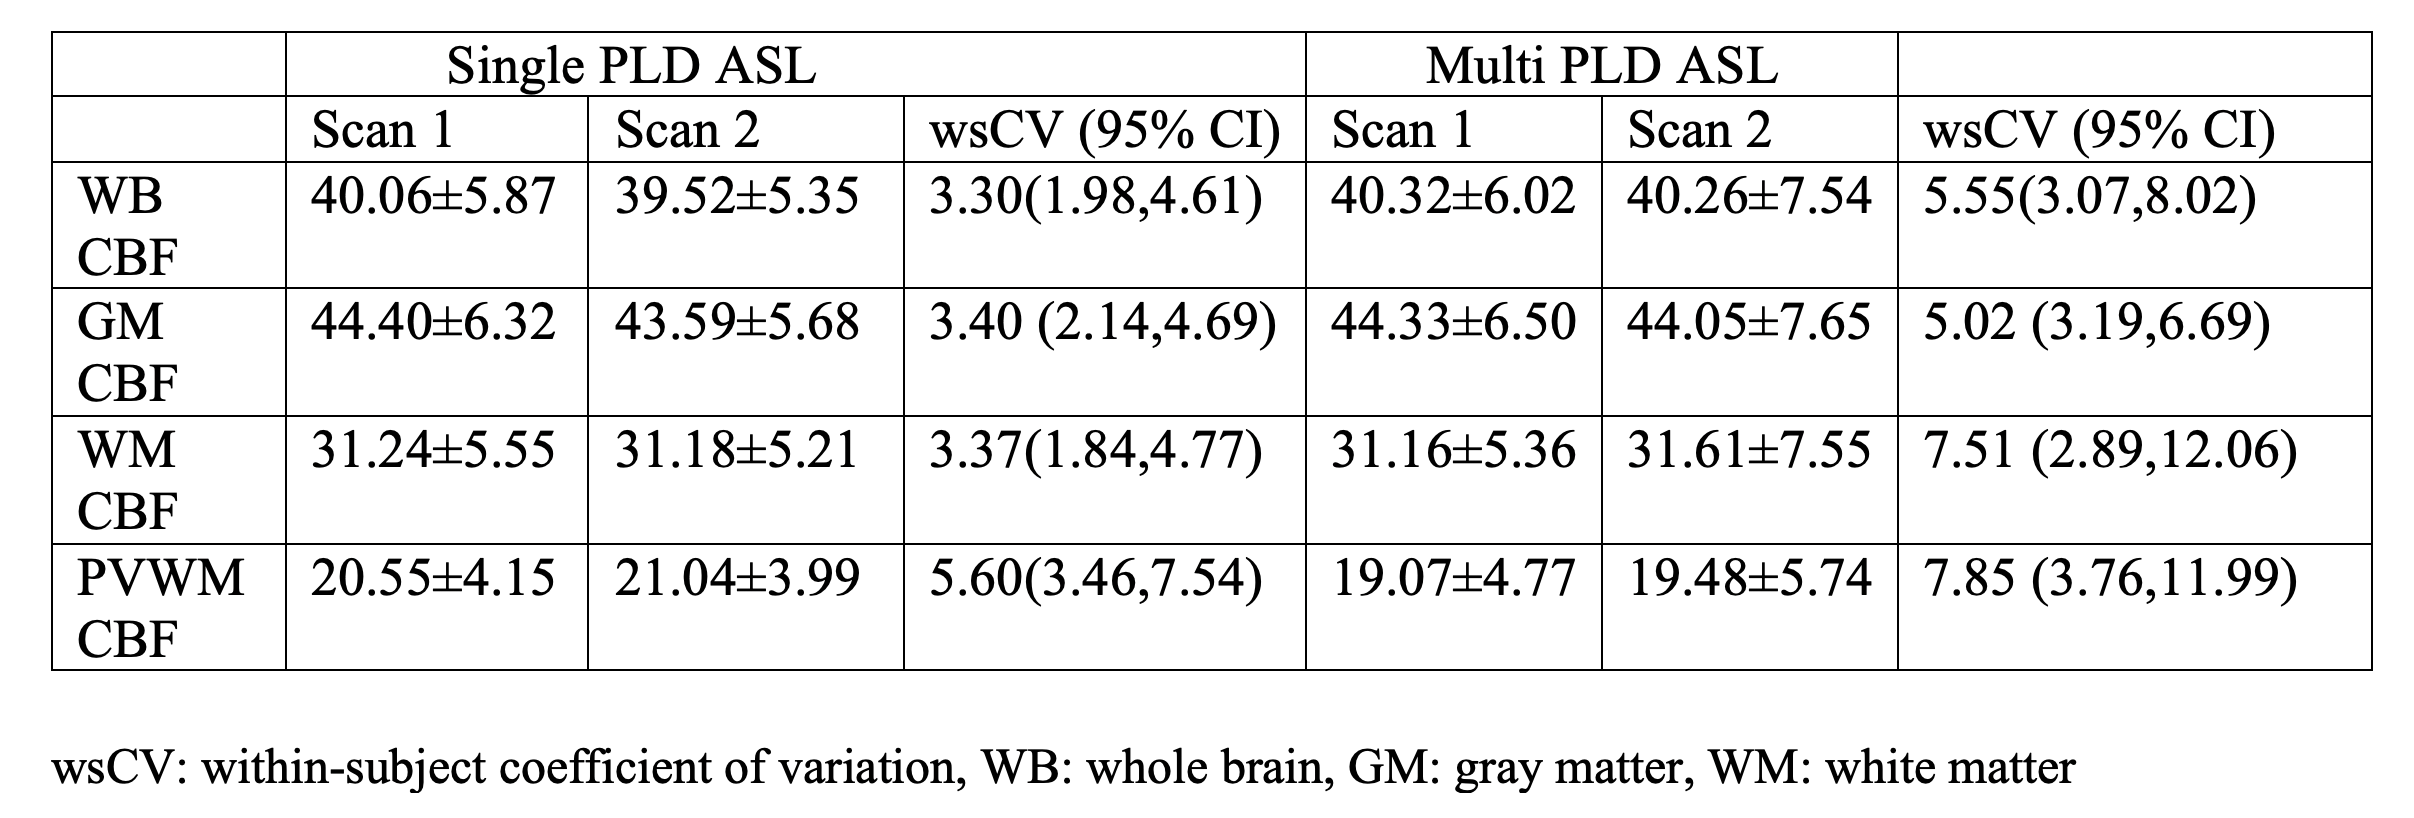
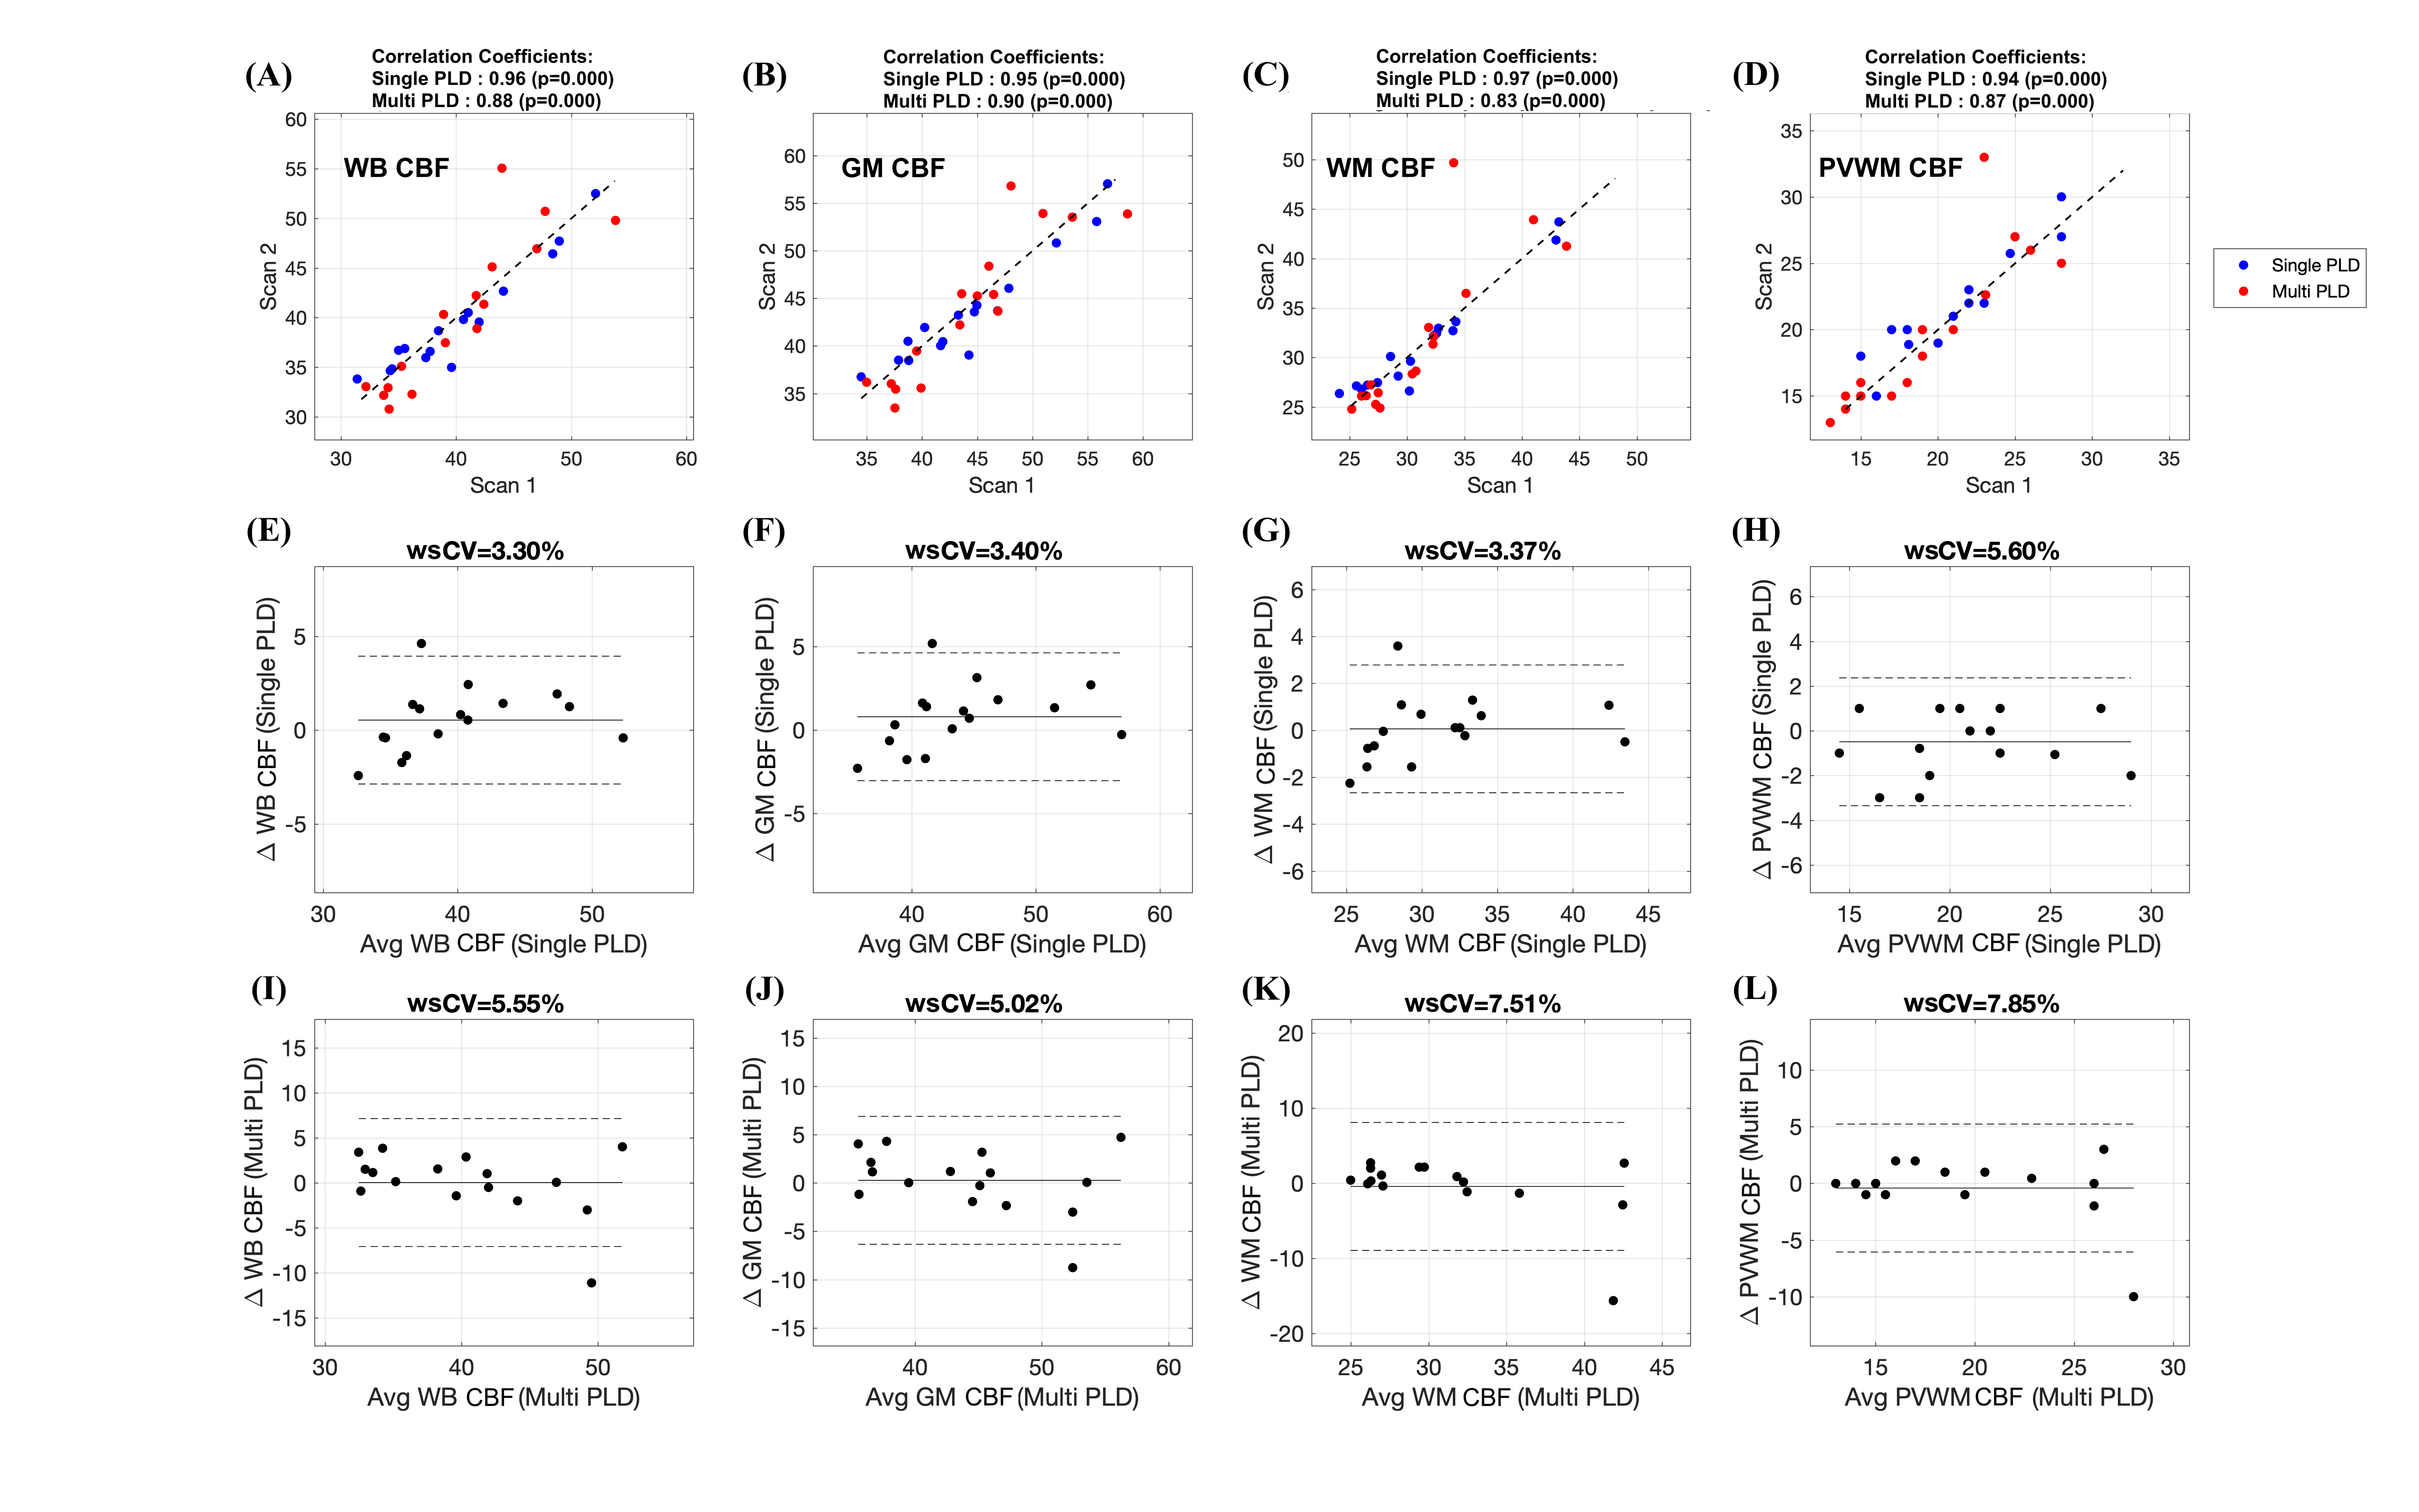
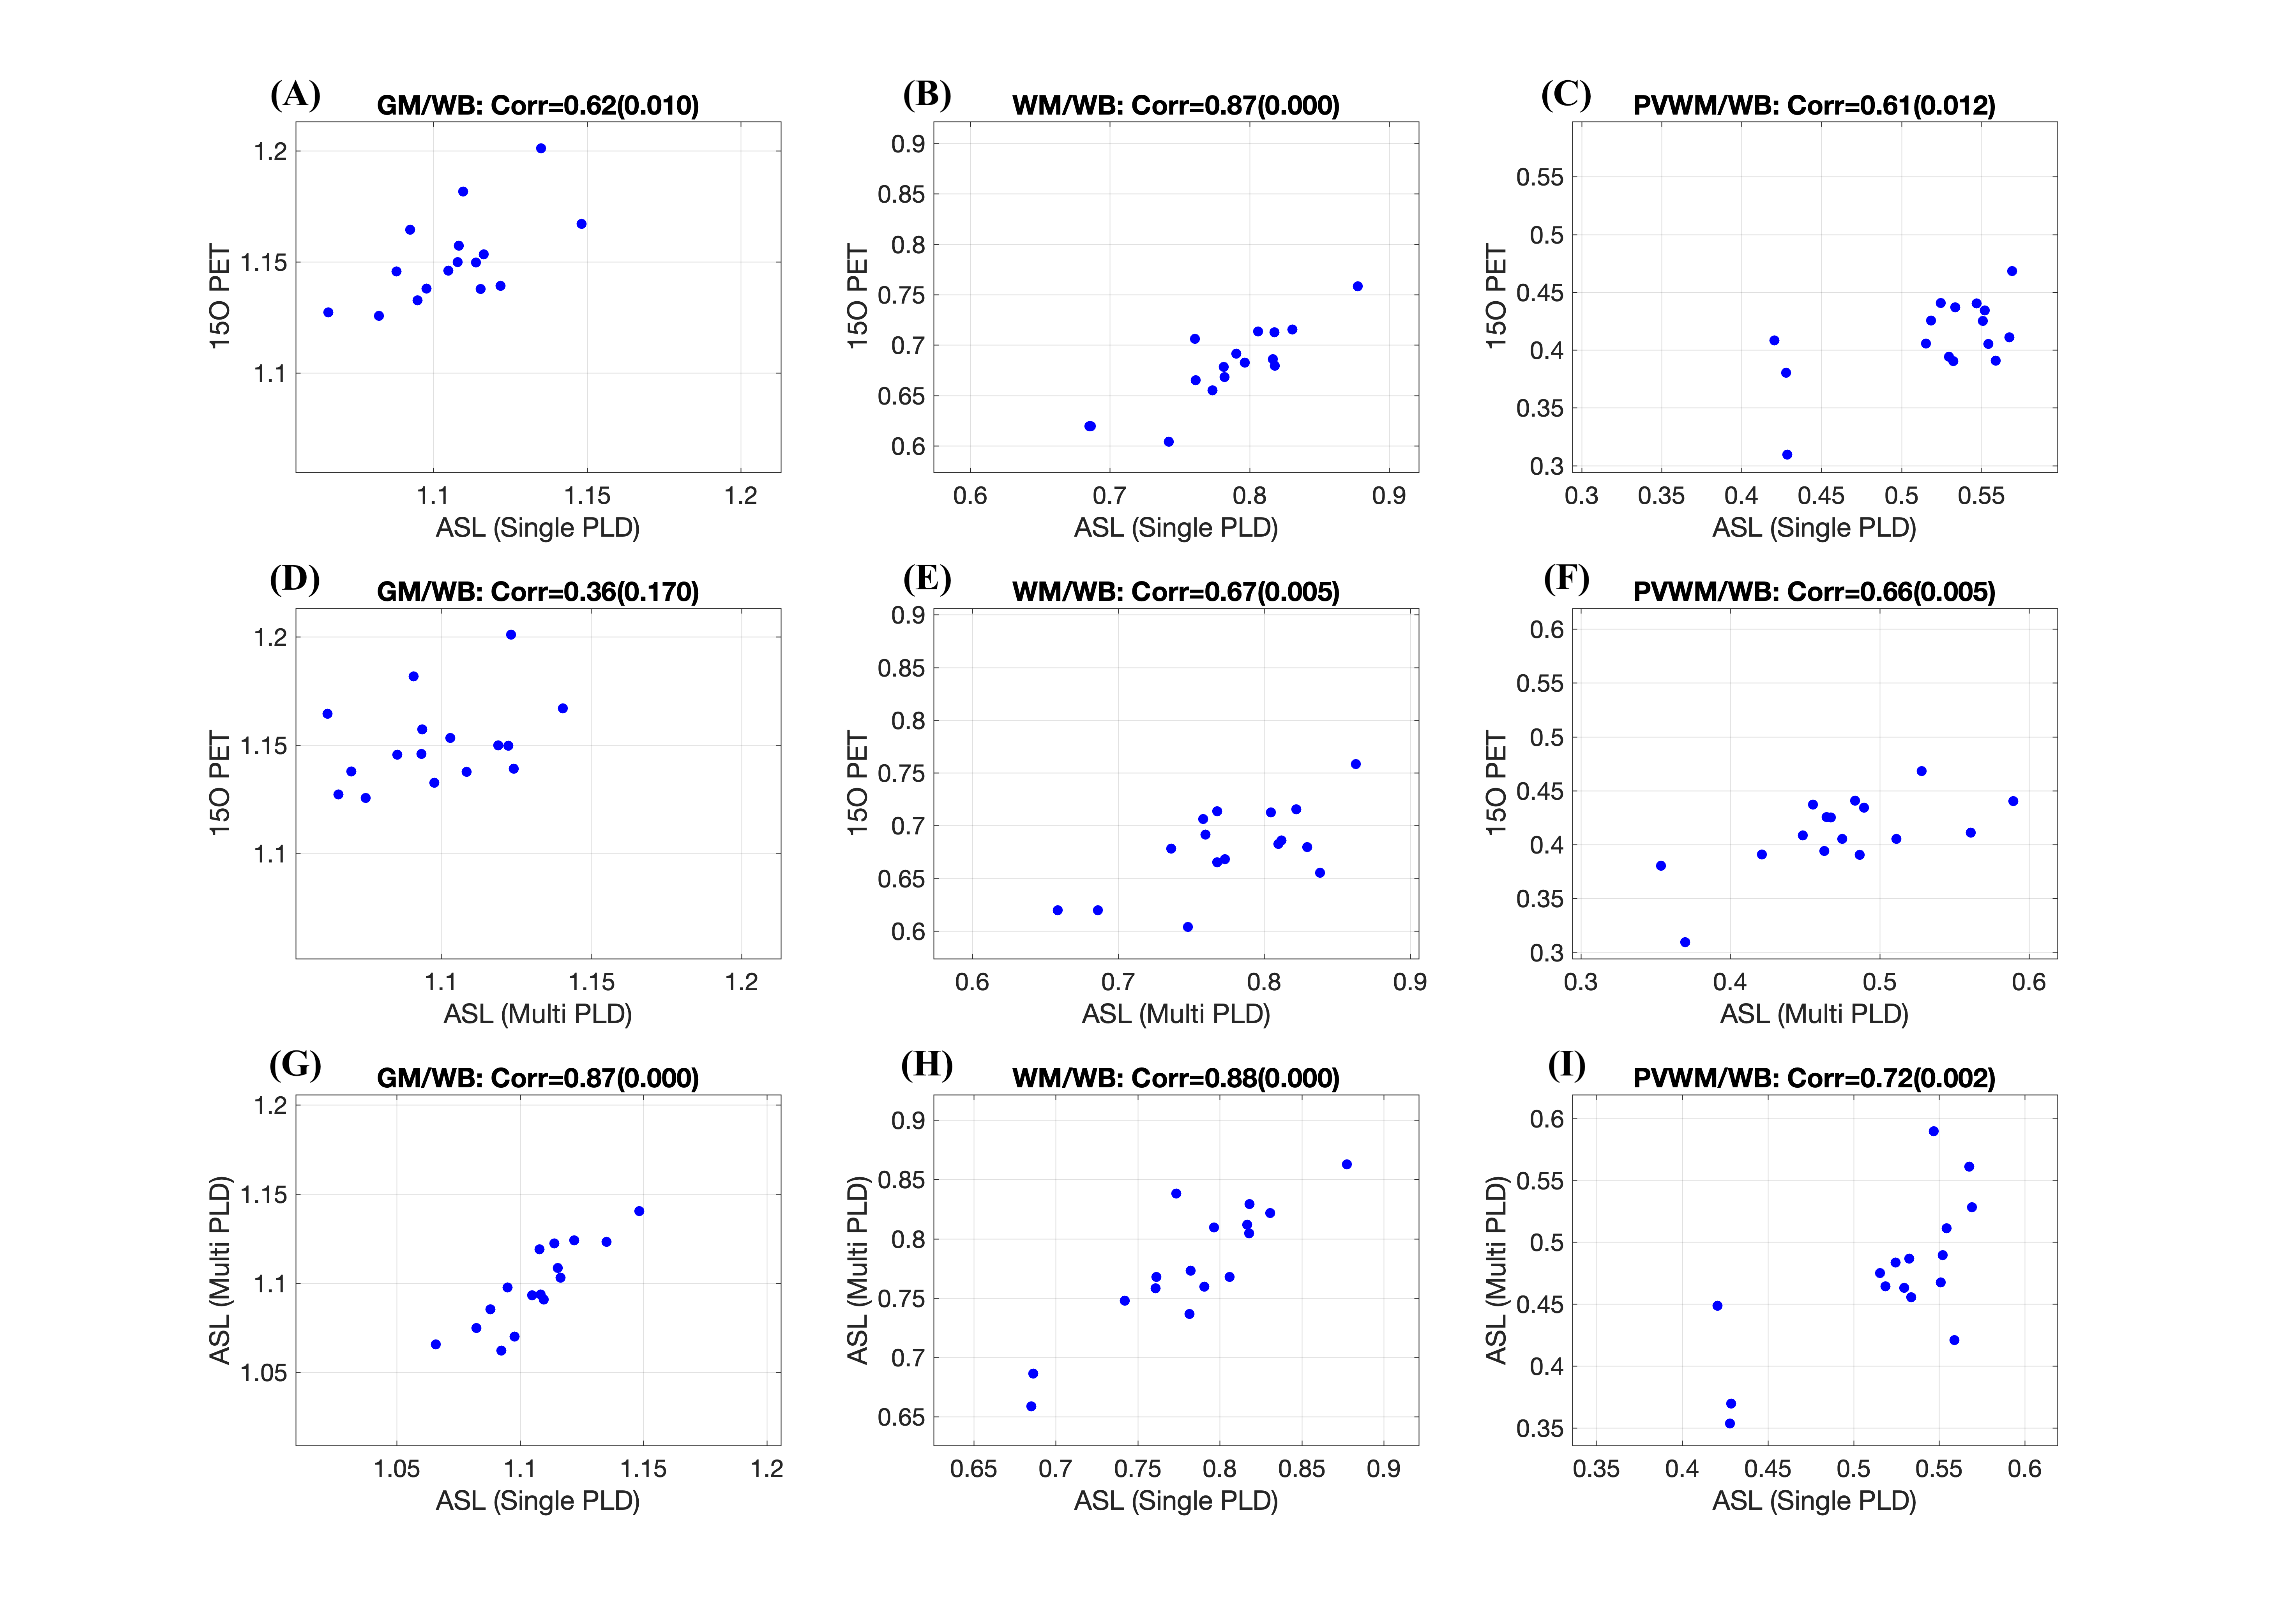
Table 1 shows summary statistics of ASL derived ROI CBF values for each scan obtained with both single-PLD and multi-PLD acquisitions. The wsCV corresponding to their intra-session reliability and their 95% confidence intervals are also shown in the table. Figure 2 shows the intra-session scatter plots along with unity line references, and Bland-Altman plots for visual representations of their reproducibility. The correlation coefficients and wsCV values are shown in the figure titles. The PVWM ROIs have comparable, though larger variabilities compared to the other ROIs. Specifically, they were significantly larger (p<0.05) compared to single-PLD WM, multi-PLD WB and multi-PLD GM, but not for the other ROI/protocol combinations. Figure 3 shows correlations between normalized ROI CBF values obtained with different methods. All the ROI CBF values (except GM CBF with multi-PLD ASL and PET) are significantly correlated. The correlations with PVWM CBF were comparable to that of total GM and WM ROIs. Notably PET derived GM CBF was higher (Figure 3: A,D) while the WM CBF was lower (Figure 3: B,E) than the ASL counterparts indicating lower GM/WM contrast and smoother ASL CBF maps compared to the PET maps. Indeed, GM/WM CBF ratio was 1.42±0.12 with single-PLD ASL and 1.42±0.13 with multi-PLD ASL, but the ratio with PET was 1.70±0.13, significantly higher (p<0.001) than the ASL methods. Correlations within modality (between the single and multi-PLD ASL derived CBF values) were higher than that between modalities (ASL MRI compared with [15O]-water PET). Figure 4 shows the mean transit delays (TD) in the PVWM ROI along with the 10th and 90th percentile TD values in GM and WM for all the subjects. The average PVWM-TD across subjects is 1.27±0.29s.Discussion
The test-retest reliabilities were of the same order in all the ROIs even though the PVWM ROI is over an order of magnitude smaller than the other ROIs and weakly perfused. Comparison of relative PVWM CBF obtained with [15O]-water PET and ASL demonstrated significant correlations comparable to WM and are larger than GM, which was unexpected.Conclusion
We demonstrated that with current advanced ASL acquisition strategies, CBF in the weakly perfused PVWM can be reliably measured. Future studies will focus on assessing its repeatability in older and diseased populations and using absolute [15O]-water PET CBF measurements, and also on evaluating its potential as a biomarker of CSVD.Acknowledgements
NIH Grants R01 NS111115, R01 EB025220-02 and R03 AG063213.References
1. Cuadrado-Godia E, Dwivedi P, Sharma S, et al. Cerebral small vessel disease: A review focusing on pathophysiology, biomarkers, and machine learning strategies. J Stroke. 2018; 20(3):302-320. doi:10.5853/jos.2017.029222.
2. Cannistraro RJ, Badi M, Eidelman BH, Dickson DW, Middlebrooks EH, Meschia JF. CNS small vessel disease: A clinical review. Neurology. 2019; 92(24):1146-1156. doi:10.1212/WNL.0000000000007654
3. Wardlaw JM, Smith EE, Biessels GJ, et al. Neuroimaging standards for research into small vessel disease and its contribution to ageing and neurodegeneration. Lancet Neurol. 2013; 12(8): 822-838. doi:10.1016/S1474-4422(13)70124-8
4. Detre JA, Alsop DC, Vives LR, Maccotta L, Teener JW, Raps EC. Noninvasive MRI evaluation of cerebral blood flow in cerebrovascular disease. Neurology. 1998; 50(3): 633-641. http://www.ncbi.nlm.nih.gov/pubmed/9521248.
5. Moody DM, Bell MA, Challa VR. Features of the cerebral vascular pattern that predict vulnerability to perfusion or oxygenation deficiency: an anatomic study. Am J Neuroradiol.1990; 11(3): 431-439.
6. Dolui S, Tisdall D, Vidorreta M, et al. Characterizing a perfusion-based periventricular small vessel region of interest. NeuroImage Clin. 2019;23. doi:10.1016/j.nicl.2019.101897
7. Holland CM, Smith EE, Csapo I, et al. Spatial distribution of white-matter hyperintensities in Alzheimer disease, cerebral amyloid angiopathy, and healthy aging. Stroke. 2008; 39(4): 1127-1133. doi:10.1161/STROKEAHA.107.497438
8. Fan AP, Guo J, Khalighi MM, et al. Long-Delay Arterial Spin Labeling Provides More Accurate Cerebral Blood Flow Measurements in Moyamoya Patients: A Simultaneous Positron Emission Tomography/MRI Study. Stroke. 2017;48(9): 2441-2449. doi:10.1161/STROKEAHA.117.017773
9. Fan AP, Khalighi MM, Guo J, et al. Identifying hypoperfusion in moyamoya disease with arterial spin labeling and an [15O]-Water positron emission tomography/magnetic resonance imaging normative database. Stroke. 2019;50(2): 373-380. doi:10.1161/STROKEAHA.118.023426
Figures