2741
ASL perfusion and disability in primary progressive MS: an observational cohort study1Neuroradiology, APHM La Timone, Marseille, France, 2Aix-Marseille Univ, CNRS, CRMBM, UMR 7339, Marseille, France, 3Institute of Neuroimmunology and MS (INIMS), University Medical Centre Hamburg-Eppendorf, Hamburg-Eppendorf, Germany, 4Neurology, University medical centre Hamburg-Eppendorf, Hamburg-Eppendorf, Germany, 5APHM La Timone, CEMEREM, Marseille, France
Synopsis
Disability progression in Multiple Sclerosis (MS) is driven by inflammation and neurodegeneration. Arterial spin labelling (ASL) is a non-invasive MRI method for the assessment of brain perfusion without the need for gadolinium. Here, we explored ASL perfusion as a biomarker for diseases progression and disability in a cohort of 77 patients with primary progressive MS (PPMS). While brain perfusion seemed rather stable during the follow-up of up to 5 years, we observed an association between higher regional perfusion rates and cognitive performance and hand functioning. Altered perfusion in PPMS seems thus not closely related to the major pathomechanism neurodegeneration.
Introduction
MS is the most frequent cause of non traumatic neurological disability in young adults and middle-ages adults1. Arterial spin labelling (ASL) is a non invasine method for the assessment of brain perfusion with no contrast accumulation. The CBF evolution has never been studied in an exclusive large cohort of primary progressive MS (PPMS).purpose
Explore evolution of ASL perfusion and disability in a longitudinal primary progressive MS cohort.methods
Patients with primary progressive MS were recruited at the Institute of Neuroimmunology and MS of the University medical Centre Hamburg-Eppendorf between 2012 and 2018 for a prospective observational cohort study with annual follow ups over 5 years. Visits included MRI and a clinical test battery: the timed-25-foot-walk (T25FW, short distance walking speed), 9-Hole-Peg-Test (NHPT, hand functioning), the symbol digit Modalities Test (SDMT, information processing) and Expanded Disability Status Scale (EDSS). The MRI protocol (Siemens Skyra, 3T) included a T1-weighted sequence, T2 sequence and pASL perfusion. Patients were eligible for this observational cohort study if they were diagnosed with PPMS according to the McDonald criteria 2010 2 and had an EDSS of <=7.0. Images were processed with the functional imaging software library (FSL) and FreeSurfer software. After manual outlining of white matter lesions and subsequent lesion filling of T1 images we used the freesurfer longitudinal pipeline. The gray matter was parcellated into 34 cortical regions per hemisphere and 8 subcortical regions based on the Desikan-Killiany atlas 3 Perfusion ASL images were processed with ANTs in R. As no additional M0 was acquired, we computed the CBF based on an estimated M0 from the two control images of the ASL acquisition. We extracted the mean cbf values for each atlas region and computed mean values for the whole brain, the cortex, white matter and deep grey matter. To investigate change of perfusion over time and the association with disability markers, we applied linear mixed effect model accounting for intraindividual correlations of recurrent observation. All models were corrected for age and sex. Longitudinal models were further corrected for baseline values. We extracted standardized beta values as estimates and used FDR to correct for multiple testing.results
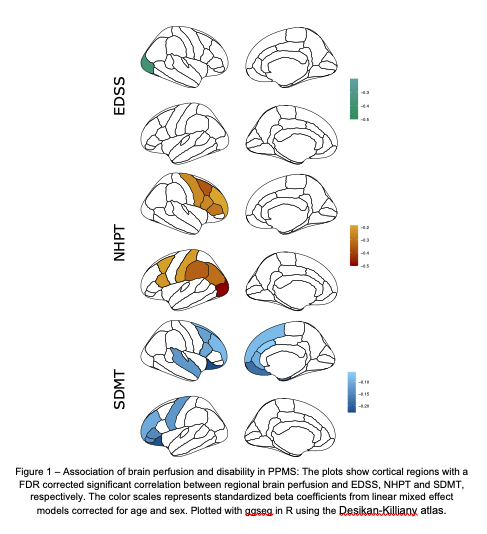
The 77 recruited patients included 26 women and 51 men. At the first visit, the mean age was 52 years (range 39-69), the mean EDSS was 4 (range 2-7), Disability, as measured by the EDSS increased by 0.1 points per year, while SDMT, NHPT and T25FW did not show a significant change. During follow up, we observed now significant change in the average perfusion, neither on a whole brain level nor in the tissue subsets or in single cortical regions. However, CBF was generally lower in males (p < 0.023). Using disease duration since first symptoms as time variable, we observed similar results, i.e. we detected no significant change of the CBF with longer disease duration. Exploring associations of CBF with clinical disability we found that higher whole brain perfusion indicated lower SDMT scores (p = 0.002) and slower NHPT performance (p = 0.005), while there were no correlations with EDSS and T25FW. On a regional level (Figure 1), we found an isolated inverse correlation between EDSS and CBF in the right lateraloccipital cortex (beta = -0.39, pFDR = 0.048). Broader association patterns were observed for NHPT and SDMT. Hand functioning was associated with increased perfusion in 11 cortical regions (beta between -0.2 and -0.5, all pFDR < 0.05) mainly central and parietal areas. Increased perfusion in 18 predominantly frontal cortical regions, the right putamen and both amygdala indicated worse performance in the SDMT (beta between -0.05 and -0.25, all pFDR < 0.05.)discussion
The CBF evolution has never been studied in an exclusive population of PPMS in a large cohort over several years. In this longitudinal cohort of PPMS, we found no relevant change of CBF during follow-up nor a clear association with disease duration. Previous research indicated an association between brain perfusion and inflammation 4. In our cohort of PPMS patients, neurodegeneration can be assumed as the major pathomechanism. The lack of association might thus indicate only a weak impact of neurodegeneration on brain perfusion. In contrast, we found a robust and conceptually meaningful association pattern between higher regional CBF and worse cognitive performance and hand functioning. EDSS and T25FW might suffer from floor effects and SDMT and NHPT might be better estimates of global neuronal loss.conclusion
Higher brain perfusion indicates worse cognitive performance in PPMS and might represent neuronal loss. However, there seems no relevant change of brain perfusion over up to five years in this predominantly neurodegenerative population.Acknowledgements
No acknowledgement found.References
1Grigoriadis N, van Pesch V, Paradig MS; Paradig MS Group.A basicoverview of multiple sclerosis immunopathology.Eur J Neurol2015;22(suppl 2):3–13CrossRef Medline
2. Polman CH, Reingold SC, Banwell B et al. Diagnostic criteria for multiple slerosis: 2010 revisions to the McDonald criteria. Ann Neurol 2011;69:292-302
3 Alexander B, Loh WY, Matthews LG, Murray AL, Adamson C, Beare R, et al. Desikan-Killiany-Tourville Atlas Compatible Version of M-CRIB Neonatal Parcellated Whole Brain Atlas: The M-CRIB 2.0. Frontiers in Neuroscience [Internet]. 5 févr 2019 [cité 16 déc 2020];13. Disponible sur: https://www.frontiersin.org/article/10.3389/fnins.2019.00034/full
4 Wuerfel J, Bellmann-Strobl J, Brunecker P, et al.Changesin cerebralperfusion precede plaque formation in multiple sclerosis: a longi-tudinal perfusion MRI study.Brain2004;127(Pt 1):111–19CrossRef Medline
Figures