2740
Relationship between global grey matter perfusion, damage and disability in multiple sclerosis1Institute for Advanced Biomedical Technologies,Department of Neuroscience, Imaging and Clinical Sciences, "G. D'Annunzio University" of Chieti-Pescara, Chieti, Italy, 2Department of Neurophysics, Max Planck Institute for Human Cognitive and Brain Sciences, Leipzig, Germany, 3Cardiff University Brain Research Imaging Centre (CUBRIC) School of Psychology, Cardiff University, Cardiff, United Kingdom, 4MS Centre, Neurology Unit, SS. Annunziata University Hospital, Chieti, Italy
Synopsis
We investigated the relationship between grey matter perfusion and clinical and conventional MRI measures in patients with relapsing multiple sclerosis (MS) to test the hypothesis that an impaired energy supply is associated with the development of brain damage and clinical disability. Using multi-inversion time pulsed ASL we demonstrated that MS patients have significantly lower cerebral grey matter perfusion when compared to healthy controls. In the patients, lower perfusion correlates with greater tendency to develop irreversible tissue damage and with worse clinical scores, suggesting that altered energy supply may directly contribute to damage and disability in MS.
Introduction
Multiple sclerosis (MS) is associated with diffuse hypo-perfusion, i.e., reduced energy supply, in the cerebral grey matter (GM)1,2,3, yet the contribution of this alteration to damage and disability remains elusive. Here, we test the relationship between cerebral perfusion and clinical and conventional MRI metrics in a single-centre, large cohort study of MS patients. Firstly, we investigate the relationship between GM perfusion and lesional volumes, under the hypothesis that impaired energy supply would be associated with the development of lesions and with the brain’s tendency towards irreversible tissue loss. Secondly, we relate GM perfusion to physical and cognitive measures to identify clinical correlates of dysfunction in energy supply.Methods
Right-handed relapsing-remitting MS patients and healthy controls (HC) participated in this study. Patients were included if clinically stable whether or not they were on disease modifying treatment. We tested upper limb dexterity (9-hole peg test, 9HPT), walking (timed 25-foot walk, T25FW) and cognition [paced auditory serial addition test (PASAT3s) and the symbol digit modalities test (SDMT)]. We also combined the 9HPT, T25FW and PASAT3s into the multiple sclerosis functional composite (MSFC) score. The conventional imaging protocol at 3T included T1-weighted images (FSPGR: TE/TR=3.0/7.8ms, TI=450ms, FA=20°, resolution=1mm3) and T2-weighted images (FLAIR: TE/TR=122.3/9502ms, TI=2250ms, FA=90°, resolution=0.86x0.86x4.5mm3) to identify MS lesions and to co-register ASL with anatomy. T1-hypointense and T2 lesions were semi-automatically segmented using Jim (v.6, Xinapse) on T1-weighted and T2-weighted images4. We calculated the proportion of the volume of T2-hyperintense lesions that appears hypointense on T1-weighted images5 (termed T1/T2 ratio). Perfusion-weighted data were collected with multi-inversion time pulsed ASL (PICORE QUIPSS II6, resolution=3x3x8mm3) with 8 inversion times distributed in two separate scans (16 tag-control pairs for TI =400/500/600/700ms, and 8 tag-control pairs for TI=1.1/1.4/1.7/2.0s). The ASL protocol included also a proton density image (M0) for cerebral blood flow (CBF) calibration and a minimum contrast image to correct for the coil sensitivity profile. The two sets of ASL tag-control images were motion corrected to the M0 image (mcflirt7), control-tag subtracted, averaged across pairs and combined into a single multi-TI series that was fed to oxford_asl (BASIL8) for CBF quantification. Oxford_asl was run with partial volume correction9, coil sensitivity correction (bias field calculated via SPM12 segmentation10 on the minimum contrast image) and calibrated with the M0 signal from subject-specific ventricle masks. The median CBF value within GM voxels (defined via the tissue probability map at 80% on the T1-weighted image) was considered as our aggregate measure of global GM perfusion. Associations between CBF and lesion volumes, physical and cognitive measures were assessed via Pearson’s correlation after outlier correction.Results
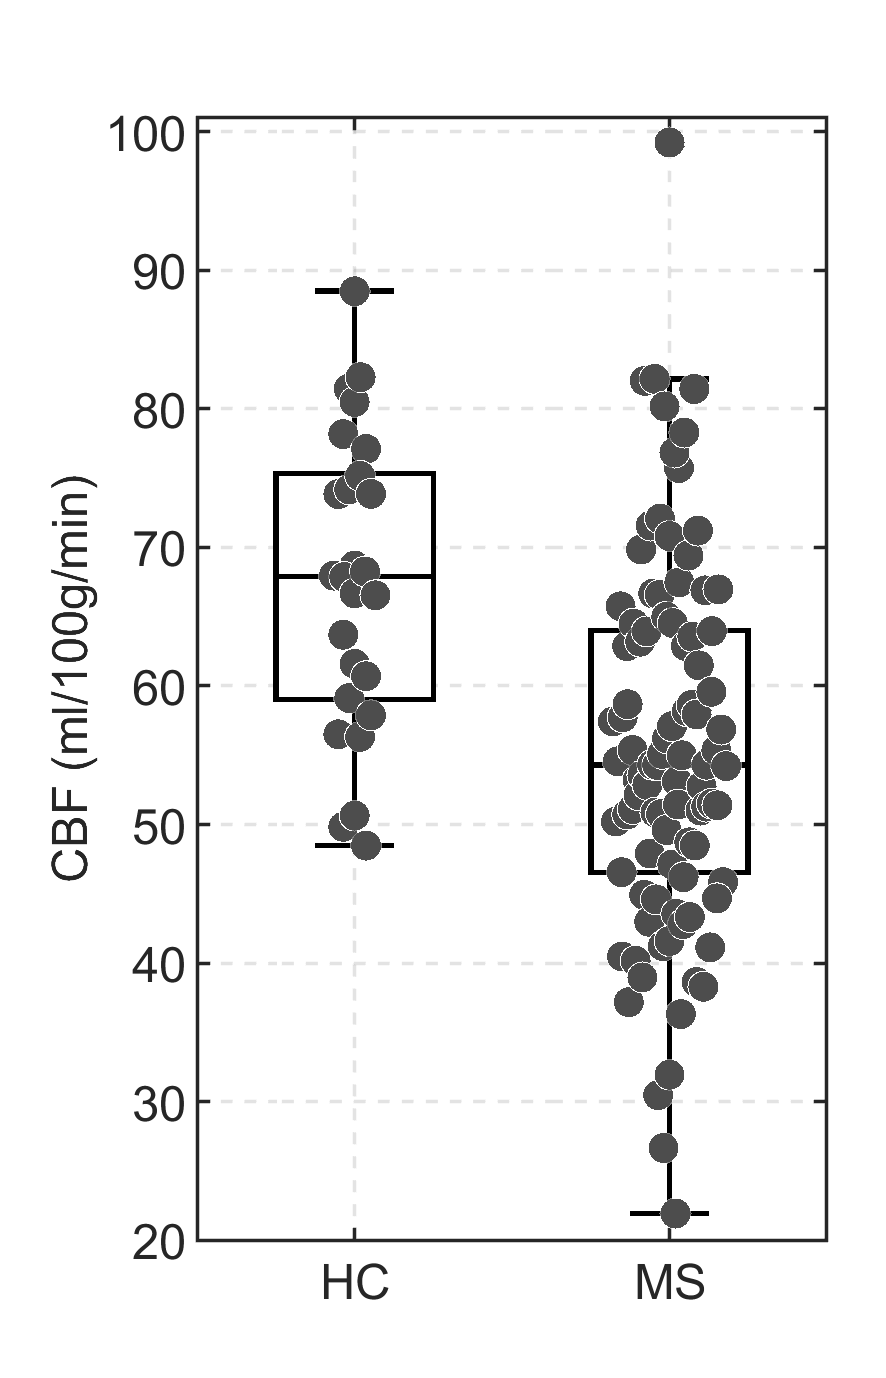
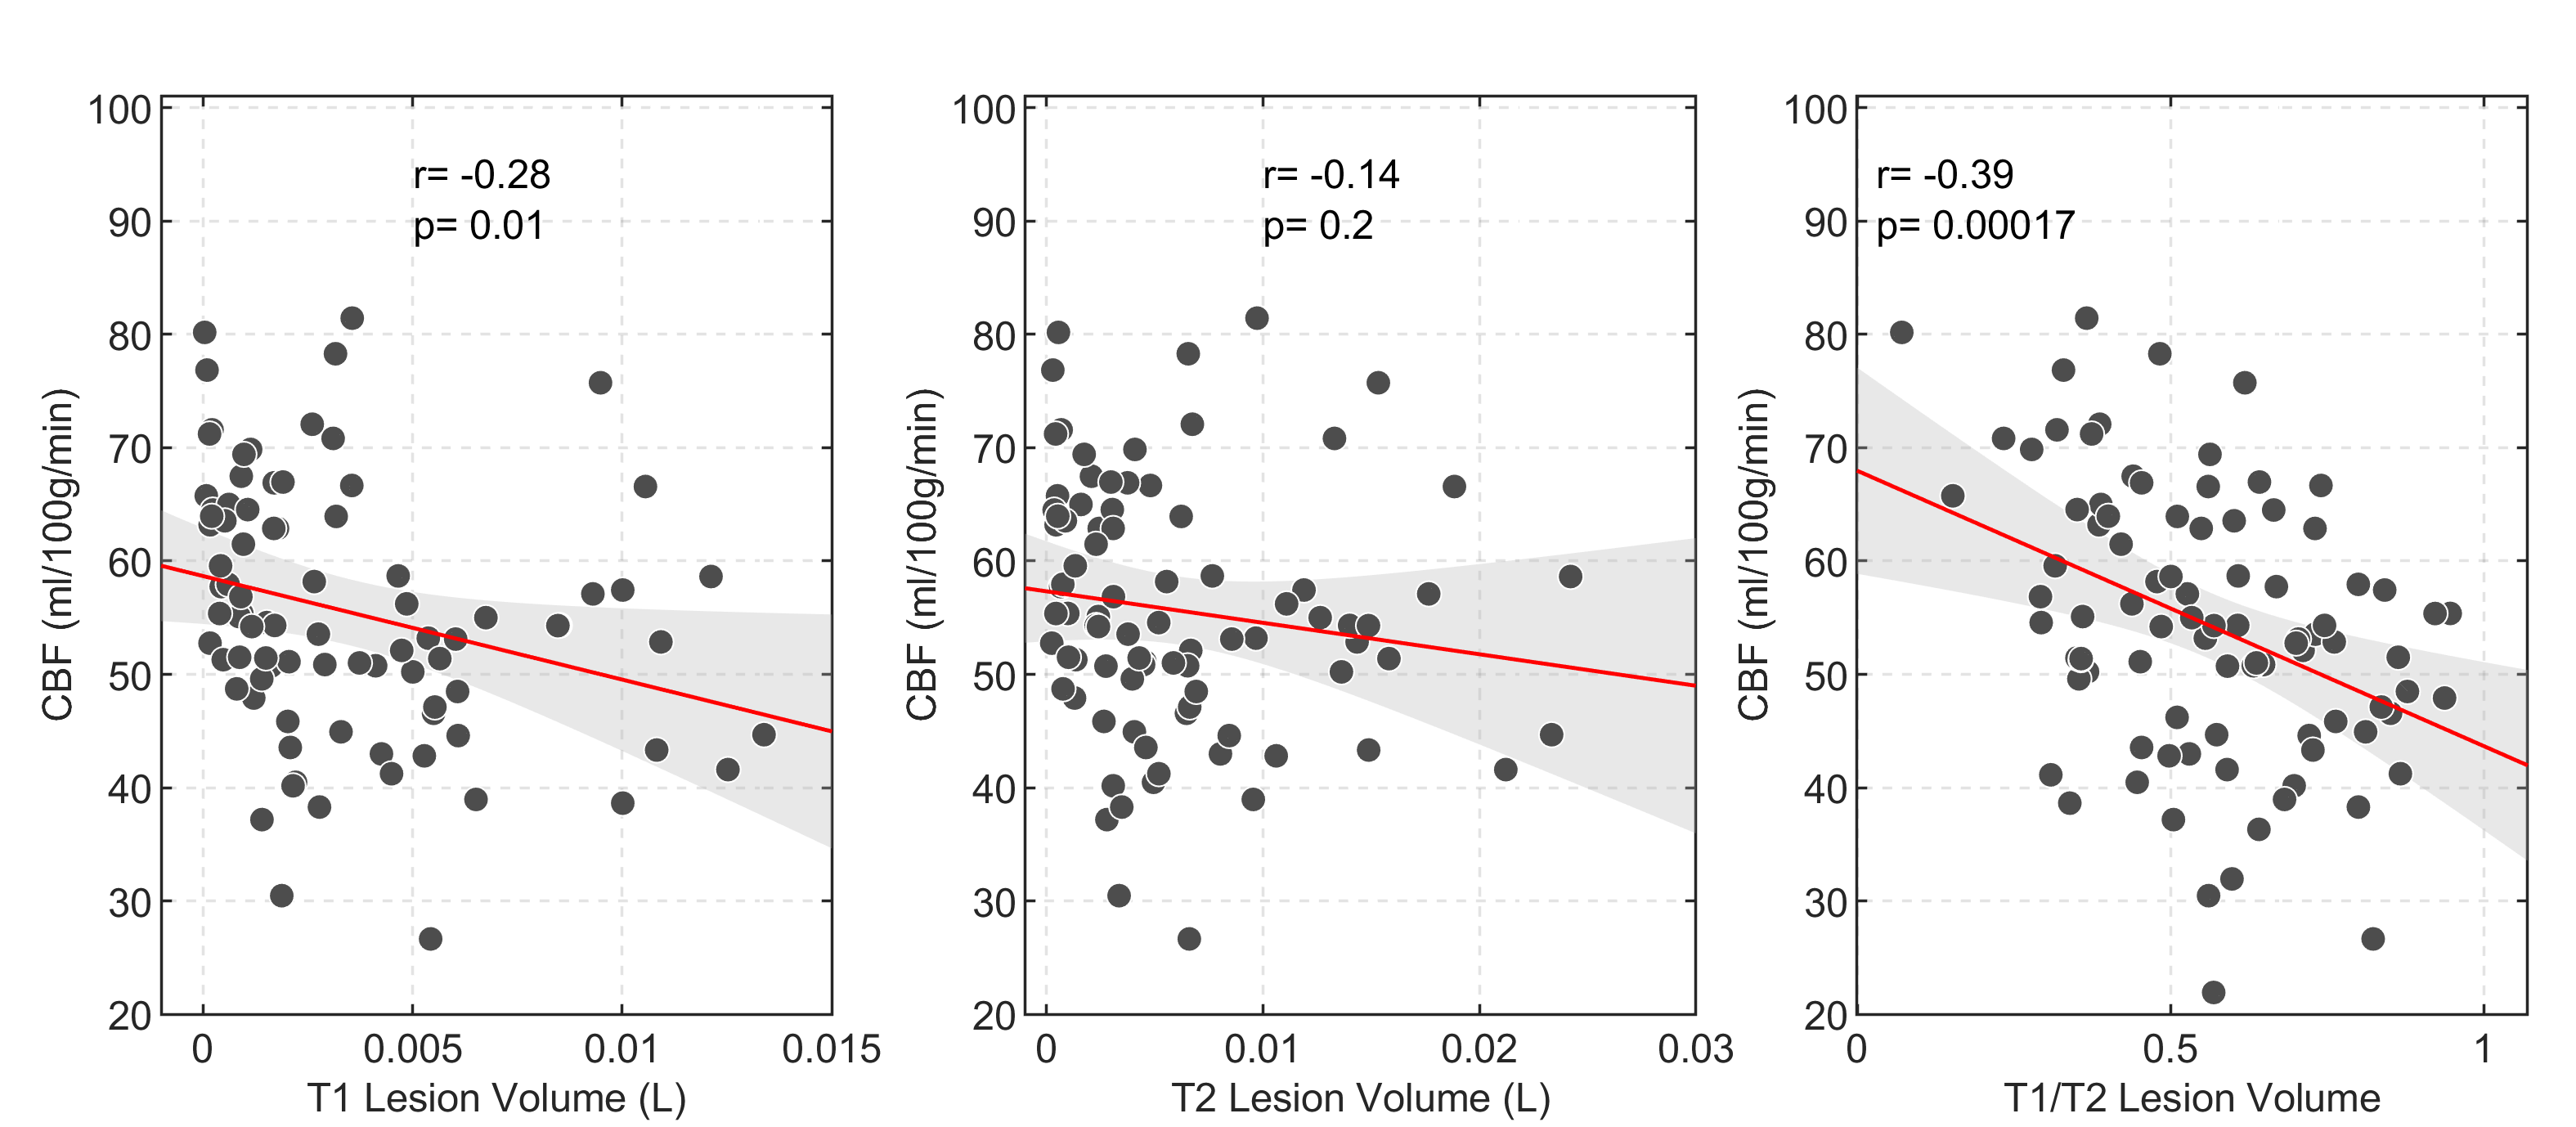
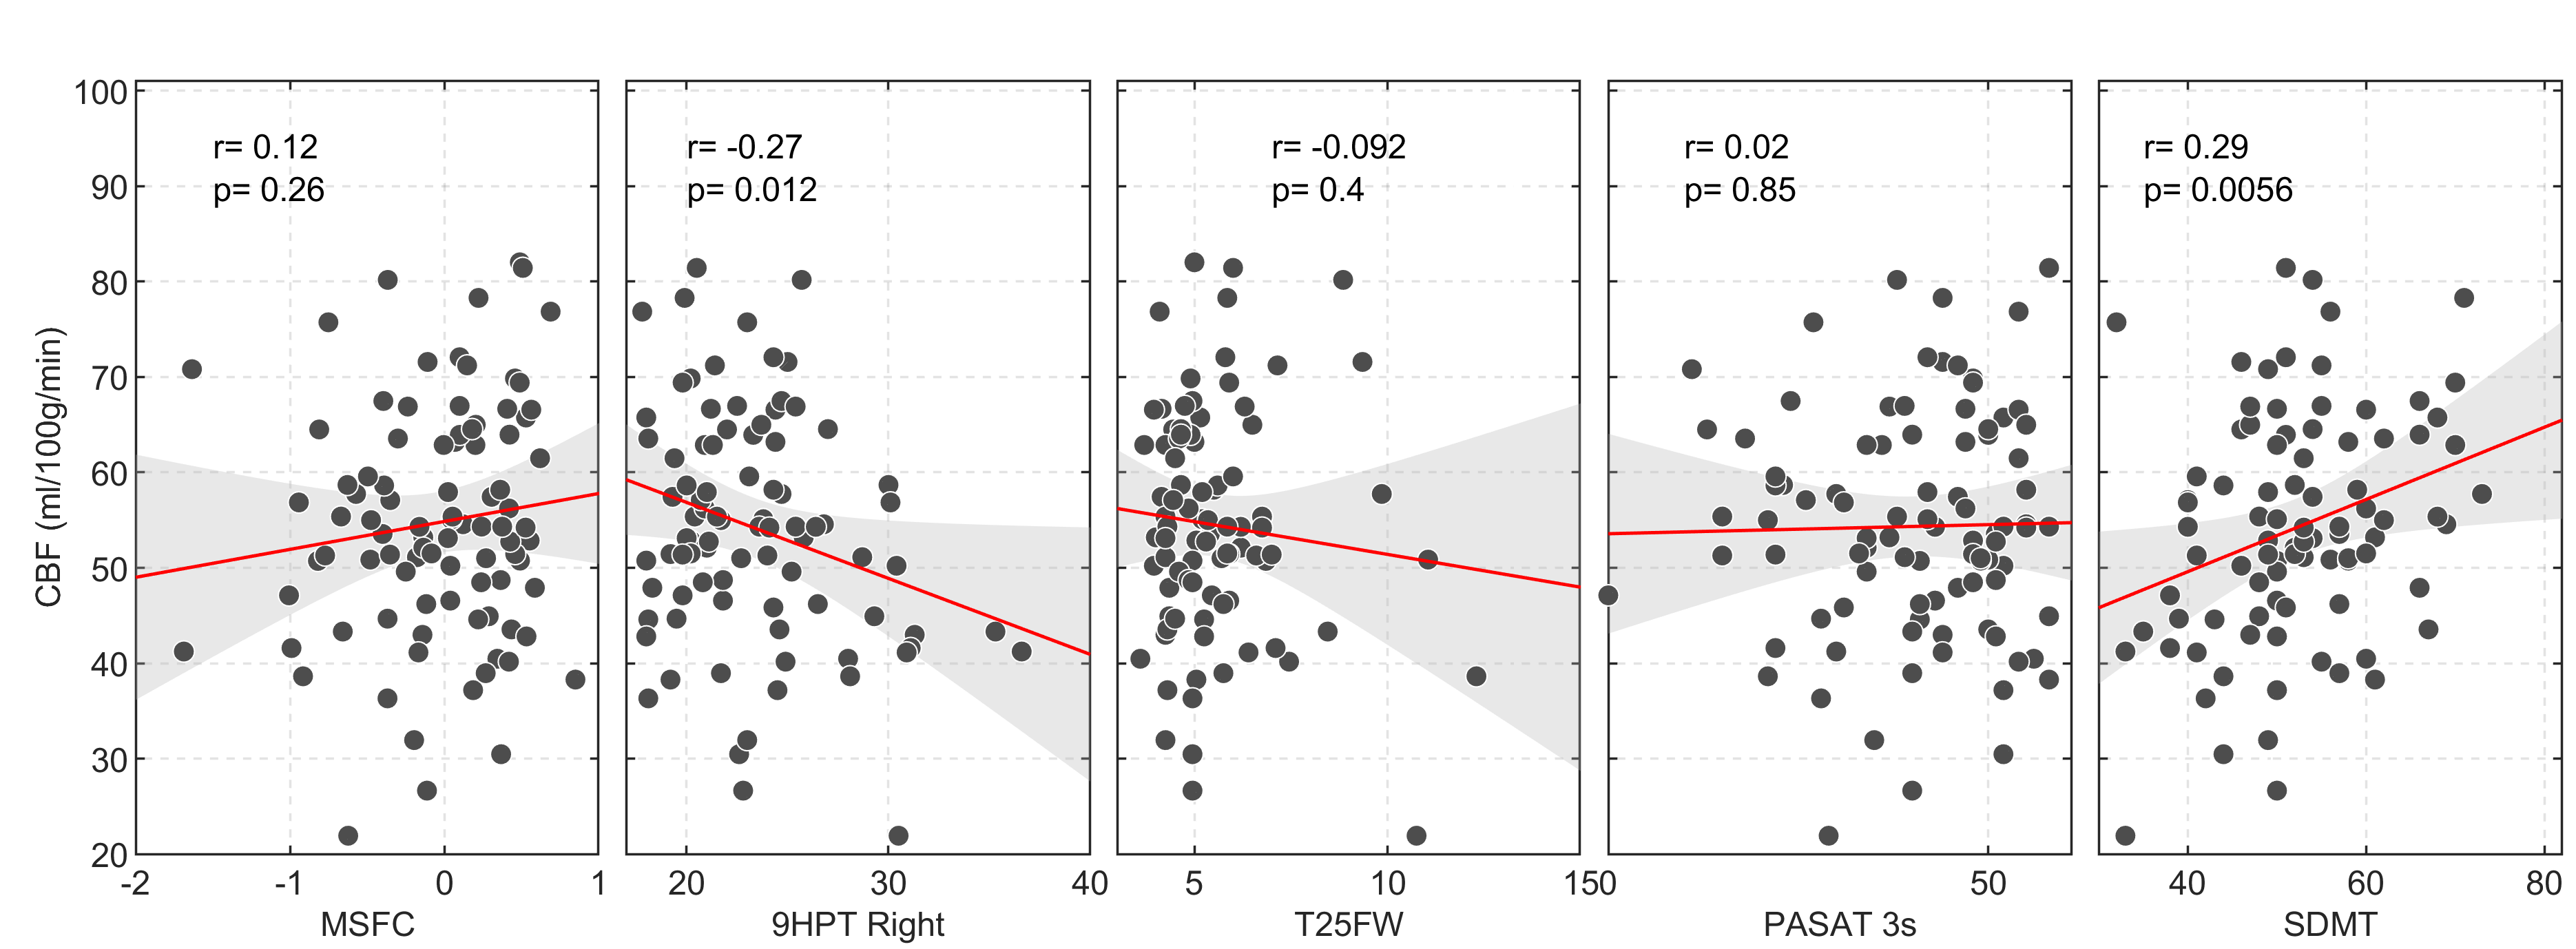
We recruited 94 MS patients (67 women, 43.8±9.7y.o.) and 26 HC (15 women, 39.8±10.5y.o.). Patients showed significantly lower scores than HC for PASAT3s (p=5.4*10-5), 9HPT (p=2.2*10-4), T25FW (p=0.009) and SDMT (p=1.4*10-4). There was a significant between group difference in the levels of global GM CBF: MS patients had lower CBF than HC (MS: 55.4±13.3ml/100g/min; HC: 67.5±10.7ml/100g/min; p=3.8*10-5) (Figure 1). CBF was negatively associated with T1 hypointense lesion volume (r=-0.28, p=0.01) and with T1/T2 ratio (r=-0.39, p=0.00017) (Figure 2), i.e., lower global GM perfusion was associated with MRI measures of irreversible tissue damage. There was a significant correlation between the right 9-HPT test and global GM CBF (r=-027, p=0.012), as well as between CBF and SDMT (r=0.29, p=0.0056) (Figure 3), i.e., lower global GM perfusion was associated with worse hand dexterity and speed of processing. No significant correlation was found between perfusion values and T25FW or MSFC (p>0.05).Discussion
While confirming the relationship between hypoperfusion and the amount of brain lesional damage11, our results of a positive correlation between CBF and T1/T2 ratio also suggest that altered energy supply is associated with a greater tendency towards the development of irreversible tissue loss. The relationship between perfusion changes in GM and tissue damage in the white matter may reflect the functional impact of white matter lesions on tissue dysfunction with a reduced metabolic demand at the cortical level or, alternatively, a disease phenotype, in which an alteration of the cerebrovascular system directly contributes to the development of damage in both tissue compartments. A strong association was also found between global GM perfusion and clinical measures of processing speed (SDMT) and hand dexterity. This result supports the notion that hypo-perfusion accompanies disability in MS12 and suggests that resting CBF may be a clinically meaningful marker. Despite the large sample size and the marked difference in CBF between patients and HC, no strong association between perfusion and T25FW, PASAT3s and MSFC was reported. It is possible that local changes in perfusion, as well as the characteristics of the clinical measures and the scales used to quantify them may have limited our ability to find significant association with global GM resting perfusion. The observed hypo-perfusion in MS patients is unlikely to be an artifact of atrophy-induced partial volume bias in estimation of the global perfusion because of the high probabilistic threshold chosen for the inclusion of GM voxels.Conclusion
GM hypo-perfusion in MS is strongly associated with irreversible tissue damage and with disability, suggesting that global GM CBF may be a reliable marker of dysfunction and an early indicator of a more severe disease course.Acknowledgements
No acknowledgement found.References
1. Brooks DJ, Leenders KL, Head G, Marshall J, Legg NJ, Jones T. Studies on regional cerebral oxygen utilisation and cognitive function in multiple sclerosis. Journal of Neurology, Neurosurgery & Psychiatry. 1984 Nov 1;47(11):1182-91.
2. Debernard L, Melzer TR, Van Stockum S, Graham C, Wheeler-Kingshott CA, Dalrymple-Alford JC, Miller DH, Mason DF. Reduced grey matter perfusion without volume loss in early relapsing-remitting multiple sclerosis. Journal of Neurology, Neurosurgery & Psychiatry. 2014 May 1;85(5):544-51.
3. Lipp I, Foster C, Stickland R, Davidson A, Wise RG, Tomassini V. Using multi-inversion time ASL to explore gray matter perfusion in patients with multiple sclerosis: repeatability and relationship to disease characteristics. Proc. Intl. Soc. Mag. Reson. Med. 25 (2017), 4066 (This work used a subset of the dataset presented here).
4. Lipp I, Jones DK, Bells S, Sgarlata E, Foster C, Stickland R, Davidson AE, Tallantyre EC, Robertson NP, Wise RG, Tomassini V. Comparing MRI metrics to quantify white matter microstructural damage in multiple sclerosis. Human brain mapping. 2019 Jul;40(10):2917-32.
5. Pozzilli, Carlo, et al. ‘Gender gap’ in multiple sclerosis: magnetic resonance imaging evidence. European journal of neurology, 2003, 10.1: 95-97.
6. Wong EC, Buxton RB, Frank LR. Quantitative imaging of perfusion using a single subtraction (QUIPSS and QUIPSS II). Magn Reson Med. 1998;39(5):702–8.
7. Jenkinson M, Beckmann CF, Behrens TE, Woolrich MW, Smith SM. Fsl. Neuroimage. 2012 Aug 15;62(2):782-90.
8. Chappell MA, Groves AR, Whitcher B, Woolrich MW. Variational Bayesian inference for a non-linear forward model. IEEE Transactions on Signal Processing 57(1):223-236, 2009.
9. Chappell MA, MacIntosh BJ, Donahue MJ,Jezzard P, Woolrich MW. Partial volume correction of multiple inversion time arterial spin labeling MRI data, Magn Reson Med, 65(4):1173-1183, 2011.
10. Ashburner J, Friston KJ. Unified segmentation. Neuroimage. 2005 Jul 1;26(3):839-51.
11. Amann M, Achtnichts L, Hirsch JG, Naegelin Y, Gregori J, Weier K, Thöni A, Mueller-Lenke N, Radue EW, Günther M, Kappos L. 3D GRASE arterial spin labelling reveals an inverse correlation of cortical perfusion with the white matter lesion volume in MS. Multiple Sclerosis Journal. 2012 Nov;18(11):1570-6.
12. Hojjat SP, Cantrell CG, Carroll TJ, Vitorino R, Feinstein A, Zhang L, Symons SP, Morrow SA, Lee L, O’Connor P, Aviv RI. Perfusion reduction in the absence of structural differences in cognitively impaired versus unimpaired RRMS patients. Multiple Sclerosis Journal. 2016 Nov;22(13):1685-94.
Figures