2738
Depicting the developmental trajectories of brain cerebral blood flow using 3D ASL in children aged 28 days to 15 years.1First Affiliated Hospital of Xi 'an Jiaotong University, Xi'an, Shaanxi, China, 2MR Research China, GE Healthcare, Beijing, China
Synopsis
Adequate cerebral blood flow (CBF) is essential for development of brain structure and function. However, little is known about the developmental trajectory of CBF across the broad age range in childhood. This study aims to investigate the spatiotemporal evolution of CBF in cerebral cortex and basal ganglia in healthy term children aged from 28 days to 15 years. Our results indicated that the estimated age with highest CBF was earliest in the occipital lobe, followed by temporal and parietal lobe, at last in the frontal lobe. The perfusion of basal ganglia showed a U-shaped curve, which slowly increased with age.
Main Findings
The estimated age with highest cerebral blood flow is earliest in the occipital lobe, followed by temporal and parietal lobe, at last in the frontal lobe. The perfusion of basal ganglia shows a U-shaped curve, which slowly increases with age.Introduction
Adequate cerebral blood flow (CBF) is essential for the ongoing development of brain structure and function from birth to childhood. Prior studies have revealed that CBF varies at different rates in different brain regions. Specifically, age-related change of cortical CBF shows a first inverted U-shape followed by a U-shape trajectory in most regions1. However, most studies are small age range, little is known about the CBF developmental trajectories of the cortex and the deep gray matter, such as the basal ganglia across the broad age range. Therefore, this study aims to investigate the CBF developmental trajectories of cortex and basal ganglia in healthy term children aged from 28 days to 15 years.Methods
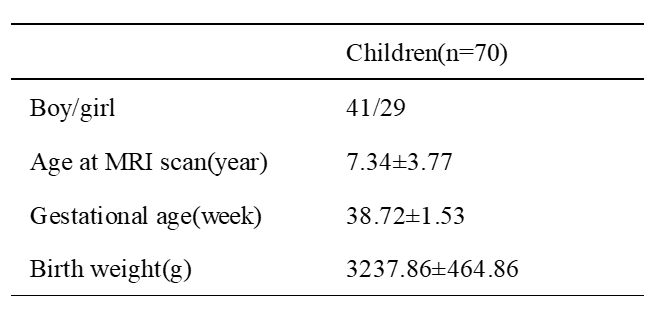
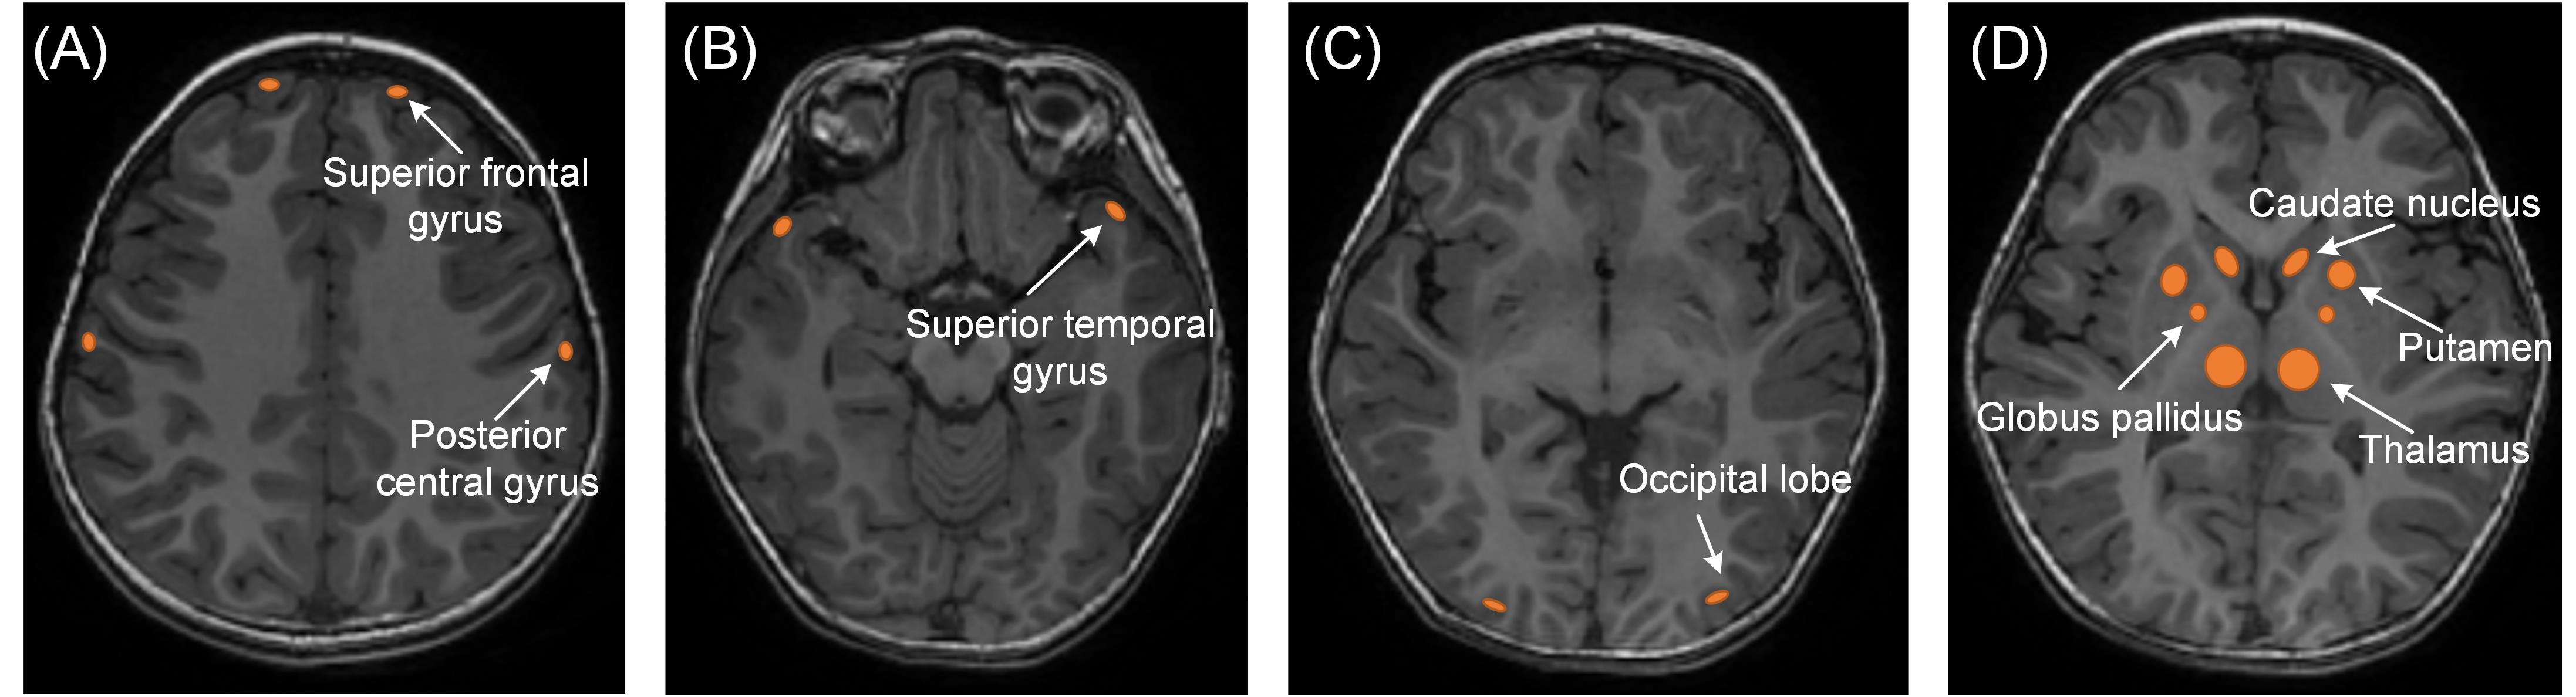
This study was approved by the local Internal Review Board and written informed consent was obtained from all children’s parents before MRI scanning. Patients 70 subjects (41 boys, 29 girls) who were born at full term without abnormalities in brain MR images were included, and the age ranged from 28 days to 15 years.(Table 1) The main exclusion criteria were all factors that could have affected CBF such as metabolic diseases, seizure or headache, brain malformations. MR Imaging Images were acquired on a 3.0T scanner (Signa HDxt, GE Healthcare, Milwaukee, WI, USA) with an 8-channel head coil. The protocols included: (1) transverse 3D T1-weighted sequence (TR/TE,10ms/4.6ms; matrix, 256×256; section-thickness, 1mm; FOV, 240mm); (2) 2D T2-weighted sequence (TR/TE, 4200ms/120ms; matrix, 256×256; section-thickness,4mm; FOV,240mm); (3)3D-PCASL sequence (TR/TE, 4642ms/10.3ms; matrix,288×192; section-thickness,4mm;FOV,200mm;PLD,1525ms).Data and statistical analysis The CBF map was computed in mL/100g/minute with vendor provided software (Functool version 9.4, GE Healthcare). Manual regions of interest (ROIs) were placed on the CBF map by using the aligned anatomical image as guidance. Our ROIs involved cortex (bilateral frontal、parietal、temporal and occipital lobe) and basal ganglia (bilateral thalamus、globus pallidus、putamen and caudate nucleus). (Figure 1) .ROIs were about 20-100mm2 in size and were placed carefully to exclude the margins of the nucleis. All the statistics were assessed by SPSS 18.0 and Graphpad Prism 8.Results
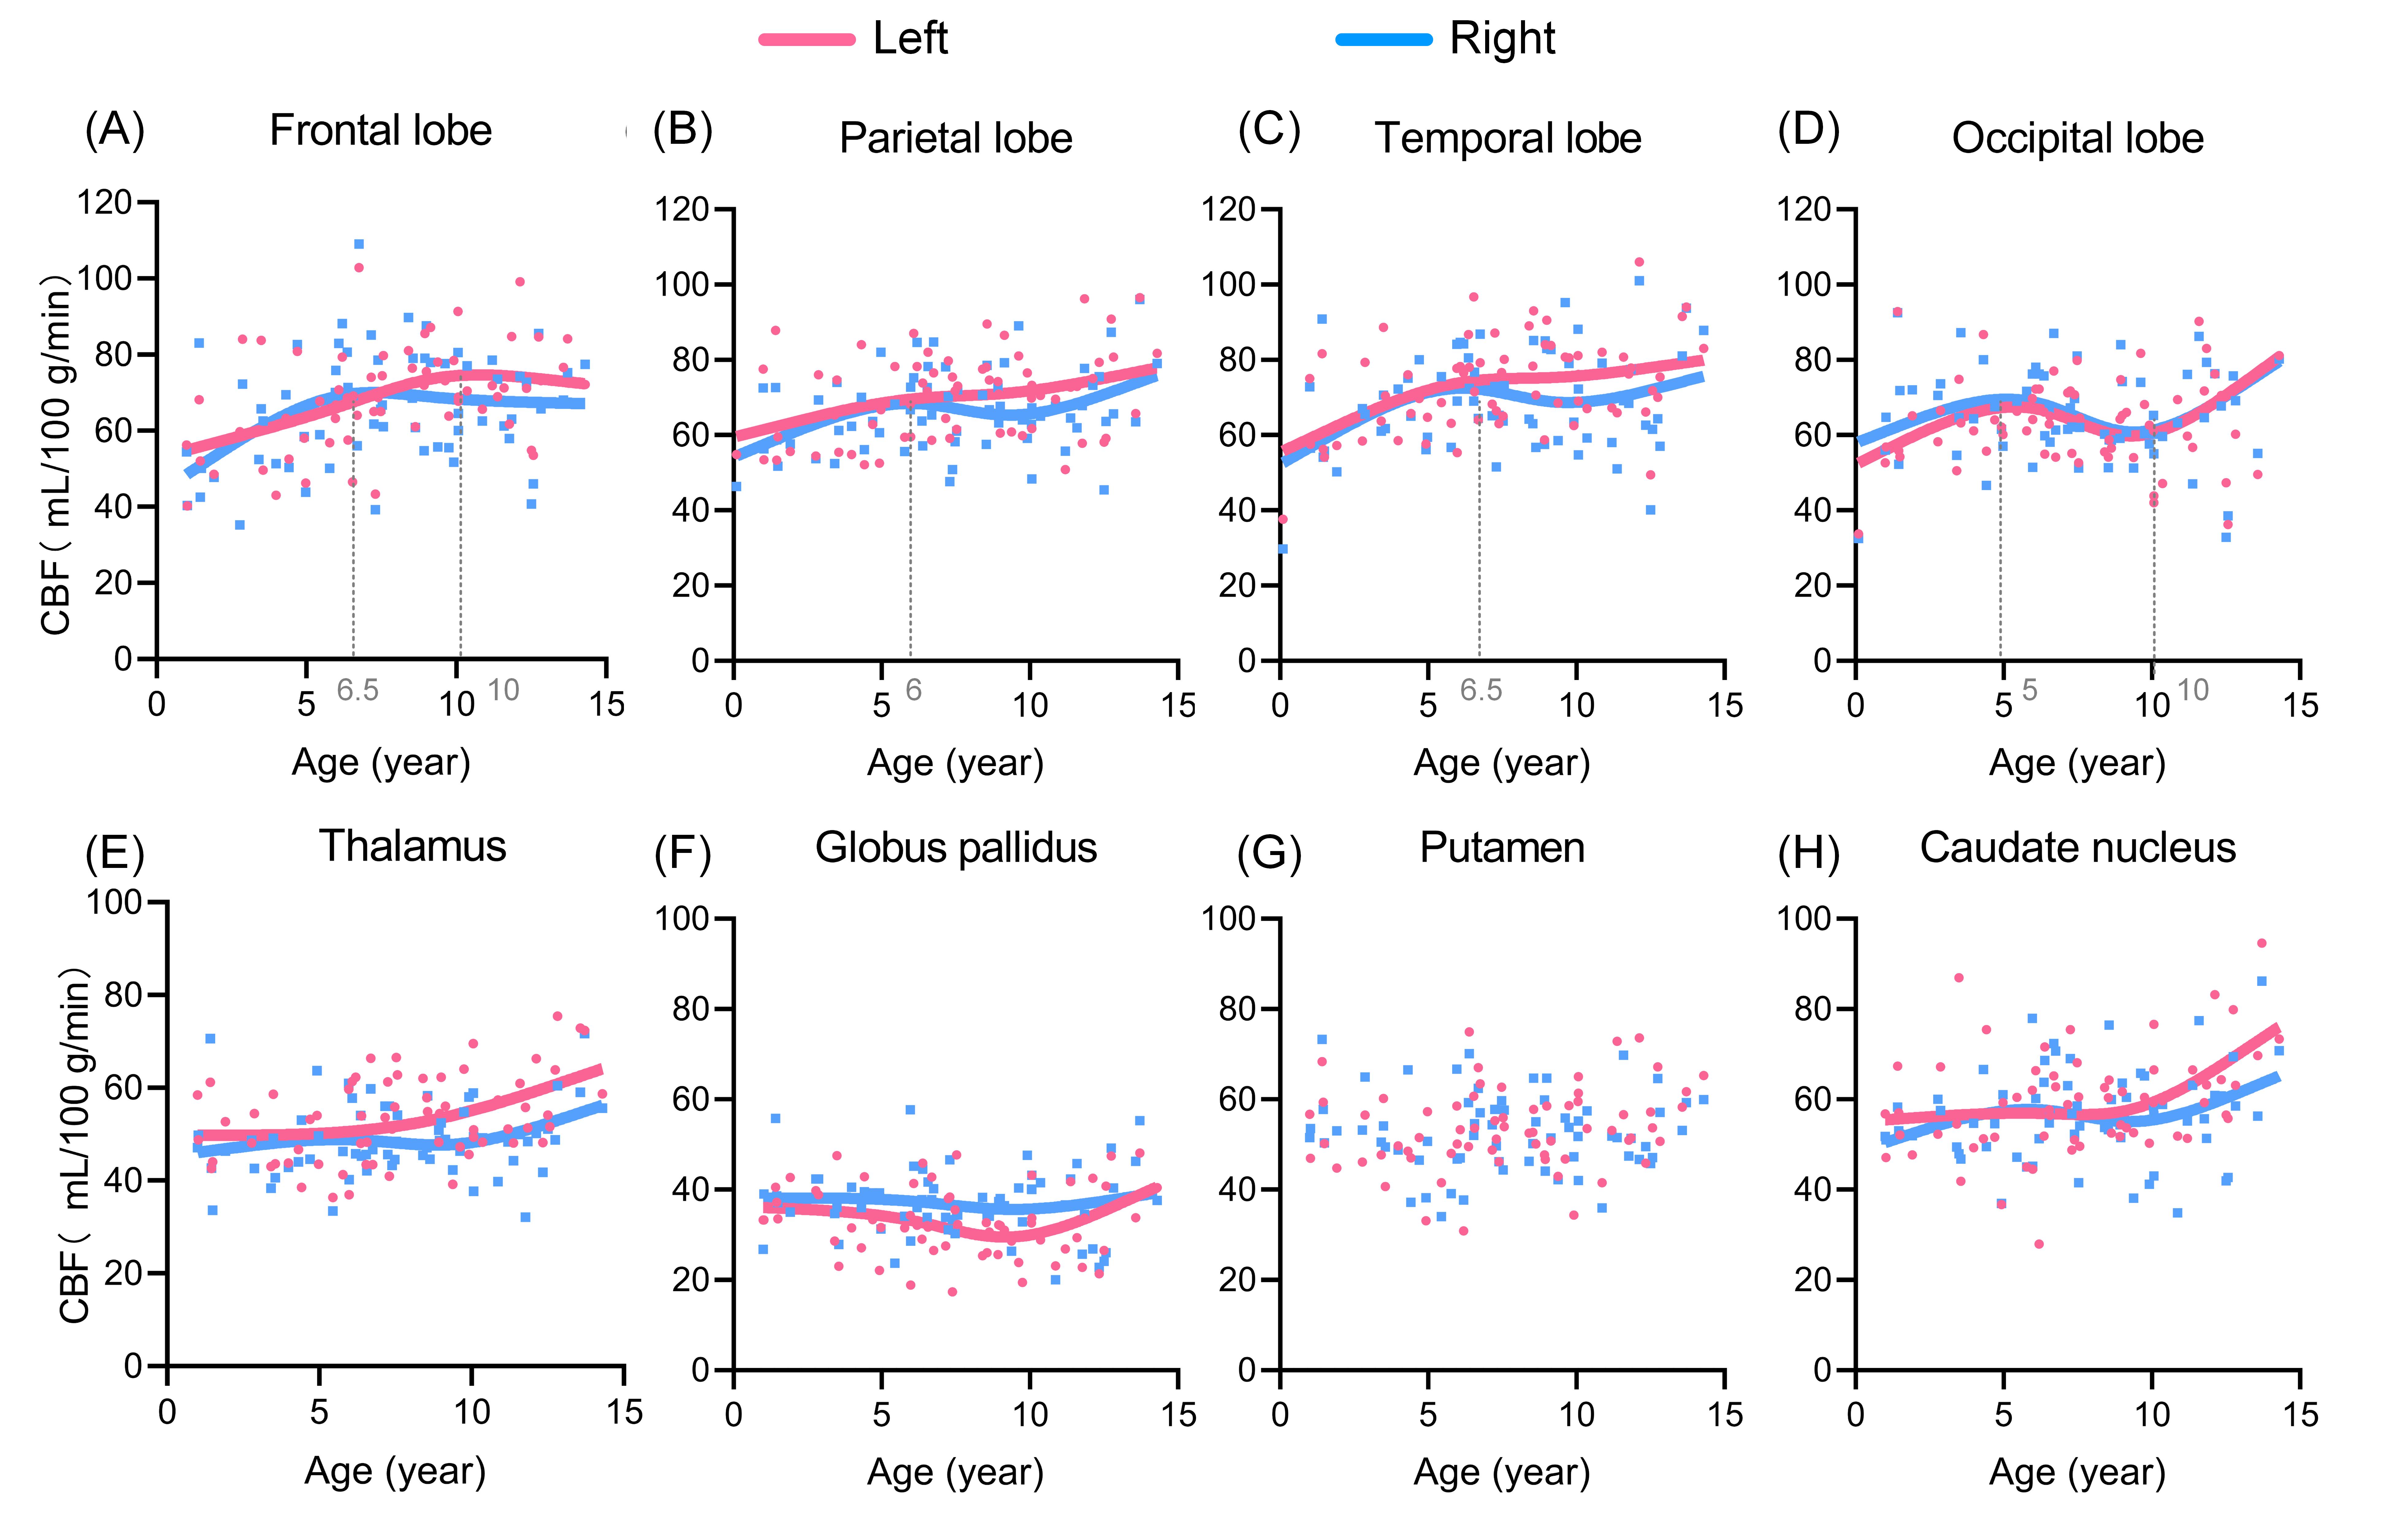
In the frontal, parietal and temporal lobe, age-related change of CBF in both hemispheres showed inverted U-shaped trajectories (Figure 2). In the frontal lobe, the estimated ages for the highest CBF were 10 years old in the left hemisphere and 6.5 years old in the right hemisphere. The estimated ages with highest CBF in parietal and temporal lobe were 6 and 6.5 years, respectively. However, in the occipital lobe, the age-related change of CBF showed an inverted U-shape followed by a U-shape curve trajectory for both hemispheres. The CBF increased before 5 years of age, decreased during 5-10 years of age, and increased again after 10 years of age. In the basal ganglia, the CBF of thalamus and caudate nucleus increased with age, the globus pallidus and putamen showed relatively subtle change in brain perfusion.Discussion
Our results indicated that the estimated age with highest CBF was earliest in the occipital lobe, followed by temporal and parietal lobe, at last in the frontal lobe. These results further confirm that brain maturation starts in the occipital lobe, and then in the temporal and parietal lobe, followed by the frontal lobe. This is consistent with the established developmental pattern of brain function.Brain maturation begins at regions with basic functions, such as primary sensorimotor area, and those involved in higher cognitive functions, such as executive functions, mature later 2. The perfusion of basal ganglia showed a slow increasing trend, which may be related to the gradual improvement function in aspects such as motor planning and working memory decision-making with the increase of age3.Conclusion
Our results suggested that the estimated age at which CBF was highest was earlier in the occipital lobe, than in the temporal and parietal lobe, at last in the frontal lobe. The perfusion of basal ganglia showed a u-shaped slowly increasing trend with age.Acknowledgements
This study was supported by the National Natural Science Foundation of China (No. 81771810, 51706178, 81971581), National Key Research and Development Program of China (2016YFC0100300), the Clinical Research Award of the First Affiliated Hospital of Xi’an Jiaotong University (No. XJTU1AF-CRF-2020-005).References
1.Yasuyuki T, Hiroshi H, Yuko S, et al. Correlation between gray matter density-adjusted brain perfusion and age using brain MR images of 202 healthy children.[J].Hum Brain Mapp. 2011 Nov;32(11):1973-85.
2.Alfredo A. On the evolutionary origins of executive functions[J].Brain Cogn. 2008 Oct;68(1):92-9.
3.Lanciego JL, Luquin N, Obeso JA. Functional Neuroanatomy of the Basal Ganglia[J]. Cold Spring Harb Perspect Med. 2012 Dec 1;2(12):a009621.
Figures