2736
The feasibility of 3D pcASL MRI with Multiple post-labeling delay times in evaluating subtypes of parotid gland tumors1Radiology, The First Affiliated Hospital of Nanjing Medical University, Nanjing, China, 2GE Healthcare, MR Research China, Beijing, P.R. China, Beijing, China, 3GE Healthcare, MR Enhanced Application China, Beijing, P.R. China, Beijing, China
Synopsis
In this study, we aimed to investigate 3D pcASL with multiple PLDs in evaluating subtypes of parotid gland tumors. By quantitatively measuring tumor blood flow (TBF) and comparing the values within and between subgroups, we found 3D pcASL with multiple PLDs can differentiate parotid gland tumors and reflect changes of TBF. With these findings, 3D pcASL MRI, especially with short PLD was suggested to evaluate patients with parotid gland tumors in routine clinical practice.
Introduction
Pleomorphic adenomas (PAs), Warthin’s tumors (WTs) and malignant tumors (MTs) are the most common subtypes of parotid gland tumors (PT)s [1]. Preparatory PT identification is crucial for proper treatment plan and prognosis [1].In recent years, magnetic resonance imaging (MRI) has been widely used in characterizing PTs [2]. 3D pseudo-continuous arterial spin labeling (3D pcASL) MRI can quantitatively calculate the tumor blood flow by measuring the proton magnetization in arterial blood [3,4]. Applications of pcASL with a single post-labeling delay (PLD) has been reported in the differentiation of PTs [5]. However, the optimal PLD applied for PT perfusion imaging and the changes of blood flow in PTs still remain to be defined.
Therefore, the aim of our study was to evaluate the feasibility of 3D pcASL with multiple PLDs in differentiating subtypes of parotid gland tumors.
Materials and method
Subjects:Fifty-eight consecutive patients (mean age, 50.38±16.38 years; male/female, 36/22) with parotid gland tumors were enrolled in our study, including 33 patients with PAs, 16 patients with WTs and 9 patients with malignant tumors.
MRI experiment:
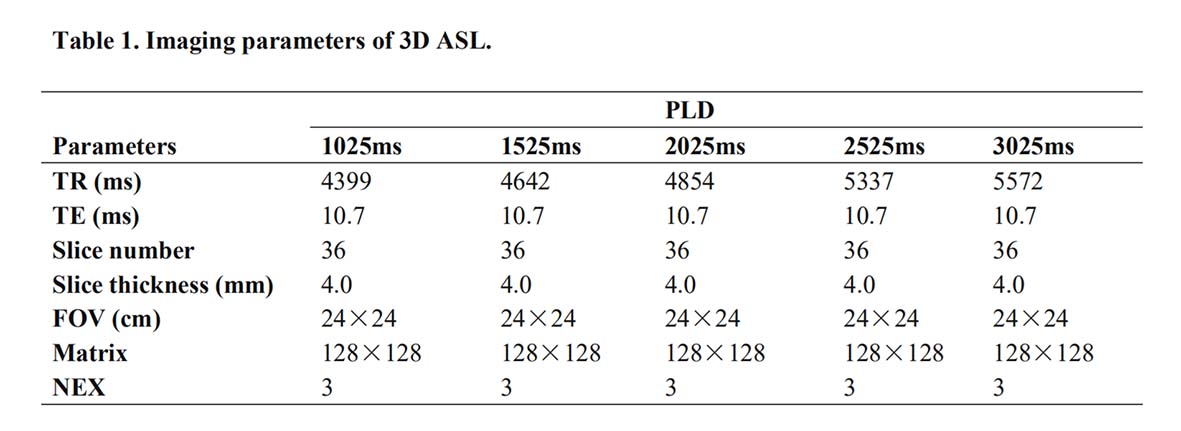
All MRI experiments were performed on an 3.0-T scanner (Discovery 750W, GE, Healthcare, USA) with 24-channel head and neck coil. Clinical routine MRI sequences included coronal fat-suppressed T2WI (repetition time [TR]/echo time [TE], 3695/72ms), axial fat-suppressed T2WI (TR/TE, 3695/85ms) and axial T1WI (T1WI) (TR/TE, 533/14.34ms) were first applied. Additionally, each enrolled patient was scanned with 3D pcASL imaging five times with a specific PLD (1025ms, 1525ms, 2025ms, 2525ms, 3025ms) per time. The labeling slab was placed below the level of common carotid artery. Other scan parameters for 3D ASL were shown in Table 1.
Data analysis:
All acquired 3D pcASL data were analyzed using a vendor-provided post-processing software in GE ADW4.6 workstation (Discovery 750W). 3D pcASL derived tumor blood flow (TBF) parametric mapping was obtained at each PLD for each patient accordingly. A circular ROI (measuring 5-10mm2) was selected on the largest slice of tumor on color perfusion map with PLD of 1525ms by reference to fat-suppressed T2WIs and T1WI, excluding cystic components and necrotic areas. Then the ROI was copied to the color perfusion maps with other PLDs. Once the ROIs on color perfusion maps were determined, the TBF values were generated. Two head and neck senior radiologists were employed for placing the ROIs. The average of two measurements was adopted for further data analysis.
Statistical analysis
All statistical analyses were performed with SPSS software package (v. 23.0; IBM, Armonk, NY) and MedCalc (v. 19.3; MedCalc Software bvba). Kolmogorov-Smirnov test was used to evaluate the normality of the data distribution. To compare the TBF values at different PLDs within PA, WT and MT groups, one-way ANOVA test with post-hoc LSD method or Kruskal-Wallis test with post-hoc Dunn-Bonferroni method was used. The Kruskal-Wallis test with the post-hoc Dunn-Bonferroni method was applied for comparing TBF values between three groups. Receiver operating characteristic (ROC) curves were used to evaluate the diagnostic efficiency of significant variables. P<0.05 was considered a threshold of statistical significance.Results
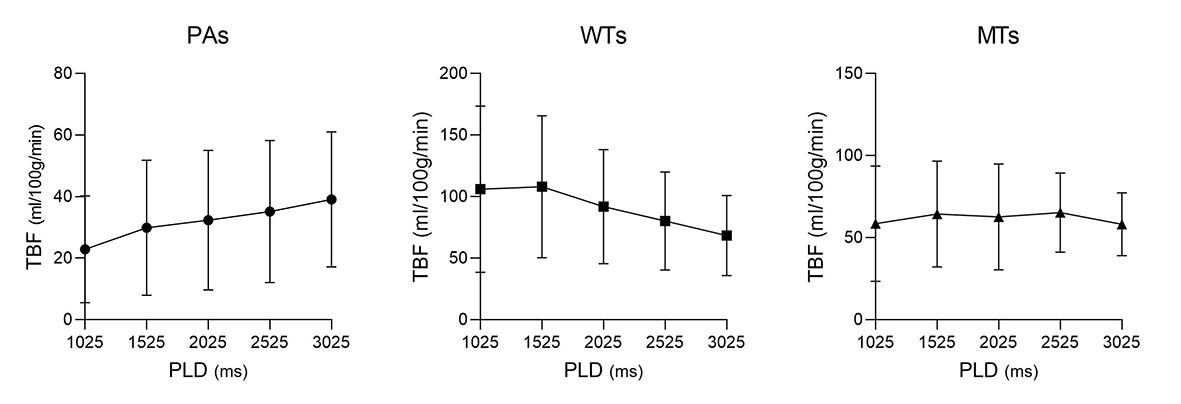
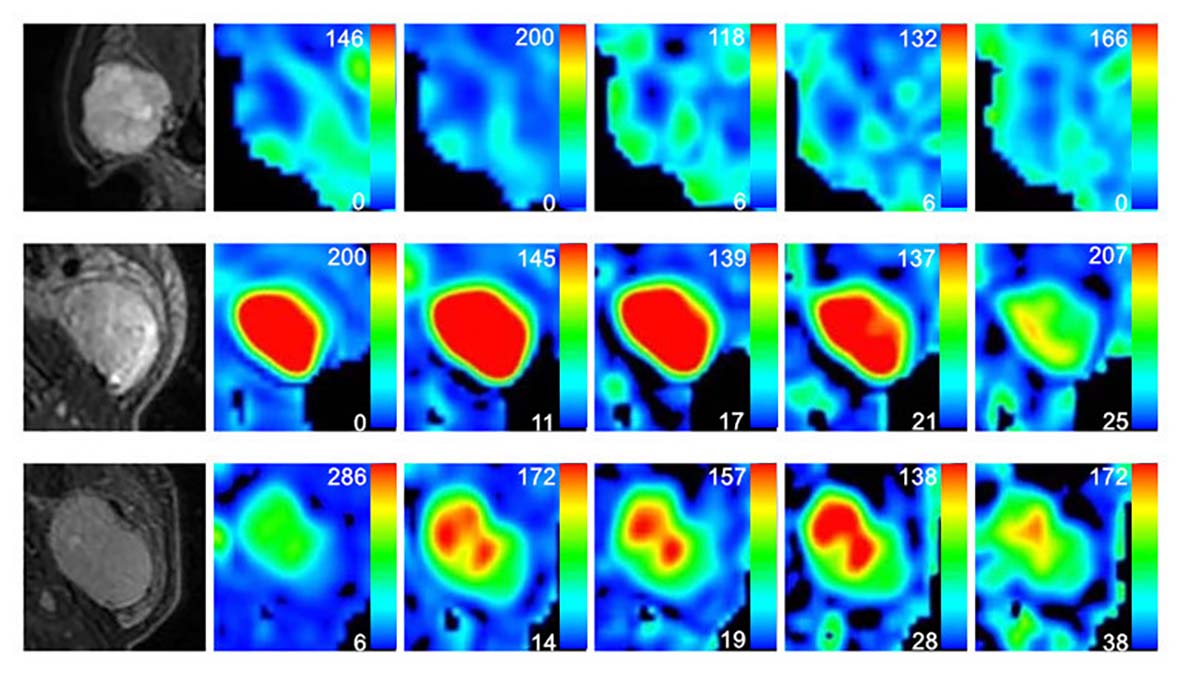
TBF changes on lesions were shown in different subtypes of PTs (Figure 1). Both TBF values at PLDs of 2525ms and 3025ms were significantly higher than that at PLD of 1025ms (P=0.022; P=0.003) within PAs. No significant difference was found in TBF between different PLDs within WT (P=0.175) and MT (P=0.849) groups.PAs showed significant lower TBF values at five different PLDs than WTs (all P<0.05), as well as significantly lower TBF values with almost all PLDs except for 3025ms than MTs (all P<0.05). However, comparable TBFs were observed at five different PLDs between WTs and MTs (all P>0.005) (Table 2). Representative images of PA, WT and squamous cell carcinoma were shown in Figure 2.
Table 3 showed the detailed results of ROC curves analysis. Using ROC analysis, TBF values at PLD of 1525ms revealed the highest area under the curve (AUC) of 0.905 to differentiate PAs from WTs. At PLD of 1025ms, the TBF values ≤23.700 showed the highest AUC of 0.872 to differentiate PAs from MTs.
Discussion
In our study, we investigated the utility of 3D pcASL with multiple PLDs in evaluating the subtypes of PTs. The TBF values of PAs showed an overall upward tendency with increasing PLDs. Additionally, with increased PLDs, the TBF values of WTs tended to slightly increase and then drop again, while stable TBF values were shown for MTs. In accordance with previous studies, 3D ASL derived TBF can help in discriminating PAs from WTs and MTs quantitatively [5]. Furthermore, ROC curve analysis indicated that 3D ASL with PLD of 1025ms or 1525ms showed the optimal diagnostic performance in differentiating PAs from WTs or MTs, respectively. Short PLD is thus recommended to be used in evaluating PTs.Conclusions
In conclusion, 3D pcASL can serve as a noninvasive and quantitative method for differentiating parotid gland tumors and reflecting the variation of tumors blood flow. Short PLD (1025ms or 1525ms) is recommended to be used in characterization of parotid gland tumors in clinical practice.Acknowledgements
NoneReferences
1. Erkan Gökçe. Multiparametric Magnetic Resonance Imaging for the Diagnosis and Differential Diagnosis of Parotid Gland Tumors. J Magn Reson Imaging. 2020;52:11-32.
2. Razek AAKA, Mukherji SK. State-of-the-art imaging of salivary gland tumors. Neuroimaging Clin N Am. 2018;28:303-317.
3. Fujima N, Kudo K, Tsukahara A, et al. Measurement of tumor blood flow in head and neck squamous cell carcinoma by pseudo-continuous arterial spin labeling: comparison with dynamic contrast-enhanced MRI. J Magn Reson Imaging. 2015;41:983-991.
4. Fujima N, Yoshida D, Sakashita T, et al. Usefulness of Pseudocontinuous arterial spin-labeling for the assessment of patients with head and neck squamous cell carcinoma by measuring tumor blood flow in the pretreatment and early treatment period. AJNR Am J Neuroradiol. 2016;37:342-348.
5. Razek AAKA. Multi-parametric MR imaging using pseudo-continuous arterial-spin labeling and diffusion-weighted MR imaging in differentiating subtypes of parotid tumors. J Magn Reson Imaging. 2019;63:55-59.
Figures
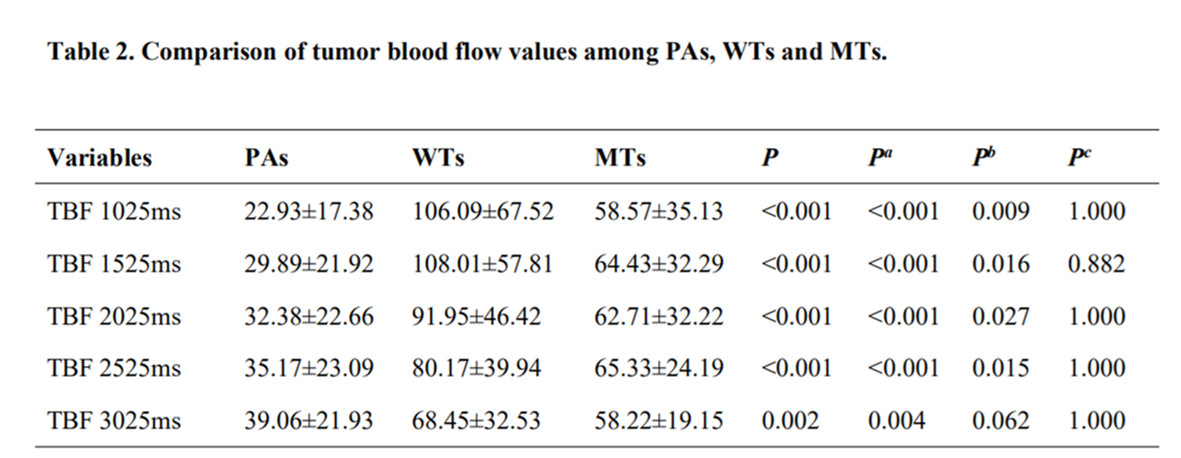
Note: Pa indicates the P value of the comparison between PAs and WTs. Pb indicates the P value of the comparison between PAs and MTs. Pc indicates the P value of the comparison between WTs and MTs.
The units of TBF and ADC are ml/100g/min and ×10-3mm2/s respectively.
Data were presented as mean ± standard deviation.
TBF = tumor blood flow; PAs = pleomorphic adenomas; WTs = Warthin’s tumors; MTs = malignant tumors.
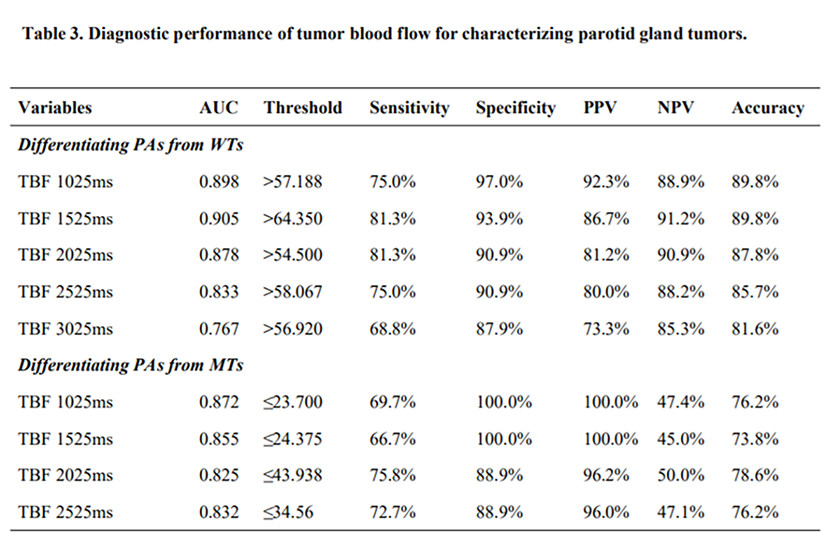
Note: The units of TBF value are ml/100g/min.
TBF = tumor blood flow; PAs = pleomorphic adenomas; WTs = warthin’s tumors; MTs = malignant tumors; AUC = area under the curve. PPV = positive predictive value; NPV = negative predictive value.